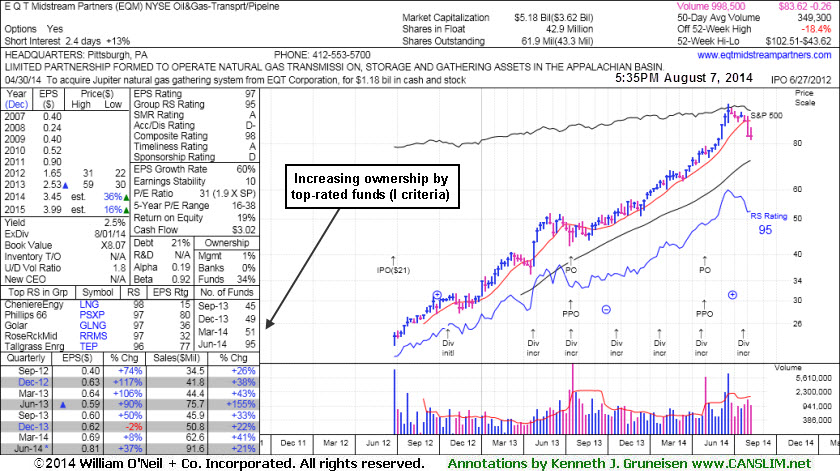
Forming New Base But Fundamental Flaws Remain a Concern - Wednesday, September 03, 2014
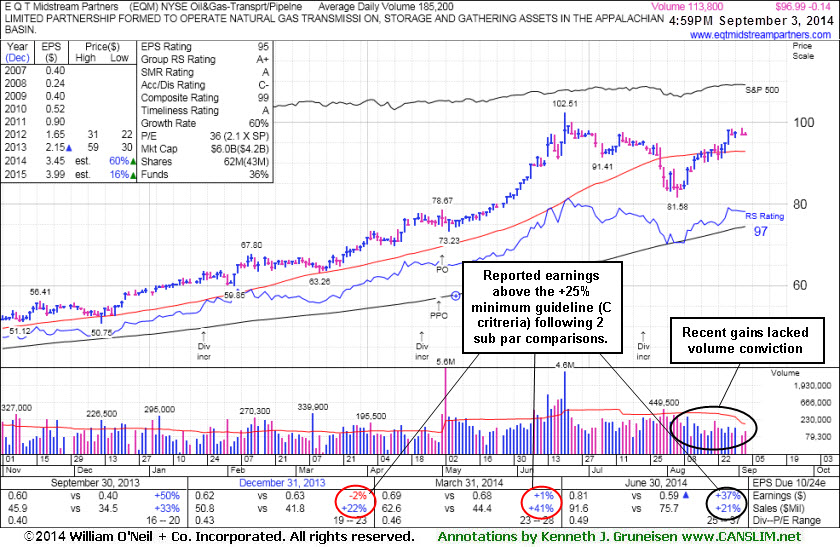
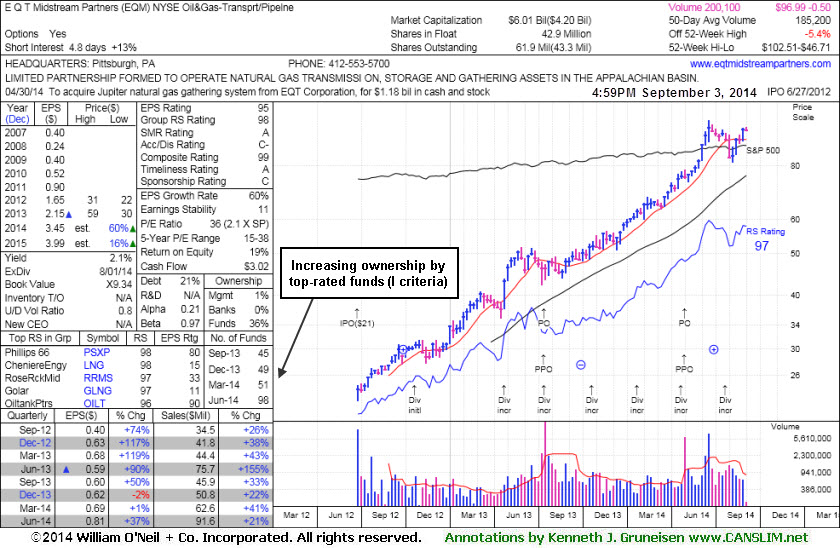
E Q T Midstream Partners' (EQM -$0.14 or -0.14% to $96.99) has very little resistance remaining due to overhead supply while perched -5.4% off its 52-week high. It has only tallied gains with light volume in recent weeks. Technically it is in good shape but no new pivot point is being cited due to previously noted fundamental shortcomings. It reported earnings +37% on +21% sales revenues for the Jun '14 quarter, an improvement after 2 sub par quarterly earnings comparisons.It was last shown in this FSU section on 8/07/14 with annotated graphs under the headline, "Following 50-Day Moving Average Violation Gains Lacked Volume". Recent gains above its 50-day moving average (DMA) line helped its outlook to improve. It completed a new Public Offering of 10.75 Million common units on 5/01/14. It traded up as much as +92.8% since first highlighted in yellow in the 12/12/13 mid-day report (read here) with pivot point based on its 11/18/13 high plus 10 cents. It completed a new Public Offering on 7/16/13, then made gradual progress afterward.
This MLP in the Natural Gas business has seen the number of top-rated funds owning its shares rise from 20 in Jun '12 to 98 in Jun '14, a reassuring sign concerning the I criteria. However, its Up/Down Volume Ratio of 0.8 is an unbiased indication its shares have been under slight distributional pressure over the past 50 days.
Following 50-Day Moving Average Violation Gains Lacked Volume - Thursday, August 07, 2014
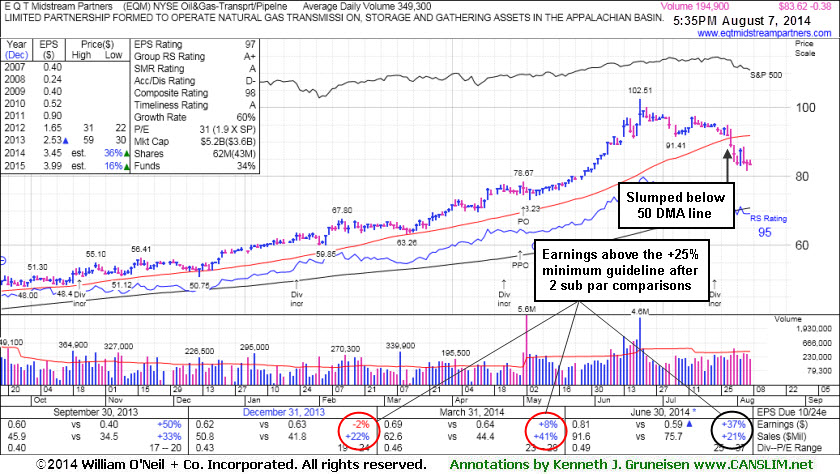
E Q T Midstream Partners' (EQM -$0.38 or -0.45% to $83.62) has only tallied gains with light volume in recent weeks, even after violating its 50-day moving average (DMA) line with volume-driven losses that triggered a technical sell signal. It recently reported earnings +37% on +21% sales revenues for the Jun '14 quarter, an improvement after 2 sub par quarterly earnings comparisons. Technically, it needs gains above its 50 DMA line for its outlook to improve and it faces resistance due to overhead supply while it is consolidating -18.4% off its 52-week high.It was last shown in this FSU section on 7/17/14 with annotated graphs under the headline, "Volume Totals Cooling While Consolidating Near Highs". It completed a new Public Offering of 10.75 Million common units on 5/01/14. It traded up as much as +92.8% since first highlighted in yellow in the 12/12/13 mid-day report (read here) with pivot point based on its 11/18/13 high plus 10 cents. It completed a new Public Offering on 7/16/13, then made gradual progress afterward. This MLP in the Natural Gas business has seen the number of top-rated funds owning its shares rise from 20 in Jun '12 to 95 in Jun '14, a reassuring sign concerning the I criteria. Its Up/Down Volume Ratio of 1.8 is an unbiased indication its shares have been under accumulation over the past 50 days.
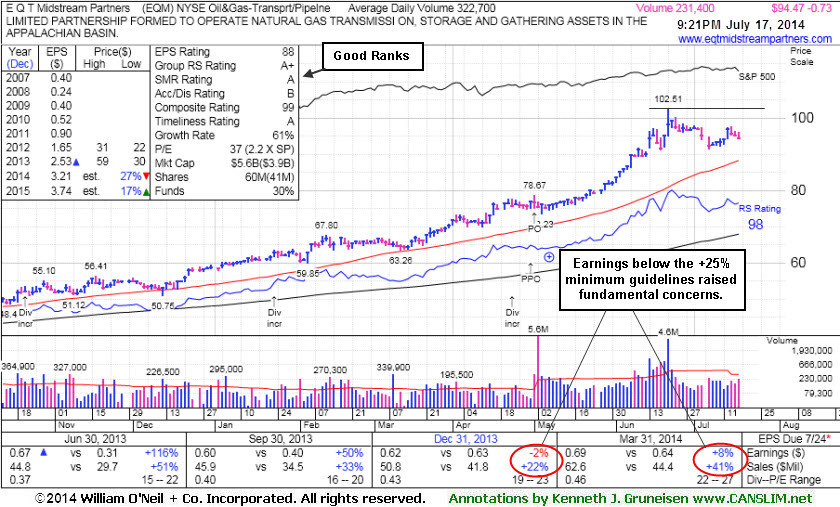
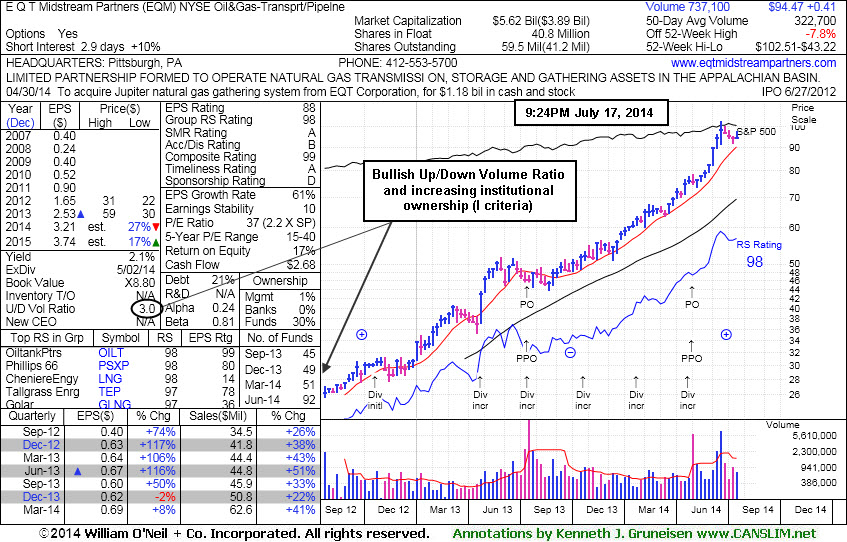
Volume Totals Cooling While Consolidating Near Highs - Thursday, July 17, 2014
E Q T Midstream Partners' (EQM -$0.71 or -0.75% to $94.49) volume totals have been cooling in recent weeks while consolidating well above its 50-day moving average (DMA) line. Strength has continued despite fundamental flaws repeatedly noted. Its last appearance in this FSU section was on 6/25/14 under the headline, "Strength Continued Despite Fundamental Flaws". It is p -7.8% off its 52-week high following today's loss with lighter than average volume.It completed a new Public Offering of 10.75 Million common units on 5/01/14. It traded up as much as +92.8% since first highlighted in yellow in the 12/12/13 mid-day report (read here) with pivot point based on its 11/18/13 high plus 10 cents. The fact-based system suggests watching for technical sell signals rather than selling purely on fundmentals, yet is wise to sometimes lock in gains at the +20% level. For those watching it and still giving it the benefit of the doubt, it is well above its 50-day moving average (DMA) line ($88.25) where a violation may trigger a technical sell signal.
It completed a new Public Offering on 7/16/13, then made gradual progress afterward. This MLP in the Natural Gas business has seen the number of top-rated funds owning its shares rise from 20 in Jun '12 to 92 in Jun '14, a reassuring sign concerning the I criteria. Its Up/Down Volume Ratio of 3.0 is an unbiased indication its shares have been under accumulation over the past 50 days.
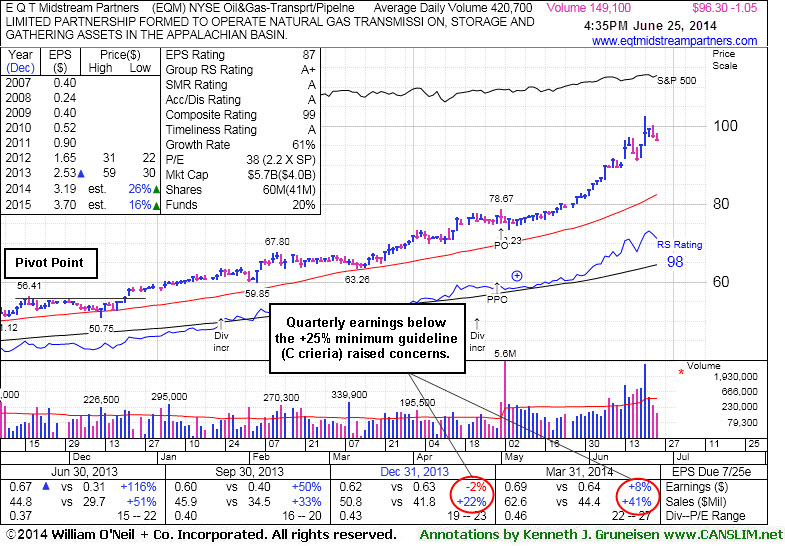
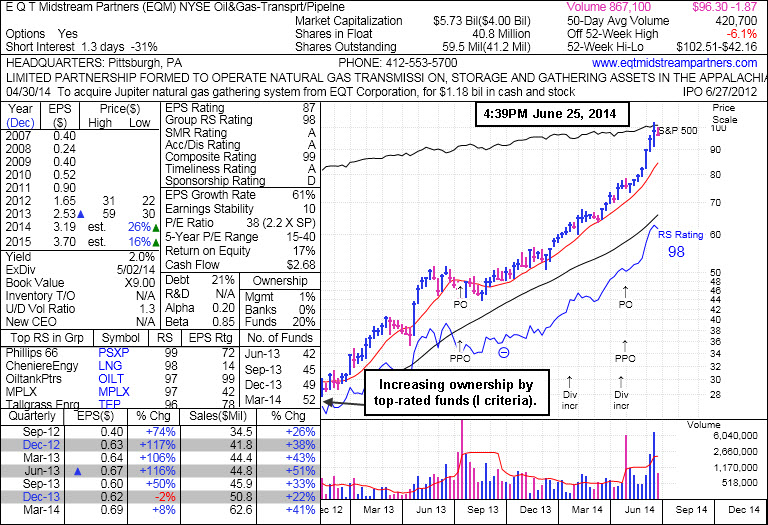
Strength Continued Despite Fundamental Flaws - Wednesday, June 25, 2014
E Q T Midstream Partners (EQM -$1.05 or -1.08% to $96.30) is perched -6.1% off its 52-week high following today's loss with much lighter than average volume. Prior reports repeatedly cautioned members - "It is very extended from any sound base. Fundamental concerns remain after 2 consecutive sub par quarters below the +25% minimum earnings guideline."It completed a new Public Offering of 10.75 Million common units on 5/01/14. Its last appearance in this FSU section was on 6/04/14 under the headline, "New Highs Again With Light Volume Behind Streak of Gains". It traded up as much as +92.8% since first highlighted in yellow in the 12/12/13 mid-day report (read here) with pivot point based on its 11/18/13 high plus 10 cents. The fact-based system suggests watching for technical sell signals rather than selling purely on fundmentals, yet is wise to sometimes lock in gains at the +20% level. For those watching it and still giving it the benefit of the doubt, it is well above its 50-day moving average (DMA) line ($82.43) where a violation may trigger a technical sell signal.
It completed a new Public Offering on 7/16/13, then made gradual progress afterward. This MLP in the Natural Gas business has seen the number of top-rated funds owning its shares rise from 20 in Jun '12 to 52 in Mar '14, a reassuring sign concerning the I criteria. Its Up/Down Volume Ratio of 1.3 is an unbiased indication its shares have been under accumulation over the past 50 days.
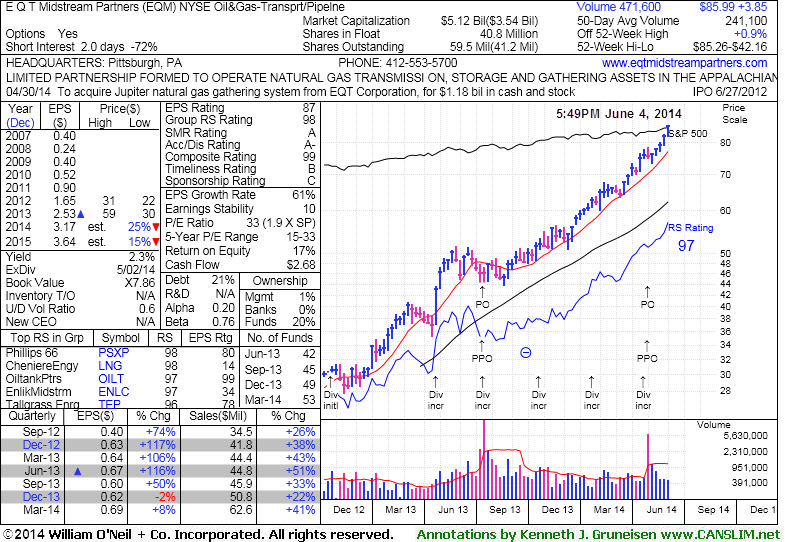
New Highs Again With Light Volume Behind Streak of Gains - Wednesday, June 04, 2014
E Q T Midstream Partners (EQM +$0.95 or +1.12% to $85.99) hit yet another new 52-week high with today's 7th consecutive gain on below average volume. It completed a new Public Offering of 10.75 Million common units on 5/01/14. Fundamental concerns remain after 2 consecutive sub par quarters below the +25% minimum earnings guideline.
Its last appearance in this FSU section was on 5/16/14 under the headline, "Best Ever Close With Light Volume Gain". It is up +61.7% since first highlighted in yellow in the 12/12/13 mid-day report (read here) with pivot point based on its 11/18/13 high plus 10 cents. The fact-based system suggests watching for technical sell signals rather than selling purely on fundmentals, yet is wise to sometimes lock in gains at the +20% level. For those watching it and still giving it the benefit of the doubt, prior highs in the $78 area define near-term support above its 50-day moving average (DMA) line ($75.70) where violations may trigger technical sell signals.
It completed a new Public Offering on 7/16/13, then made gradual progress afterward. This MLP in the Natural Gas business has seen the number of top-rated funds owning its shares rise from 20 in Jun '12 to 53 in Mar '14, a reassuring sign concerning the I criteria. Its Up/Down Volume Ratio of 0.6 is an unbiased indication its shares have been under distributional over the past 50 days.

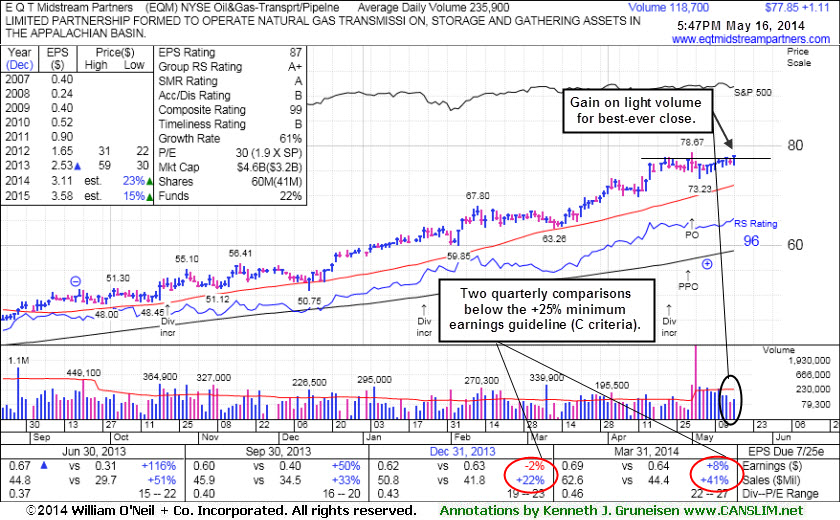
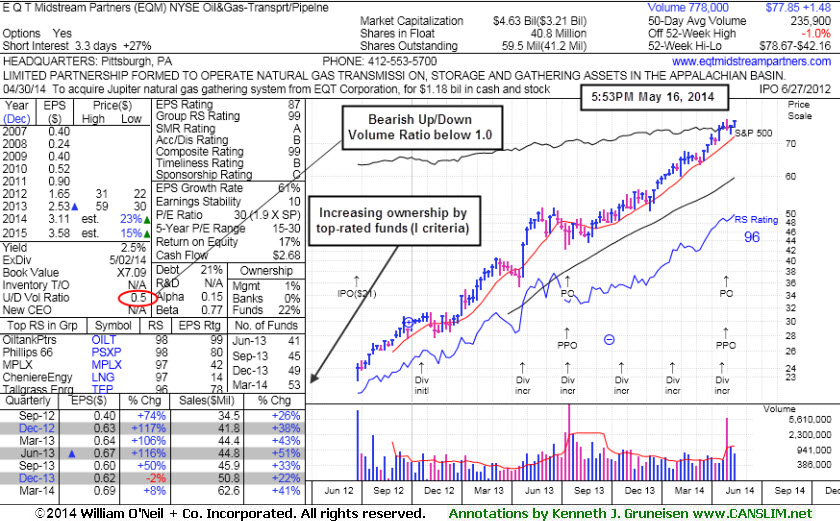
Best Ever Close With Light Volume Gain - Friday, May 16, 2014
E Q T Midstream Partners (EQM +$1.11 or +1.45% to $77.85) inched higher today for a best-ever close with a gain on lighter volume. It completed a new Public Offering of 10.75 Million common units on 5/01/14. Fundamental concerns remain after 2 consecutive sub par quarters below the +25% minimum earnings guideline. Its 50-day moving average (DMA) line ($72.01) defines near-term support where a violation may trigger a technical sell signal. Since its last appearance in this FSU section on 4/28/14 under the headline, "Strength Continues; Earnings Below +25% Minimum Guideline for a 2nd Quarter", it stubbornly held its ground and made gradual progress. It reported earnings +8% on +41% sales revenues for the Mar '14 quarter, a 2nd consecutive quarterly comparison below the +25% minimum earnings guideline (C criteria). Its 50-day moving average (DMA) line ($69.01 now) defines near-term support where a subsequent violation may trigger a technical sell signal.
It is up +46.4% since first highlighted in yellow in the 12/12/13 mid-day report (read here) with new pivot point cited based on its 11/18/13 high plus 10 cents. The fact-based system suggests watching for technical sell signals rather than selling purely on fundmentals, yet is wise to sometimes lock in gains at the +20% level. For those watching it and still giving it the benefit of the doubt, its 50-day moving average (DMA) line defines support for the near term while subsequent violations may trigger more worrisome technical sell signals.
It completed a new Public Offering on 7/16/13, then made gradual progress afterward. This MLP in the Natural Gas business has seen the number of top-rated funds owning its shares rise from 20 in Jun '12 to 53 in Mar '14, a reassuring sign concerning the I criteria. Its Up/Down Volume Ratio of 0.5 is an unbiased indication its shares have been under distributional over the past 50 days.
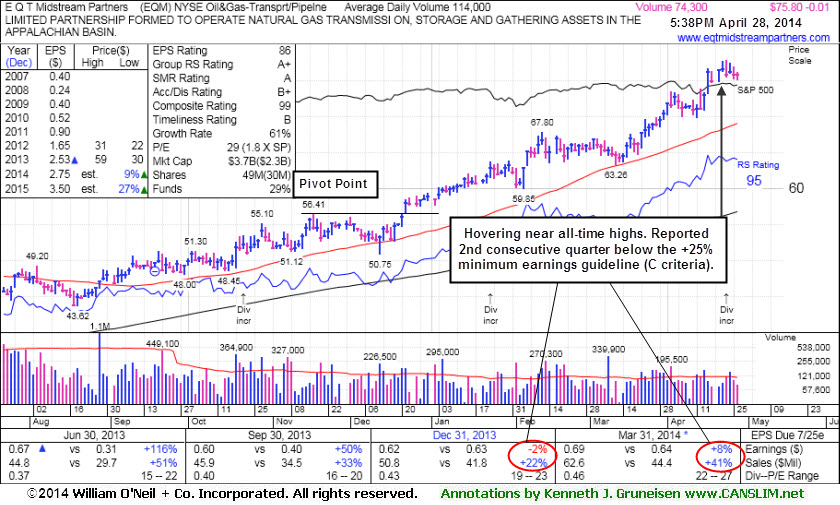
Stength Contiunues; Earnings Below +25% Minimum Guideline for a 2nd Quarter - Monday, April 28, 2014
E Q T Midstream Partners (EQM -$0.01 or -0.01% to $75.80) has been stubbornly holding its ground and making gradual progress. It reported earnings +8% on +41% sales revenues for the Mar '14 quarter, a 2nd consecutive quarterly comparison below the +25% minimum earnings guideline (C criteria). Its 50-day moving average (DMA) line ($69.01 now) defines near-term support where a subsequent violation may trigger a technical sell signal.
Its last appearance in this FSU section was on 4/09/14 under the headline, "Technical Strength Continues Despite Fundamental Concerns". It traded up as much as +46.27% since first highlighted in yellow in the 12/12/13 mid-day report (read here) with new pivot point cited based on its 11/18/13 high plus 10 cents. The fact-based system suggests watching for technical sell signals rather than selling purely on fundmentals, yet is wise to sometimes lock in gains at the +20% level. For those watching it and still giving it the benefit of the doubt, its 50-day moving average (DMA) line defines support for the nearc term, while subsequent violations may trigger more worrisome technical sell signals.
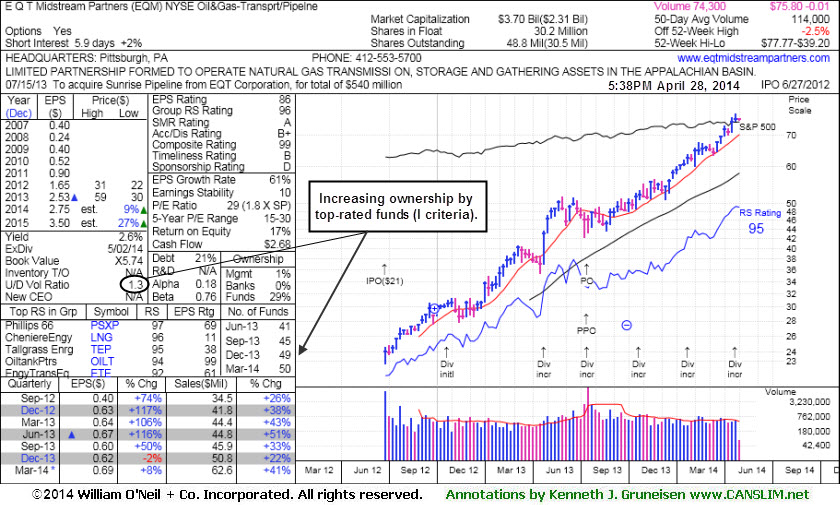
It completed a new Public Offering on 7/16/13, then made gradual progress afterward. This MLP in the Natural Gas business has seen the number of top-rated funds owning its shares rise from 20 in Jun '12 to 50 in Mar '14, a reassuring sign concerning the I criteria. Its Up/Down Volume Ratio of 1.3 is an unbiased indication its shares have been under accumulation over the past 50 days.
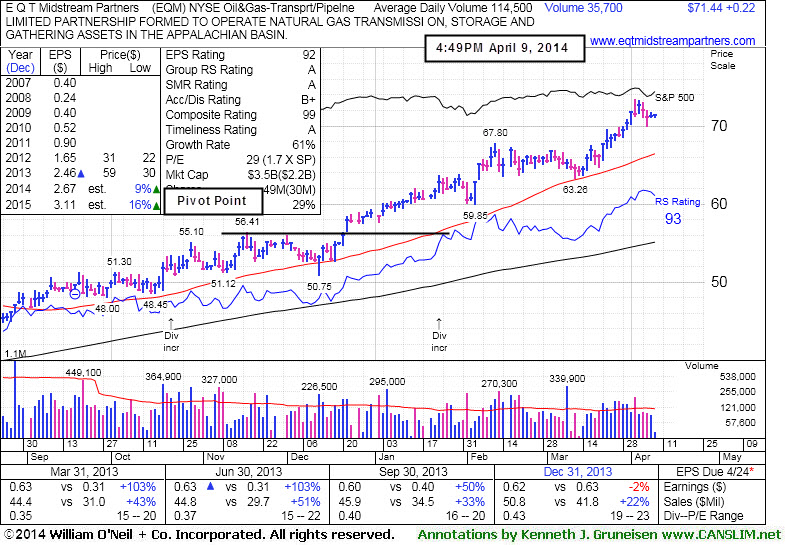
Technical Strength Continues Despite Fundamental Concerns - Wednesday, April 09, 2014
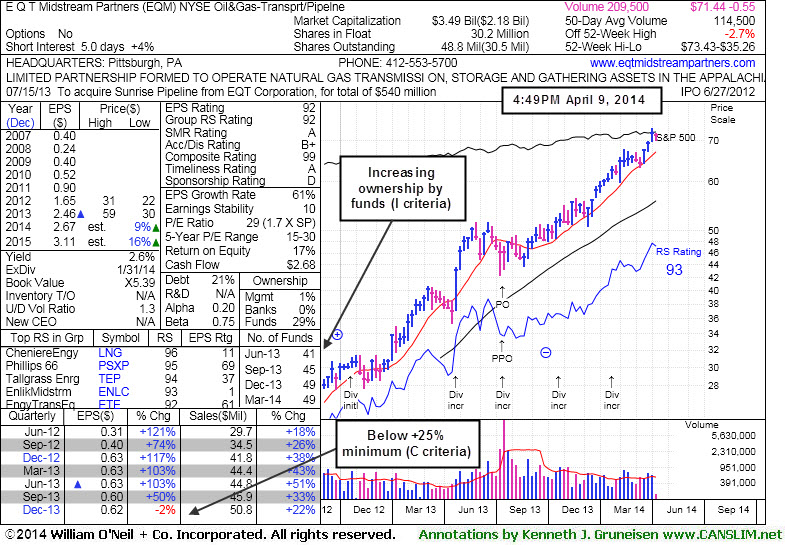
E Q T Midstream Partners (EQM +$0.22 or +0.31% to $71.44) has been stubbornly holding its ground and making gradual progress since reporting earnings -2% on +22% sales revenues for the Dec '13 quarter, below the +25% minimum earnings guideline (C criteria), raising fundamental concerns. Its 50-day moving average (DMA) line ($66.44 now) defines near-term support where a violation may trigger a technical sell signal. Its last appearance in this FSU section was on 3/21/14 under the headline, "Hit New Highs But Fundamental Concerns Remain".
It traded up as much as +38.1% since first highlighted in yellow in the 12/12/13 mid-day report (read here) with new pivot point cited based on its 11/18/13 high plus 10 cents. The fact-based system suggests watching for technical sell signals rather than selling purely on fundmentals, yet is wise to sometimes lock in gains at the +20% level. For those watching it and still giving it the benefit of the doubt, recent lows in the $63 area define near-term support below its 50 DMA line where subsequent violations may trigger more worrisome technical sell signals.
It completed a new Public Offering on 7/16/13, then made gradual progress afterward. This MLP in the Natural Gas business has seen the number of top-rated funds owning its shares rise from 20 in Jun '12 to 49 in Dec '13, a reassuring sign concerning the I criteria. Its Up/Down Volume Ratio of 1.3 is an unbiased indication its shares have been under accumulation over the past 50 days.
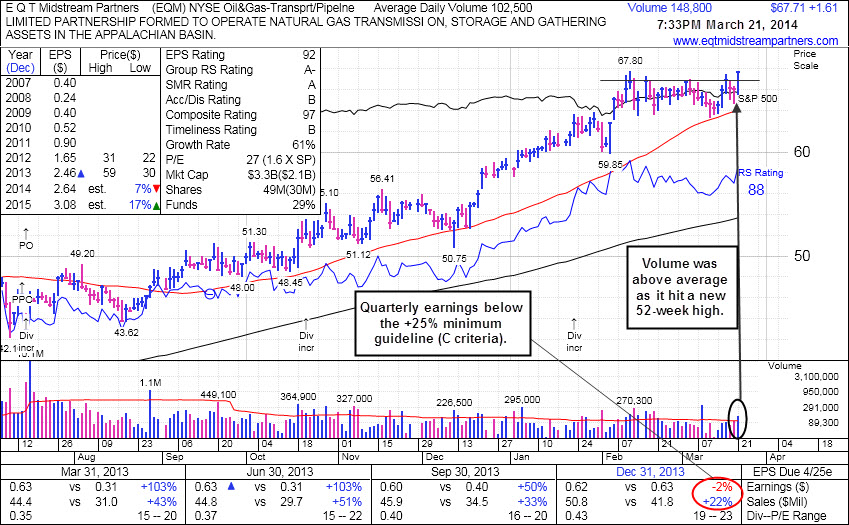
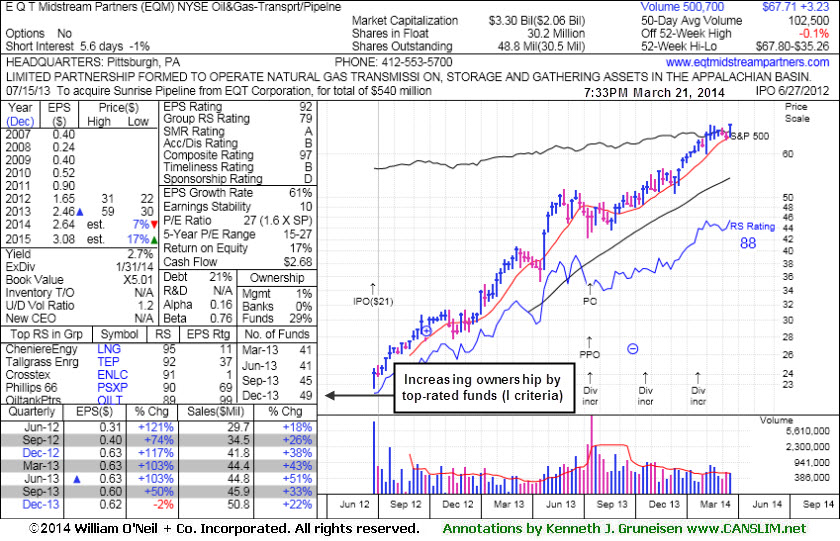
Hit New Highs But Fundamental Concerns Remain - Friday, March 21, 2014
E Q T Midstream Partners (EQM +$1.61 or +2.44% to $67.71) hit a new 52-week high and finished strong with today's volume-driven gain. It recently found support above its 50-day moving average (DMA) line. It has been stubbornly holding its ground since reporting earnings -2% on +22% sales revenues for the Dec '13 quarter, below the +25% minimum earnings guideline (C criteria), raising fundamental concerns. Its 50-day moving average (DMA) line ($64 now) defines near-term support where a violation may trigger a technical sell signal. Its last appearance in this FSU section was on 3/03/14 under the headline, "Resilient Despite Fundamental Concerns".It traded up nearly +20% since first highlighted in yellow in the 12/12/13 mid-day report (read here) with new pivot point cited based on its 11/18/13 high plus 10 cents. The fact-based system suggests watching for technical sell signals rather than selling purely on fundmentals, yet is wise to sometimes lock in gains at the +20% level. For those watching it and still giving it the benefit of the doubt, recent lows in the $63 area define near-term support above its 50-day moving average (DMA) line where subsequent violations may trigger more worrisome technical sell signals.
It completed a new Public Offering on 7/16/13, then made gradual progress afterward. This MLP in the Natural Gas business has seen the number of top-rated funds owning its shares rise from 20 in Jun '12 to 50 in Dec '13, a reassuring sign concerning the I criteria. Its Up/Down Volume Ratio of 1.5 is an unbiased indication its shares have been under accumulation over the past 50 days.
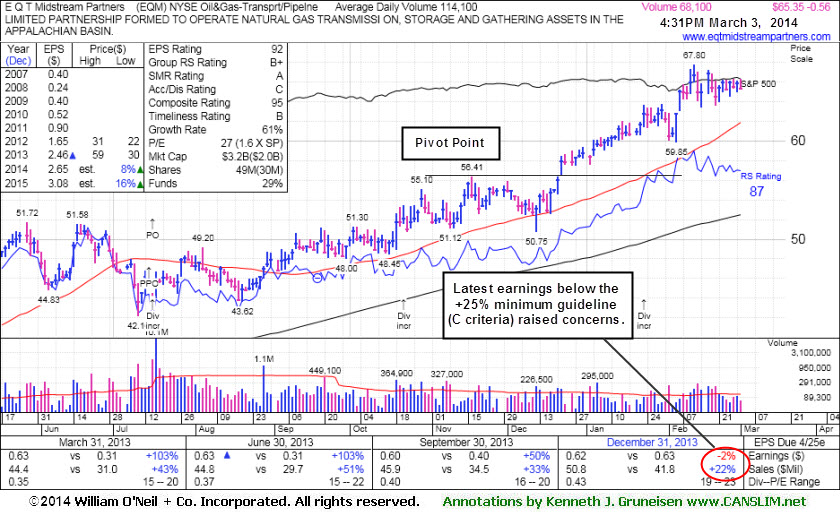
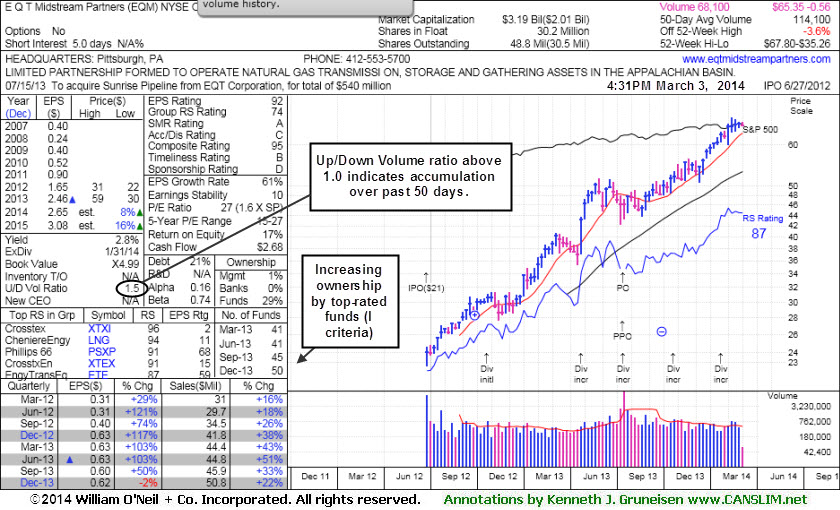
Resilient Despite Fundamental Concerns - Monday, March 03, 2014
E Q T Midstream Partners (EQM -$0.56 or -0.85% to $65.35) has held its ground stubbornly after recently enduring distributional pressure. It reported earnings -2% on +22% sales revenues for the Dec '13 quarter, below the +25% minimum earnings guideline (C criteria), raising fundamental concerns.
It traded up nearly +20% since first highlighted in yellow in the 12/12/13 mid-day report (read here) with new pivot point cited based on its 11/18/13 high plus 10 cents. The fact-based system suggests watching for technical sell signals rather than selling purely on fundmentals, yet is wise to sometimes lock in gains at the +20% level. For those watching it and still giving it the benefit of the doubt, recent lows in the $63 area define near-term support above its 50-day moving average (DMA) line where subsequent violations may trigger more worrisome technical sell signals.
Its last appearance in this FSU section was on 2/07/14 under the headline, "Leader Still Extended From Any Sound Base". It completed a new Public Offering on 7/16/13, then made gradual progress afterward. This MLP in the Natural Gas business has seen the number of top-rated funds owning its shares rise from 20 in Jun '12 to 50 in Dec '13, a reassuring sign concerning the I criteria. Its Up/Down Volume Ratio of 1.5 is an unbiased indication its shares have been under accumulation over the past 50 days.
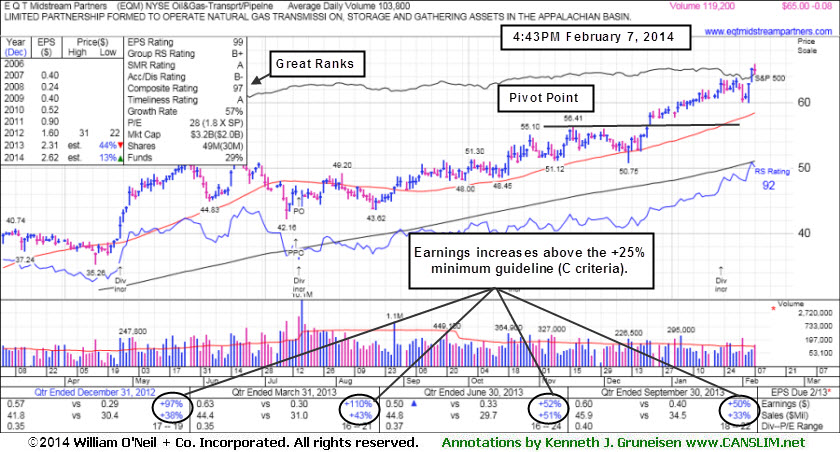
Leader Still Extended From Any Sound Base - Friday, February 07, 2014
E Q T Midstream Partners (EQM -$0.08 or -0.12% to $65.00) touched a new 52-week high today. It is extended from any sound base pattern. Prior highs in the $56 area define support to watch on pullbacks. Its last appearance in this FSU section was on 1/17/14 under the headline, "Extended From Base After Six Consecutive Weekly Gains". It was highlighted in yellow in the 12/12/13 mid-day report (read here) with new pivot point cited based on its 11/18/13 high plus 10 cents.Patient investors may watch for a new base or secondary buy point to possibly develop and be noted in the weeks ahead. Recently it reported earnings +50% on +33% sales revenues for the Sep '13 quarter, continuing its strong earnings history (good C and A criteria). It completed a new Public Offering on 7/16/13, then made gradual progress afterward. This MLP in the Natural Gas business has seen the number of top-rated funds owning its shares rise from 20 in Jun '12 to 49 in Dec '13, a reassuring sign concerning the I criteria. Its Up/Down Volume Ratio of 1.7 is an unbiased indication its shares have been under accumulation over the past 50 days.
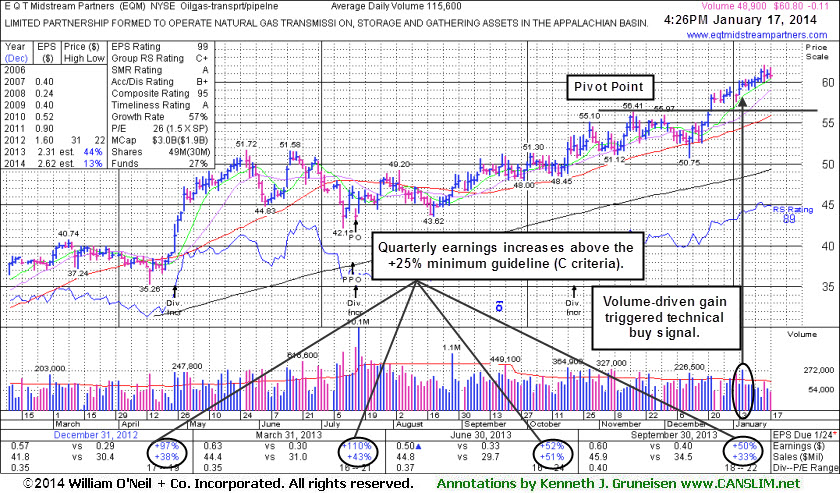
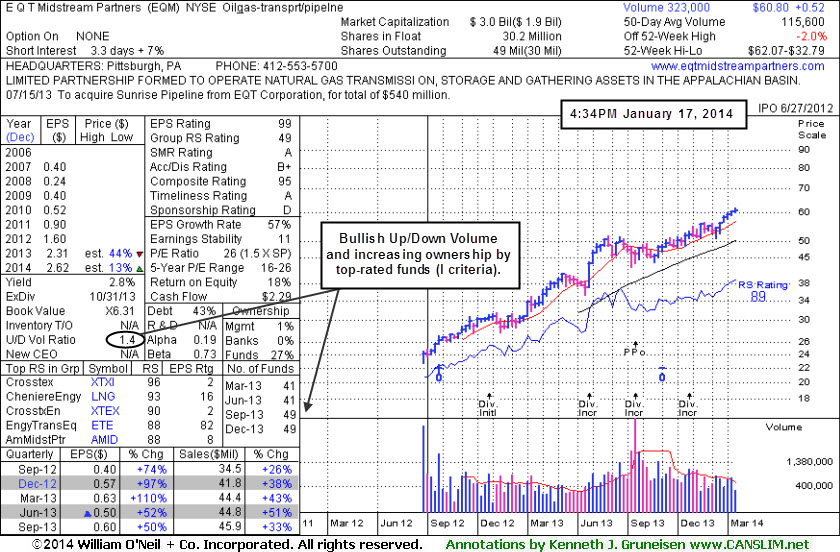
Extended From Base After Six Consecutive Weekly Gains - Friday, January 17, 2014
E Q T Midstream Partners (EQM -$0.24 or -0.39% to $60.67) is quietly perched near its all-time high following a "negative reversal" on 1/15/14 after a streak of 4 consecutive gains on lighter volume. It is extended from any sound base pattern, and its weekly graph shows that it has tallied 6 consecutive weekly gains. Its last appearance in this FSU section was on 12/13/13 under the headline, "Finding Support Near 50-Day Moving Average While Perched Near Highs", after highlighted in yellow in the 12/12/13 mid-day report (read here) with new pivot point cited based on its 11/18/13 high plus 10 cents. It inched into new high territory with light volume, then subsequent volume-driven gains triggered a technical buy signal.Patient investors may watch for a new base or secondary buy point to possibly develop and be noted in the weeks ahead. Meanwhile, near-term support is defined by its 50-day moving average (DMA) line and prior highs in the $56 area which closely coincide. Violations would raise concerns and trigger technical sell signals.
Recently it reported earnings +50% on +33% sales revenues for the Sep '13 quarter, continuing its strong earnings history (good C and A criteria). It completed a new Public Offering on 7/16/13, then made gradual progress afterward. This MLP in the Natural Gas business has seen the number of top-rated funds owning its shares rise from 20 in Jun '12 to 49 in Dec '13, a reassuring sign concerning the I criteria. Its Up/Down Volume Ratio of 1.4 is an unbiased indication its shares have been under accumulation over the past 50 days.
Finding Support Near 50-Day Moving Average While Perched Near Highs - Friday, December 13, 2013
E Q T Midstream Partners (EQM +$1.25 or +2.35% to $54.40) was highlighted in yellow in the 12/12/13 mid-day report (read here) with new pivot point cited based on its 11/18/13 high plus 10 cents. Disciplined investors know there is no advantage to buying "early" and subsequent volume-driven gains for new highs are still needed to trigger a proper technical buy signal before action may be justified under the fact-based investment system. It has been finding support at its 50-day moving average (DMA) line and near prior highs in the $51 area.Recently it reported earnings +50% on +33% sales revenues for the Sep '13 quarter, continuing its strong earnings history (good C and A criteria). Its last appearance in this FSU section was on 7/01/13 under the headline, "Forming New Base While Awaiting New Confirmed Market Rally". It was then dropped from the Featured Stocks list on 7/10/13 and completed a new Public Offering on 7/16/13, then made gradual progress afterward.
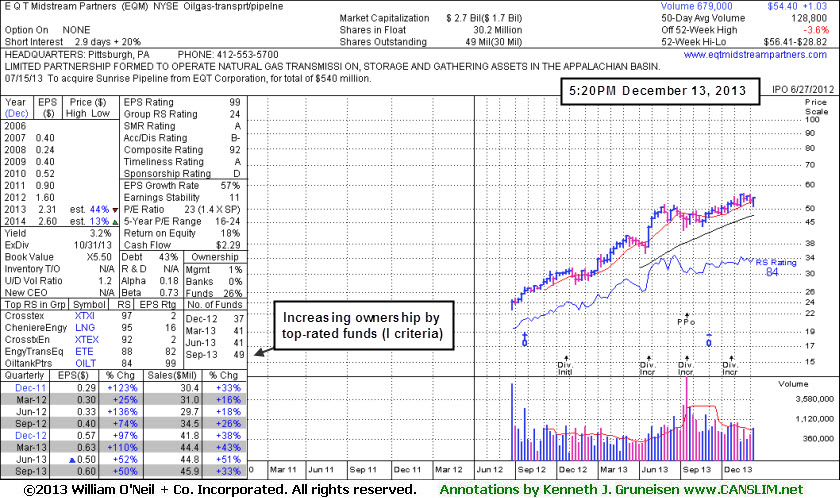
This MLP in the Natural Gas business has seen the number of top-rated funds owning its shares rose from 20 in Jun '12 to 49 in Sep '13, a reassuring sign concerning the I criteria.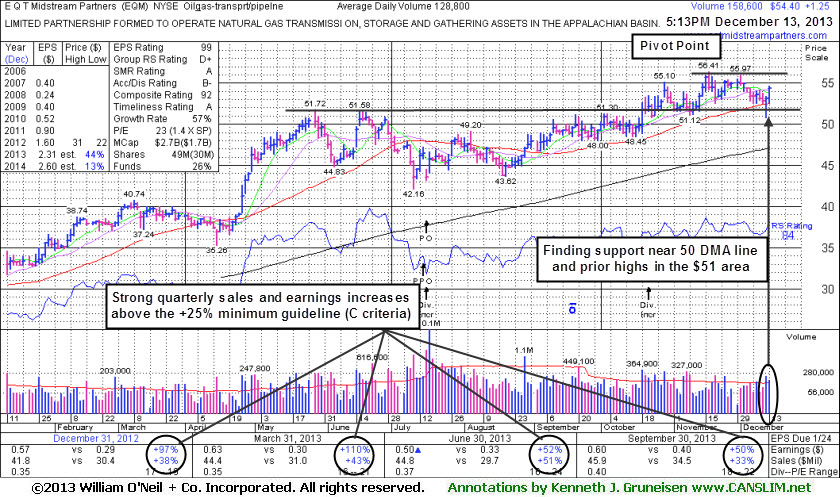
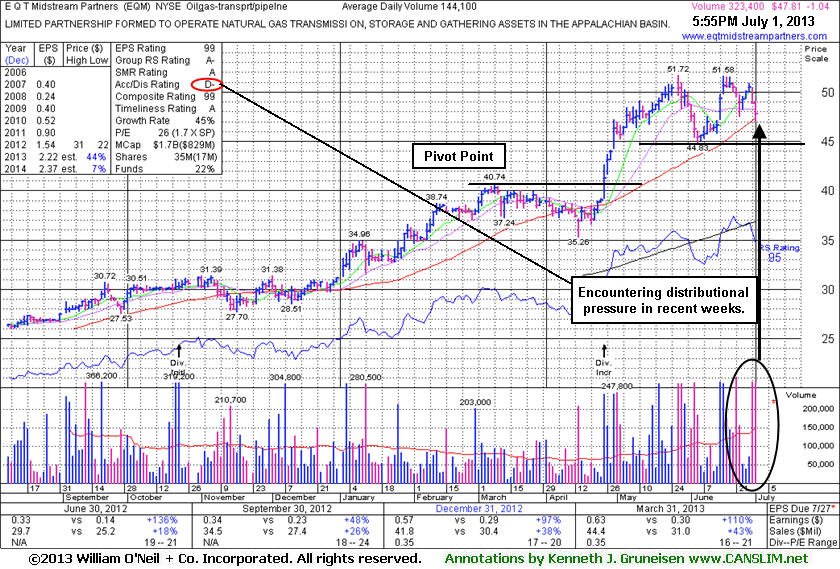
Forming New Base While Awaiting New Confirmed Market Rally - Monday, July 01, 2013
E Q T Midstream Partners (EQM -$1.04 or -2.13% to $47.81) tested support at its 50-day moving average (DMA) line again today with it 2nd consecutive loss backed by above average volume. Below that short-term average, the prior low ($44.83 on 6/05/13) defines the next important support level to watch. Its Accumulation/Distribution Rating has slumped to a D- from a B- when last appearing in this FSU section on 6/21/13 with an annotated graph under the headline, "Perched Near 52-Week High Enduring Distributional Pressure ". There was a "negative reversal" on 5/28/13 at its 52-week high. All new buying efforts are off while the major averages are in a correction, since 3 out of 4 stocks follow the direction of the major averages (M criteria). Patient investors may watch for a new confirmed rally to possibly be noted in the weeks ahead, meanwhile this high-ranked leader may be building a new base.
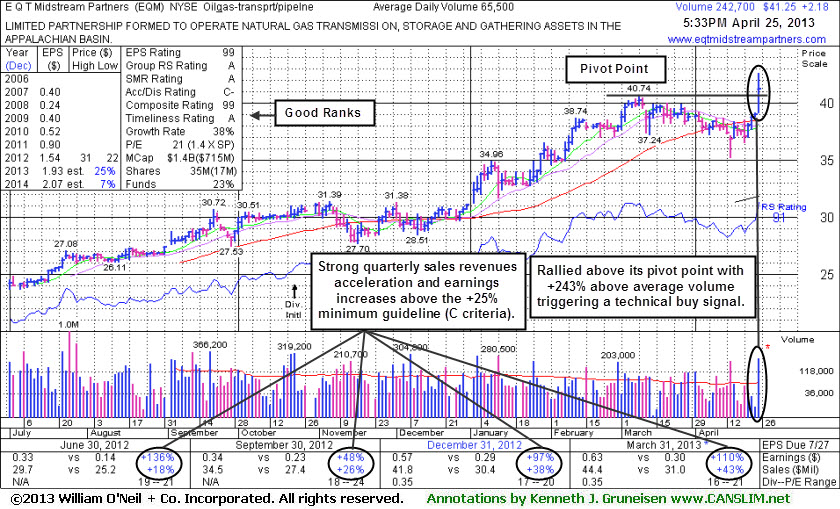
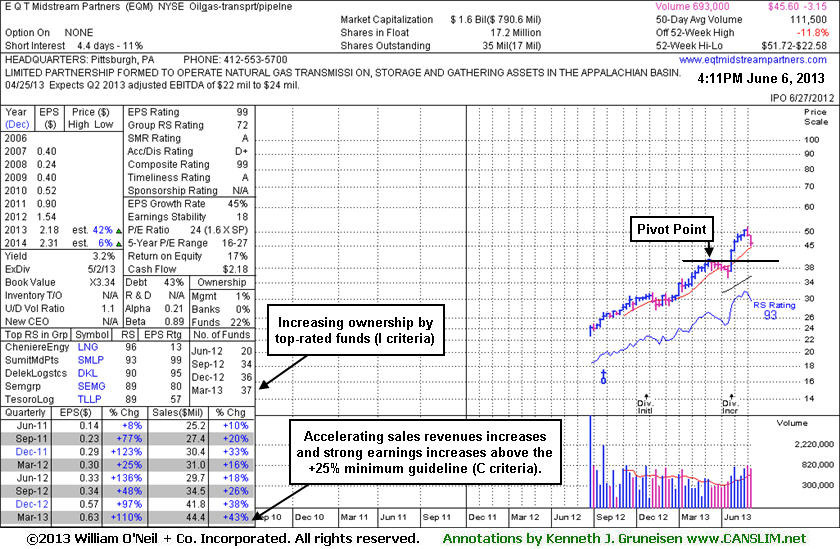
This MLP in the Natural Gas business reported strong results for the Mar '13 quarter, and quarterly earnings increases above the +25% minimum guideline (C criteria). Accelerating sales revenues increases are very reassuring, as its sales revenues increased by +18%, +26%, +38%, and +43% in the Jun, Sep, Dec '12 and Mar '13 quarters versus the year-ago periods, respectively. The number of top-rated funds owning its shares rose from 20 in Jun '12 to 38 in Mar '13, a reassuring sign concerning the I criteria.
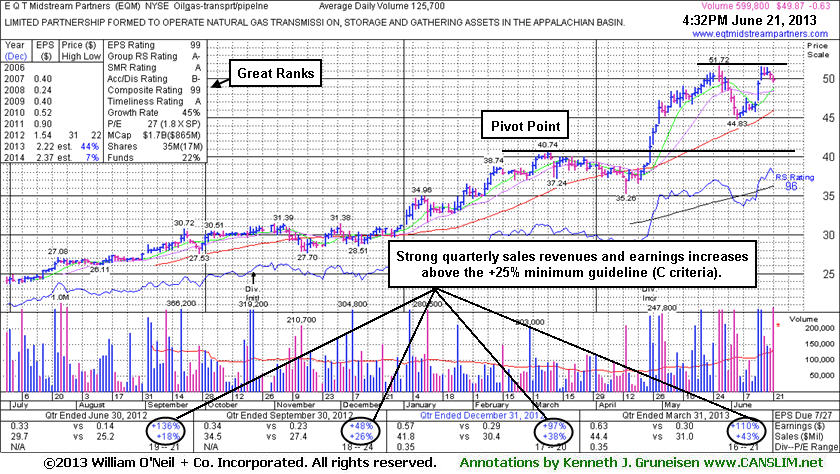
Perched Near 52-Week High Enduring Distributional Pressure - Friday, June 21, 2013
E Q T Midstream Partners (EQM -$0.63 or -1.25% to $49.87) ended with a loss on above average volume, encountering distributional pressure after challenging its 52-week high this week. The recent low and its 50-day moving average (DMA) line define important near-term support in the $45 area. There was a "negative reversal" on 5/28/13 at its 52-week high. Having rallied more than +20% in the first 2-3 weeks after its breakout, the investment system rules suggested holding such winners for a minimum of 8 weeks. This rule is because many of the investment system's biggest winners and best examples among the winning models were those companies that had tallied big gains shortly after their breakouts, then went on to produce dramatic gains. It has been more than 8 weeks since its 4/25/13 breakout now, and it remains in healthy shape, however more damaging losses and subsequent weakness in the broader market may prompt investors into selling and protecting their hard fought gains.EQM was last shown in this FSU section on 6/06/13 with an annotated graph under the headline, "Retreating Toward 10-Week Moving Average", after 4 consecutive losses and clear signs of distributional pressure. Based on the prior analysis a valid secondary buy point arguably exists from its successful test of support at the 10 WMA line, up to as much as +5% above the latest high ($51.72 X 1.05 = $54.31). However, all new buying efforts are off since the major averages fell into an ugly correction, since 3 out of 4 stocks follow the direction of the major averages (M criteria).
This MLP in the Natural Gas business reported strong results for the Mar '13 quarter, and quarterly earnings increases above the +25% minimum guideline (C criteria). Accelerating sales revenues increases are very reassuring, as its sales revenues increased by +18%, +26%, +38%, and +43% in the Jun, Sep, Dec '12 and Mar '13 quarters versus the year-ago periods, respectively. The number of top-rated funds owning its shares rose from 20 in Jun '12 to 38 in Mar '13, a reassuring sign concerning the I criteria.
Retreating Toward 10-Week Moving Average - Thursday, June 06, 2013
E Q T Midstream Partners (EQM +$0.16 or +0.35% to $45.60) halted its slide today after 4 consecutive losses and clear signs of distributional pressure. It has been retreating since a "negative reversal" on 5/28/13 at its 52-week high. It is still well above its 50-day moving average (DMA) line defining important near-term chart support.
The weekly chart below shows it currently in the 7th week of trading since previous technical breakout, and it is slumping back toward its 10-week moving average (WMA) line, an important chart support level to watch. A valid secondary buy point may come into play upon a successful test of support at the 10 WMA, then up to as much as +5% above the latest high. As always, disciplined investors sell if a stock falls more than -7% from their purchase price. EQM was last shown in this FSU section on 5/16/13 with an annotated graph under the headline, "Big Gains in First Few Weeks After Breakout Bode Well". Having rallied more than +20% in the first 2-3 weeks after its breakout, the investment system rules suggest holding such winners for a minimum of 8 weeks. This rule is because many of the investment system's biggest winners and best examples among the winning models were those companies that had tallied big gains shortly after their breakouts, then went on to produce dramatic gains.
This MLP in the Natural Gas business has reported strong results for the Mar '13 quarter, and quarterly earnings increases above the +25% minimum guideline (C criteria). Accelerating sales revenues increases are very reassuring, as its sales revenues increased by +18%, +26%, +38%, and +43% in the Jun, Sep, Dec '12 and Mar '13 quarters versus the year-ago periods, respectively. The number of top-rated funds owning its shares rose from 20 in Jun '12 to 37 in Mar '13, a reassuring sign concerning the I criteria. However, all bets are off if the major averages fall into an ugly correction, since 3 out of 4 stocks follow the direction of the major averages (M criteria). If there is a technical breakdown in any individual stock you do not have to wait until you are down -7% to sell it, it may be wise to sell it sooner and preserve a small gain, or walk away with an even smaller loss of just a few percentage points.
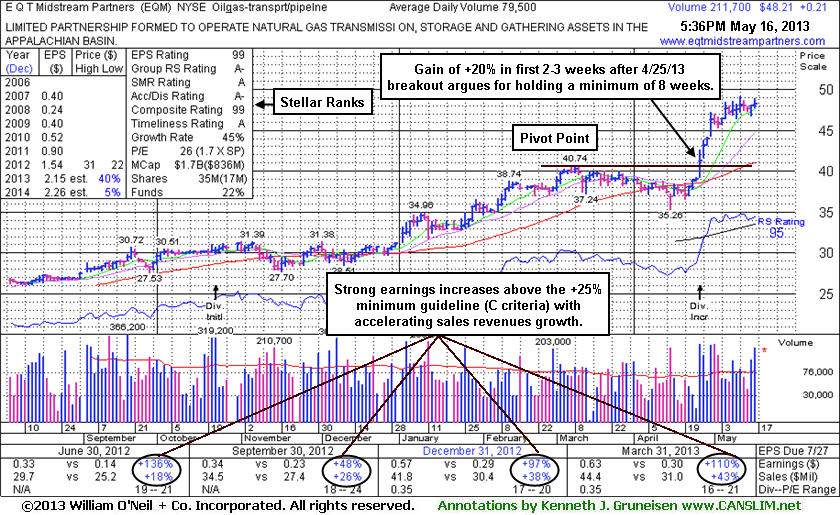
Big Gains in First Few Weeks After Breakout Bode Well - Thursday, May 16, 2013
E Q T Midstream Partners (EQM +$0.21 or +0.44% to $48.21) has been stubbornly holding its ground near its all-time high. It is extended from its latest base, but having rallied more than +20% in the first 2-3 weeks after its breakout, the investment system rules suggest holding such winners for a minimum of 8 weeks. This rule is because many of the investment system's biggest winners and best examples among the winning models were those companies that had tallied big gains shortly after their breakouts, then went on to produce dramatic gains.This MLP in the Natural Gas business has prior highs which coincide with its 50-day moving average (DMA) line defining important near-term chart support to watch in the $41 area. It was last shown in this FSU section on 4/25/13 with an annotated graph under the headline, "Big Volume Behind Surge to New High Territory ", after highlighted in yellow with new pivot point based on its 3/08/13 high plus 10 cents in the earlier mid-day report (click here). A gain with volume +243% above average and strong close above the pivot point of its 8-week flat base triggered a technical buy signal. It was then noted - "That volume total was well above the +40% above average volume threshold which is the bare minimum needed to confirm a proper technical buy signal. Heavy volume with a big price increase and surge into new high territory is a bullish indication of institutional accumulation. It is very reassuring, but not a guarantee that any stock will go on to produce great gains."
EQM rebounded above its 50-day moving average (DMA) line after a bout of distributional pressure prior to its powerful breakout. It reported strong results for the Mar '13 quarter, and quarterly earnings increases above the +25% minimum guideline (C criteria). Accelerating sales revenues increases are very reassuring, as its sales revenues increased by +18%, +26%, +38%, and +43% in the Jun, Sep, Dec '12 and Mar '13 quarters versus the year-ago periods, respectively. The number of top-rated funds owning its shares rose from 20 in Jun '12 to 35 in Mar '13, a reassuring sign concerning the I criteria.
Big Volume Behind Surge to New High Territory - Thursday, April 25, 2013
Often, when a leading stock is setting up to breakout of a solid base it is highlighted in CANSLIM.net's Mid-Day Breakouts Report. The most relevant factors are noted in the report which alerts prudent CANSLIM oriented investors to place the issue in their watch list. After doing any necessary backup research, the investor is prepared to act after the stock triggers a technical buy signal (breaks above its pivot point on more than +50% average turnover) but before it gets too extended from a sound base. In the event the stock fails to trigger a technical buy signal and its price declines then it will simply be removed from the watch list. Disciplined investors know to buy as near as possible to the pivot point and avoid chasing stocks after they have rallied more than +5% above their pivot point. It is crucial to always limit losses whenever any stock heads the wrong direction, and disciplined investors sell if a struggling stock ever falls more than -7% from their purchase price.
E Q T Midstream Partners (EQM +$2.43 or +6.22% to $41.50) was highlighted in yellow with new pivot point based on its 3/08/13 high plus 10 cents in the earlier mid-day report (click here). A volume-driven gain and strong close above the pivot point of its 8-week flat base triggered a new technical buy signal. However, an overriding concern that remains is that the market (M criteria) has not yet confirmed the latest rally attempt with a solid follow through day from at least one of the major averages since the recently noted market correction began. Because 3 out of 4 stocks tend to go in the same direction as the major averages, investors' odds are best when buying stocks while the market is in a confirmed rally.This MLP in the Natural Gas business rallied to a new 52-week high today with volume +243% above average. That volume total was well above the +40% above average volume threshold which is the bare minimum needed to confirm a proper technical buy signal. Heavy volume with a big price increase and surge into new high territory is a bullish indication of institutional accumulation. It is very reassuring, but not a guarantee that any stock will go on to produce great gains.
EQM rebounded above its 50-day moving average (DMA) line after recent distributional pressure. It reported strong results for the Mar '13 quarter, and quarterly earnings increases above the +25% minimum guideline (C criteria) with accelerating sales revenues increases are very reassuring. Prior mid-day reports cautioned - "Limited history is a concern and it has traded up considerably since its 6/27/12 IPO at $21."