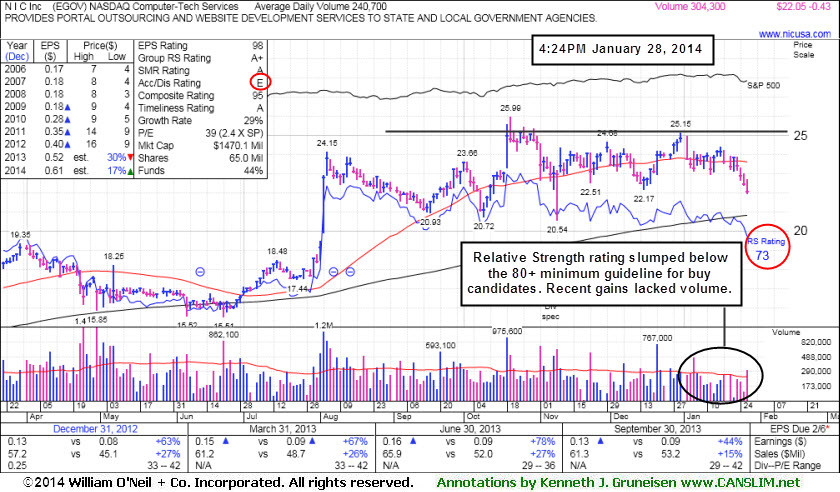
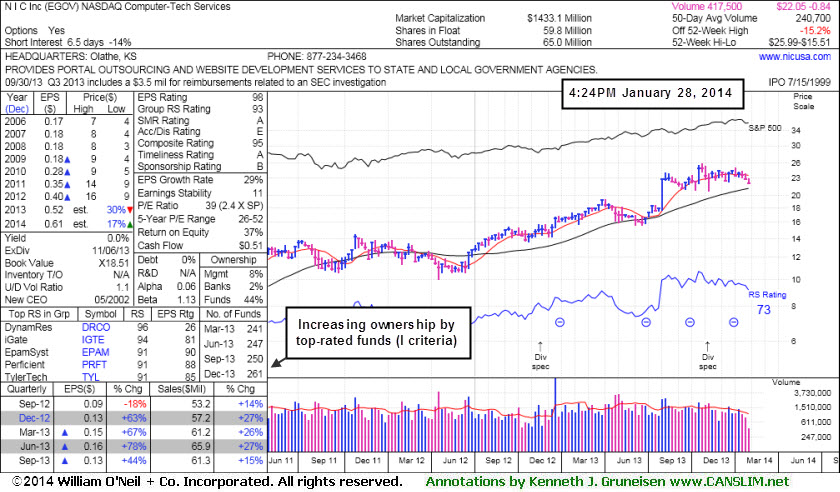
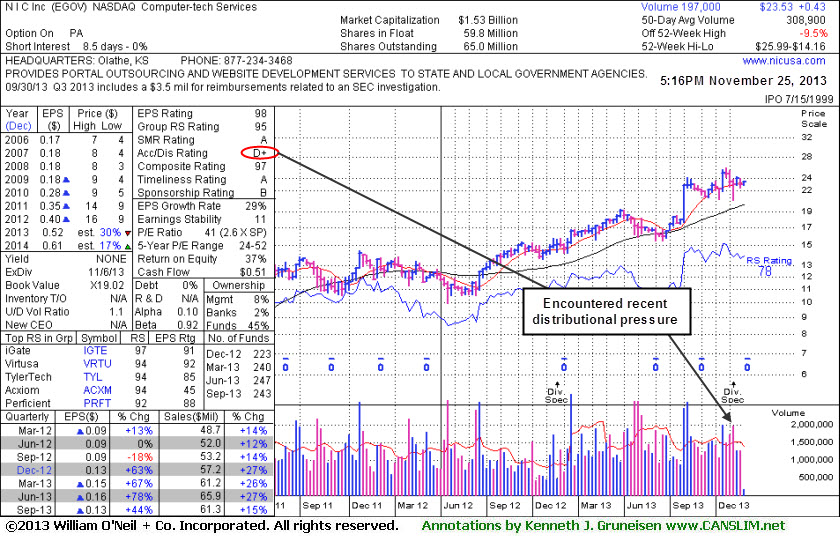
Relative Strength Rating Wanes While Slumping on Higher Volume - Tuesday, January 28, 2014
NIC Inc. (EGOV -$0.49 or -2.18% to $21.99) is still quietly sputtering below its 50-day moving average (DMA) line and its Relative Strength (RS) rating has fallen to 73, below the 80+ minimum guideline for buy candidates. A rally above recent resistance in the $25-26 area is needed for its technical stance to turn bullish. Above average volume was behind its slump below the recent low ($22.17 on 12/16/13), a sign further deterioration raising greater concerns. It was last shown in this FSU section on 12/27/13 with annotated graphs under the headline, "Rebounded Above 50-Day Average; Relative Strength Rating Waned".EGOV needs to rebound above its 50 DMA line for its outlook to improve. Subsequent gains for new highs may offer proof of fresh institutional buying demand that could lead to a sustained and meaningful advance in price. EGOV made only limited progress since highlighted in the 10/18/13 mid-day report (read here) in yellow with an annotated daily graph. One flaw that has developed is that its Relative Strength (RS) rating has slumped to 73, below the 80+ minimum guideline for buy candidates. The stock has earned a high 98 Earnings Per Share (EPS) rating. The company recently reported earnings +44% on +15% sales revenues for the Sep '13 quarter, marking its 4th consecutive quarter with earnings above the +25% minimum guideline (C criteria). However, it was previously noted - "Blue triangles beside the quarterly and annual earnings figures within the datagraphs used by CANSLIM.net experts indicate pre-tax, non-recurring items were included (where possible, such items are normally removed to provide data better suited for comparison)."
The number of top-rated funds owning its shares rose from 223 in Dec '12 to 261 in Dec '13, a somewhat reassuring trend concerning the I criteria. The Computer - Tech Services group has a 93 Group Relative Strength Rating, encouraging news concerning the L criteria. Its small supply of only 65 million shares (S criteria) outstanding can contribute to greater price volatility in the event of institutional buying or selling. Its Accumulation/Distribution rating has also slumped to E, the worst possible rating.
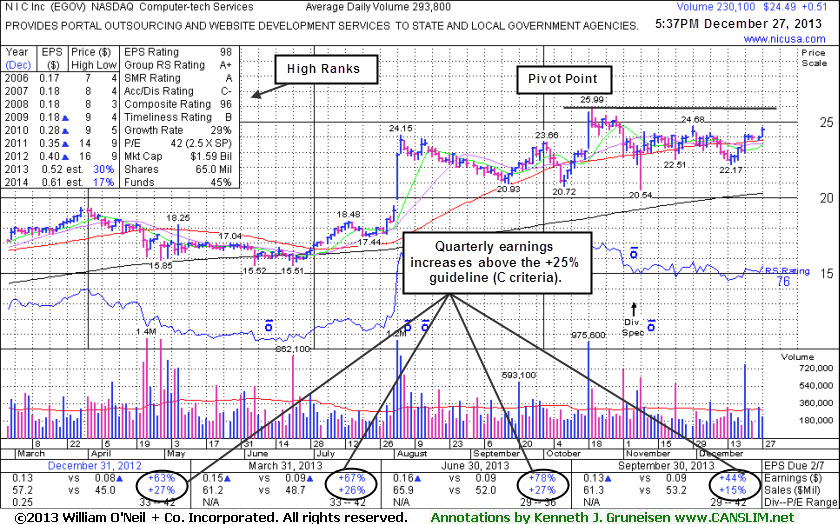
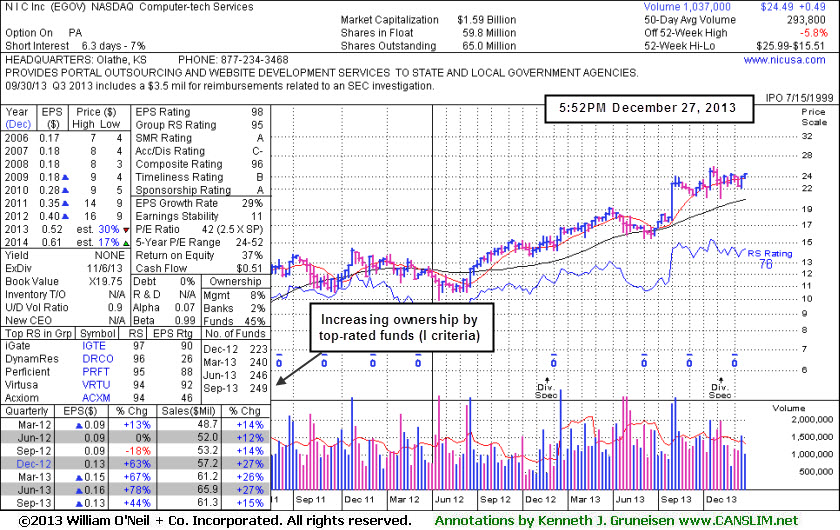
Rebounded Above 50-Day Average; Relative Strength Rating Waned - Friday, December 27, 2013
NIC Inc. (EGOV +$0.51 or +2.13% to $24.49) was last shown in this FSU section on 11/25/13 with an annotated weekly graph under the headline, "Finding Support Near 50-Day Average During Distributional Pressure". It had sputtered below its 50-day moving average (DMA) line in the interim, then a volume-driven gain above that short-term average last Friday helped its technical stance improve. Very little resistance remains due to overhead supply. Subsequent gains for new highs may offer proof of fresh institutional buying demand that could lead to a sustained and meaningful advance in price.
EGOV made only limited progress since highlighted in the 10/18/13 mid-day report (read here) in yellow with an annotated daily graph. One flaw that has developed is that its Relative Strength (RS) rating has slumped to 76, below the 80+ minimum guideline for buy candidates. The stock has earned a high 98 Earnings Per Share (EPS) rating. The company recently reported earnings +44% on +15% sales revenues for the Sep '13 quarter, marking its 4th consecutive quarter with earnings above the +25% minimum guideline (C criteria). However, it was previously noted - "Blue triangles beside the quarterly and annual earnings figures within the datagraphs used by CANSLIM.net experts indicate pre-tax, non-recurring items were included (where possible, such items are normally removed to provide data better suited for comparison)."
The number of top-rated funds owning its shares rose from 223 in Dec '12 to 249 in Sep '13, a somewhat reassuring trend concerning the I criteria. The Computer - Tech Services group has a 95 Group Relative Strength Rating, encouraging news concerning the L criteria. Its small supply of only 65 million shares (S criteria) outstanding can contribute to greater price volatility in the event of institutional buying or selling.
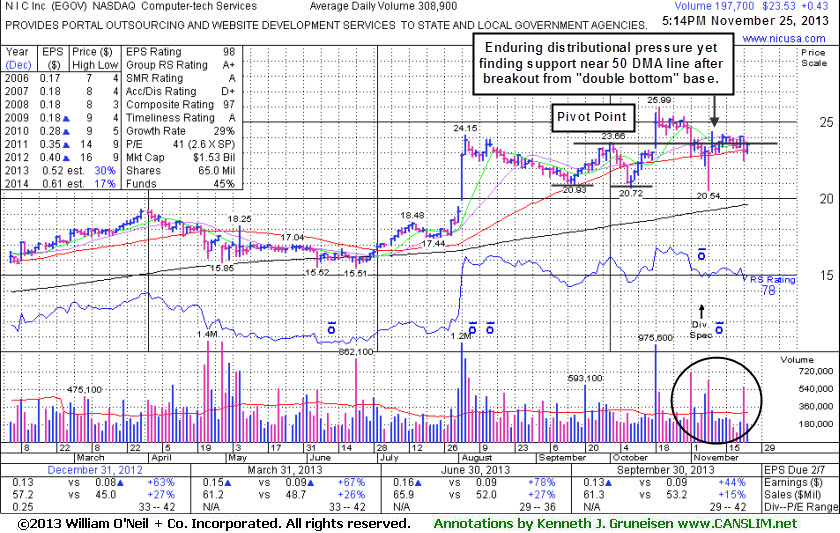
Finding Support Near 50-Day Average During Distributional Pressure - Monday, November 25, 2013
NIC Inc. (EGOV +$1.95 or +8.46% to $24.99) has been finding support near its 50-day moving average (DMA) line, but volume was running at an above average pace behind recent damaging losses, meanwhile its latest gains have lacked great volume conviction. No resistance remains due to overhead supply, however, the weekly and daily graphs below illustrate the distributional action of late. Disciplined investors always limit losses by selling any stock that falls more than -7% from their purchase price.
EGOV was last shown in this FSU section on 10/18/13 with an annotated weekly graph under the headline, "Technical Breakout From "Double Bottom" Base on 3 Times Average Volume", after highlighted in the earlier mid-day report (read here) in yellow with an annotated daily graph showing the pivot point based on its 10/02/13 high. It recently reported earnings +44% on +15% sales revenues for the Sep '13 quarter, marking its 4th consecutive quarter with earnings above the +25% minimum guideline (C criteria). However, it was previously noted - "Blue triangles beside the quarterly and annual earnings figures within the datagraphs used by CANSLIM.net experts indicate pre-tax, non-recurring items were included (where possible, such items are normally removed to provide data better suited for comparison)."
The number of top-rated funds owning its shares rose from 223 in Dec '12 to 241 in Sep '13, a somewhat reassuring trend concerning the I criteria. The Computer - Tech Services group has a 95 Group Relative Strength Rating, encouraging news concerning the L criteria. Its small supply of only 65 million shares (S criteria) outstanding can contribute to greater price volatility in the event of institutional buying or selling.
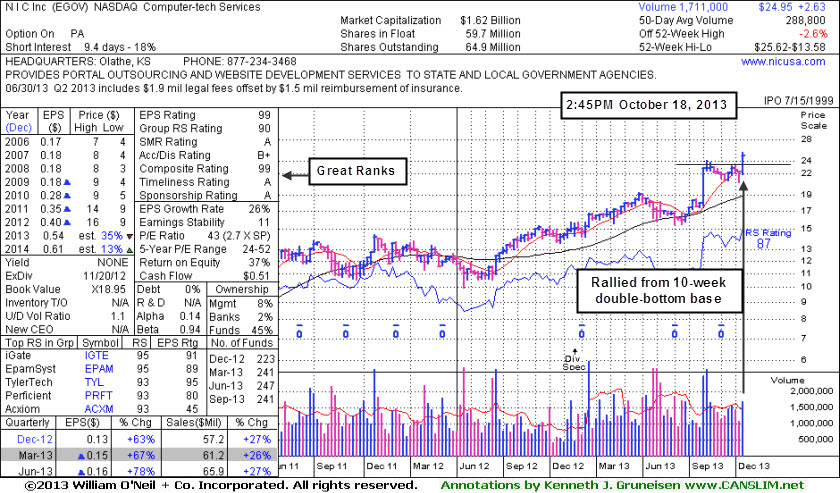
Technical Breakout From "Double Bottom" Base on 3 Times Average Volume - Friday, October 18, 2013
NIC Inc. (EGOV +$1.95 or +8.46% to $24.99) was highlighted in the earlier mid-day report (read here) in yellow with an annotated daily graph showing the pivot point based on its 10/02/13 high. Its volume-driven gain today was backed by more than 3 times average volume, triggering a technical buy signal. While forming the second low it undercut the 50-day moving average (DMA) line and briefly dipped below its September low before rebounding. The fresh breakout came from a "double bottom" base formed since last noted in the 8/20/13 mid-day report with caution - "Reported earnings +78% on +27% sales revenues for the Jun '13 quarter, marking its 3rd consecutive quarter with earnings above the +25% minimum guideline (C criteria). However, blue triangles beside the quarterly and annual earnings figures within the datagraphs used by CANSLIM.net experts indicate pre-tax, non-recurring items were included (where possible, such items are normally removed to provide data better suited for comparison). EGOV found support at its 200 DMA line during its consolidation while building a cup-with-handle base since last noted in the 4/01/13 mid-day report with caution - No resistance remains due to overhead supply. Quarterly and annual earnings (C and A criteria) history has not been strong and steady, and it is fundamentally not a good match with the guidelines of the fact-based investment system.'"
It was last shown in this FSU section on 7/03/06 with an annotated graph under the headline, "Broker Downgrade Hurts Leading Stock", as it got smacked on a broker downgrade. It survived and started making better progress over the past year. The number of top-rated funds owning its shares rose from 223 in Dec '12 to 241 in Sep '13, a somewhat reassuring trend concerning the I criteria. The Computer - Tech Services group has a 90 Group Relative Strength Rating, encouraging news concerning the L criteria. Its small supply of only 64.9 million shares (S criteria) outstanding can contribute to greater price volatility in the event of institutional buying or selling.
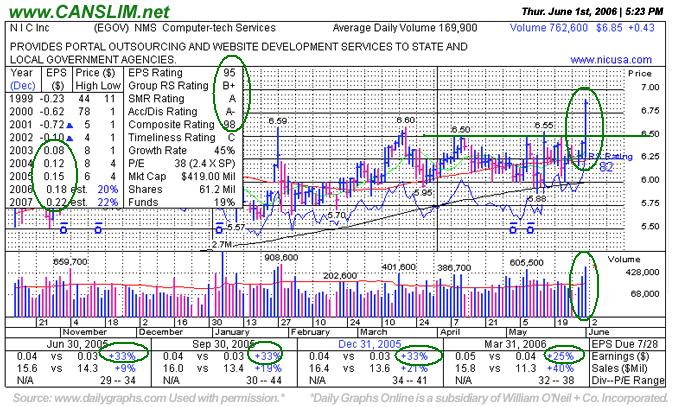
Broker Downgrade Hurts Leading Stock - Monday, July 03, 2006
One of the critical characteristics of successful investing is knowing when to sell. CANSLIM oriented investors are best served when the buy is based on the combination of strong fundamentals and technicals, then the sell based on the technicals. The reason is because fundamentals often tend to laga stock's technical condition and come to light later to help explain the technical chart action after the fact.
NIC Inc. (EGOV -$0.75 or -10.37% to $6.48) got smacked on a broker downgrade on Monday. This stock was first featured on Friday, June 02, 2006 in the CANSLIM.net Mid Day Breakouts Report (read here) with a pivot point of $6.70 and maximum buy price of $7.02. EGOV spent the next few sessions steadily advancing while the major averages were declining. Then on June 8, 2006, the bears tried sending this stock lower. EGOV printed a low of $6.48 that Thursday but rallied into the close and finished at $6.91.
This stock surged over +10% in two weeks and hit a new 52-week high of $7.52. EGOV turned right and spent the next few weeks consolidating its recent move. Then on Monday, July 3, 2006, four weeks after it was featured, EGOV was downgraded and gave back its entire gain. To further compound the issue, EGOV sliced through its 50 day moving average, negated its recent breakout and closed back in its prior base. All this occurred in a single day and on massive volume on a shortened trading day. However it did find support at its 200 DMA and it was interesting to see that EGOV closed exactly at its June 8, 2006 low. Locking in gains and keeping your losses are essential traits to a healthy portfolio.
C A N S L I M | StockTalk | News | Chart | SEC | Zacks Reports

View all notes | Alert me of new notes | CANSLIM.net Company Profile
A Very Impressive Breakout - Thursday, June 01, 2006
|
NIC Inc |
||
|
Ticker Symbol: EGOV (NASDAQ) |
Industry Group: Computer Tech Service |
Shares Outstanding: 61,200,000 |
|
Price: $6.85 4:00PM ET |
Day's Volume: 665,900 |
Shares in Float: 38,000,000 |
|
52 Week High: $6.90 6/1/2006 |
50-Day Average Volume: 169,900 |
Up/Down Volume Ratio: 2.1 |
|
Pivot Point: $6.70 3/21/2006 high plus $0.10 |
Pivot Point +5% = Max Buy Price: $7.03 |
Web Address: http://www.nicusa.com |
C A N S L I M | StockTalk | News | Chart | SEC | Zacks Reports
View all notes | Alert me of new notes | CANSLIM.net Company Profile
CANSLIM.net Profile: NIC Inc. provides portal outsourcing and related software and services for eGovernment, helping governments use the Internet to reduce costs and provide a higher level of service to businesses and citizens. NIC enters into contracts primarily with state governments, and designs, builds and operates Web-based portals on their behalf. The Company's portals consist of Websites and applications that it builds, which allow businesses and citizens to access government information online and complete transactions, including applying for a permit, retrieving driver's license records or filing a form or report. NIC manages operations for each contractual relationship through separate local subsidiaries that operate as decentralized businesses with a high degree of autonomy. The company has increased its earnings by +33%, +33%, +33% and +25% in the past four quarterly financial reports for Jun, Sep, Dec '05 and Mar '06 respectively. The annual earnings history (the “A”) has shown solid increases in the past three years, a 45% Growth Rate, which helps reassure investors of strength in the underlying fundamentals of the company. Return on Equity of 12% falls a bit under the +17% guideline. Management owns an impressive +38% of the float which helps align their interests with those of their shareholders. The Computer-tech Service group is now ranked 49th of 197 Industry Groups, putting it on the edge of the top quartile, thus confirming there is decent group leadership to fulfill the "L" criteria.
What to Look For and What to Look Out For: Now that EGOV has reached new high territory on above average volume and has decisively passed through its pivot point, odds favor further gains. It is important not to buy any stock extended too far above its pivot point. Investors should always look out for a failed breakout, so if EGOV fails to follow through and rolls back it would give rise to concern. If dropping into its prior base to close under its March 20th, 2006 high close of $6.53, that would technically negate the recent breakout. Then the odds of a sustained rise and meaningful gains would be greatly reduced. Alway limit losses per the 7-8% sell rule, and never hold a stock if it falls more than that much from your purchase price. Another concern is that, even while more meaningful revenue growth has continued on a percentage basis versus the year ago quarters, sequentially speaking, the company's sales revenues have been locked in the $15-16 million range for the past 4 reports. Flatter comparisons in the coming quarters would likely prompt disappointment.
Technical Analysis: Today this stock blasted out of a flat base nearly 9-months long, rising on more than four times its average daily turnover. During the previous 9 months there were only 6 weeks of above average volume. It is very positive to see volume gradually dry up when a stock builds out a longer base. This is precisely what occurred, and as a result, it has a solid foundation that may help pave the way for further gains. Study a longer term or weekly graph to see why the next important technical hurdle is all the way up at the stock's January 2004 high of $8.85. However, previous overhead supply more than a year and three quarters old is normally not considered to be a hugely limiting factor as a stock tries to advance. If those important highs are eventually taken out, odds would favor further impressive gains.