Fundamental and Technical Deterioration Raising Concerns - Wednesday, October 23, 2013
Finished Lower After "Negative Reversal" - Monday, September 16, 2013
Fundamental and Technical Deterioration Raising Concerns - Wednesday, October 23, 2013
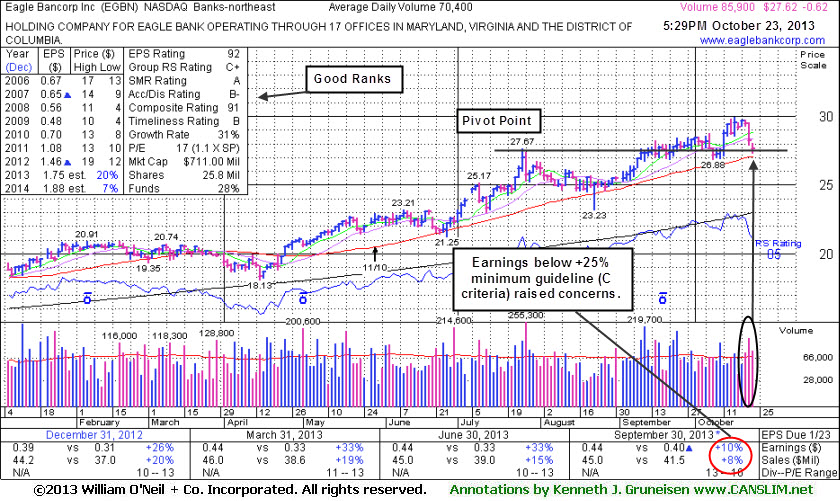
Eagle Bancorp Inc (EGBN -$0.62 or -2.20% to $27.62) reported earnings +10% on +8% sales revenues for the Sep '13 quarter versus the year ago period, raising fundamental concerns with results below the +25% minimum earnings guideline (C criteria). It pulled back three days in a row and had above average volume while retreating from its 52-week high. Recent lows and its 50-day moving average (DMA) line define near-term support. Due to weakening fundamentals and technicals, disciplined investors might be ready to make an exit and be on the watch for stronger buy candidates in the days ahead.
EGBN was last shown in this FSU section on 9/16/13 with an annotated graph under the headline, "Finished Lower After 'Negative Reversal'", after highlighted in yellow with a pivot point based on its 7/25/13 high plus 10 cents in the earlier mid-day report (read here). Subsequent volume-driven gains helped it rally beyond its pivot point and it was noted as extended from the prior base after eventually rallying beyond its "max buy" level. Not long ago it reported earnings +33% on +15% sales revenues for the Jun '13 quarter. Prior mid-day reports noted - "This Bank holding company with operations in the Northeast has shown strong sales revenues and earnings increases (C criteria) in recent quarterly comparisons. Annual earnings (A criteria) history included a downturn in FY '07-09 yet improved in recent years."
The number of top-rated funds owning its shares rose from 134 Sep '12 to 164 in Sep '13, a reassuring trend concerning the I criteria.
Finished Lower After "Negative Reversal" - Monday, September 16, 2013
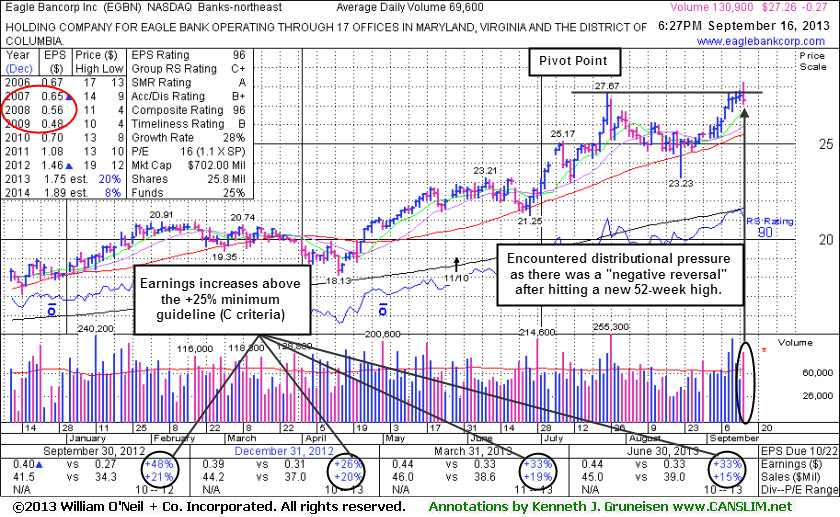
Eagle Bancorp Inc (EGBN -$0.27 or -0.98% to $27.26) was highlighted in yellow with a new pivot point based on its 7/25/13 high plus 10 cents in the earlier mid-day report (read here). It gapped up today and hit a new 52-week high, briefly trading above its pivot point, then reversing into the red. The technical term for that is a "negative reversal", and the action indicates that it encountered distributional (selling) pressure when poised to potentially produce a strong technical breakout. A subsequent volume-driven gain and close above the pivot point could trigger a proper technical buy signal. Disciplined investors will watch for proof of fresh institutional buying demand to confirm that demand is lurking which might lead to a meaningful advance in price.
Not long ago it reported earnings +33% on +15% sales revenues for the Jun '13 quarter. It found support at its 50-day moving average (DMA) line again since noted in the 7/26/13 mid-day report - "This Bank holding company with operations in the Northeast has shown strong sales revenues and earnings increases (C criteria) in recent quarterly comparisons. Annual earnings (A criteria) history included a downturn in FY '07-09 yet improved in recent years." The red circle indicates those years when earnings waned.
The number of top-rated funds owning its shares rose from 134 Sep '12 to 159 in Jun '13, a reassuring trend concerning the I criteria.