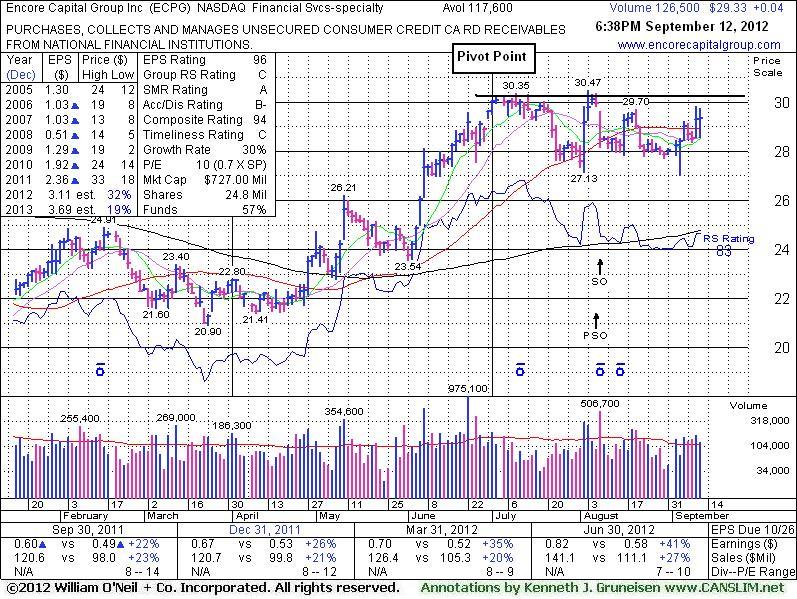
Subsequent Volume-Driven Gains May Trigger Buy Signal - Wednesday, September 12, 2012
Encore Capital Group Inc (ECPG +$0.04 or +0.14% to $29.33) rebounded above its 50-day moving average (DMA) line this week and finished -3.7% off its 52-week high today. Volume-driven gains to new highs would be a reassuring sign of accumulation hinting that it is capable of sustaining a meaningful rally. It was last shown in this FSU section on 8/06/12 with an annotated graph under the headline, "Perched Near 52-Week High With Some Remaining Overhead Supply" shortly after it was featured in yellow in the 8/03/12 mid-day report (read here) with pivot point based on its 7/10/12 high. It appeared poised to rally from a short "square box" base. However, it abruptly pulled back and completed a Secondary Offering on 8/08/12. Prior analysis also noted - "Keep in mind that it has a little bit of overhead supply up through its 2011 high near $33 that may act as near-term resistance."
It reported earnings +41% on +27% sales revenues for the quarter ended June 30, 2012. That marked 3 consecutive quarterly comparisons with earnings increases above the +25% minimum guideline. This Financial Services - Misc firm's annual earnings (A criteria) history has been improving since a down turn in FY '08. The Group Relative Strength Rating of C is mediocre, however leadership (L criteria) from at least one other high-ranked firm in the group is welcome reassurance. The number of top-rated funds owning its shares rose from 246 in Sep '11 to 266 in Jun '12, a somewhat reassuring sign concerning the I criteria.
A subsequent volume-driven gain and close above its pivot point may trigger a technical buy signal which could possibly signal the beginning of a much more substantial advance in price. Disciplined investors know that there is no advantage to getting in "early" and that odds are only considered favorable after a stock flashes a fresh sign of heavy institutional buying demand.
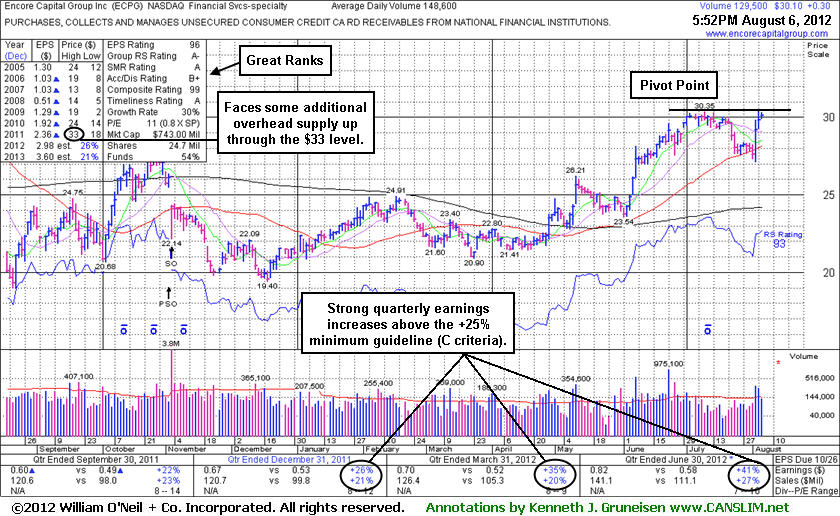
Perched Near 52-Week High With Some Remaining Overhead Supply - Monday, August 06, 2012
Often, when a leading stock is setting up to breakout of a solid base it is highlighted in CANSLIM.net's Mid-Day Breakouts Report. The most relevant factors are noted in the report which alerts prudent CANSLIM oriented investors to place the issue in their watch list. After doing any necessary backup research, the investor is prepared to act after the stock triggers a technical buy signal (breaks above its pivot point on more than +50% average turnover) but before it gets too extended from a sound base. In the event the stock fails to trigger a technical buy signal and its price declines then it will simply be removed from the watch list. Disciplined investors know to buy as near as possible to the pivot point and avoid chasing stocks after they have rallied more than +5% above their pivot point. It is crucial to always limit losses whenever any stock heads the wrong direction, and disciplined investors sell if a struggling stock ever falls more than -7% from their purchase price.
Encore Capital Group Inc (ECPG +$0.30 or +1.01% to $30.10) was featured in yellow in the 8/03/12 mid-day report (read here) with pivot point based on its 7/10/12 high while it appeared poised to rally from a short "square box" base. A subsequent volume-driven gain and close above its pivot point may trigger a technical buy signal. It found support near its 50-day moving average (DMA) line last week and gains backed by above average volume helped it touch a new 52-week high. It reported earnings +41% on +27% sales revenues for the quarter ended June 30, 2012. That marked 3 consecutive quarterly comparisons with earnings increases above the +25% minimum guideline. This Financial Services - Misc firm's annual earnings (A criteria) history has been improving since a down turn in FY '08. The number of top-rated funds owning its shares rose from 246 in Sep '11 to 258 in Jun '12, a somewhat reassuring sign concerning the I criteria. Its current Up/Down Volume Ratio of 1.8 is an unbiased indication that its shares have been under accumulation over the past 50 days. Keep in mind that it has a little bit of overhead supply up through its 2011 high near $33 that may act as near-term resistance. Subsequent gains into new all-time high could possibly signal the beginning of a much more substantial advance in price.