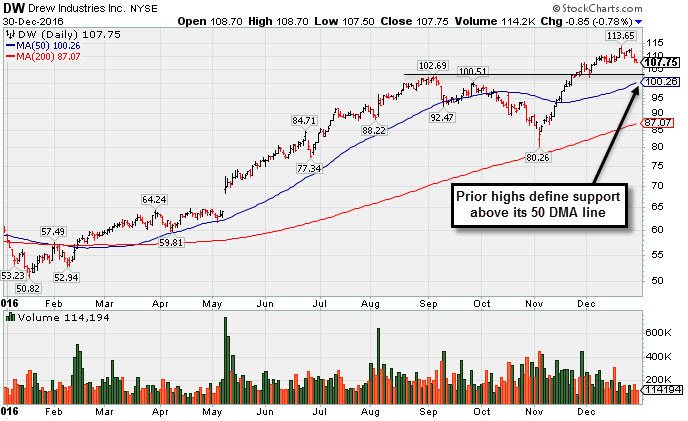
Consolidating Well Above Prior Highs and 50-Day Moving Average - Friday, December 30, 2016
Drew Industries Inc (DW -$0.85 or -0.78% to $107.75) has pulled back from all-time highs, yet it remains extended from any sound base. Prior highs in the $101-103 area define support to watch above its 50-day moving average (DMA) line. It was last shown in this FSU section on 11/30/16 with an annotated graph under the headline, "Pullback Following Volume-Driven Gain For New Highs". On the prior session it had finished strong after highlighted in yellow with pivot point cited based on its 9/28/16 high in the mid-day report (read here).
The high ranked Building - Mobile/Manufacturing & RV firm rebounded after finding support well above its 200-day moving average (DMA) line in recent weeks. The number of top-rated funds owning its shares rose from 311 in Dec '15 to 414 in Sep '16, a reassuring sign concerning the I criteria. Its current Up/Down Volume Ratio of 1.7 is an unbiased indication its shares have been under accumulation over the past 50 days. It has a Timeliness Rating of A, but a Sponsorship Rating of C at present.
Recently it reported Sep '16 quarterly earnings +70% on +19% sales revenues, marking its 4th consecutive quarterly comparison above the +25% minimum earnings guideline (C criteria). Its strong annual earnings (A criteria) history matches the fact-based investment system's fundamental guidelines.
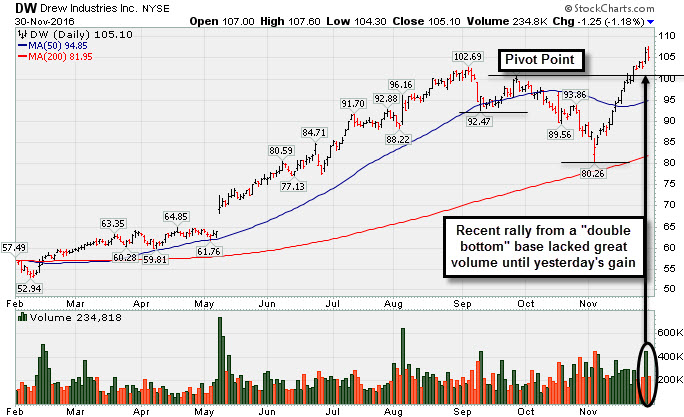
Pullback Following Volume-Driven Gain For New Highs - Wednesday, November 30, 2016
Drew Industries Inc (DW -$1.25 or -1.18% to $105.10) pulled back today with near average volume. On the prior session it had finished strong after highlighted in yellow with pivot point cited based on its 9/28/16 high in the mid-day report (read here). Its big gain for new all-time high was backed by +87% above average volume, clinching a technical buy signal. Recent gains clearing a "double bottom" base had lacked volume above the +40% above average minimum guideline.
The high ranked Building - Mobile/Manufacturing & RV firm rebounded after finding support well above its 200-day moving average (DMA) line in recent weeks. The number of top-rated funds owning its shares rose from 311 in Dec '15 to 408 in Sep '16, a reassuring sign concerning the I criteria. Its current Up/Down Volume Ratio of 1.7 is an unbiased indication its shares have been under accumulation over the past 50 days. It has a Timeliness Rating of A, but a Sponsorship Rating of D at present.
Recently it reported Sep '16 quarterly earnings +70% on +19% sales revenues, marking its 4th consecutive quarterly comparison above the +25% minimum earnings guideline (C criteria). Its strong annual earnings (A criteria) history matches the fact-based investment system's fundamental guidelines.
Recently it reported Sep '16 quarterly earnings +70% on +19% sales revenues, marking its 4th consecutive quarterly comparison above the +25% minimum earnings guideline (C criteria). Its strong annual earnings (A criteria) history matches the fact-based investment system's fundamental guidelines.