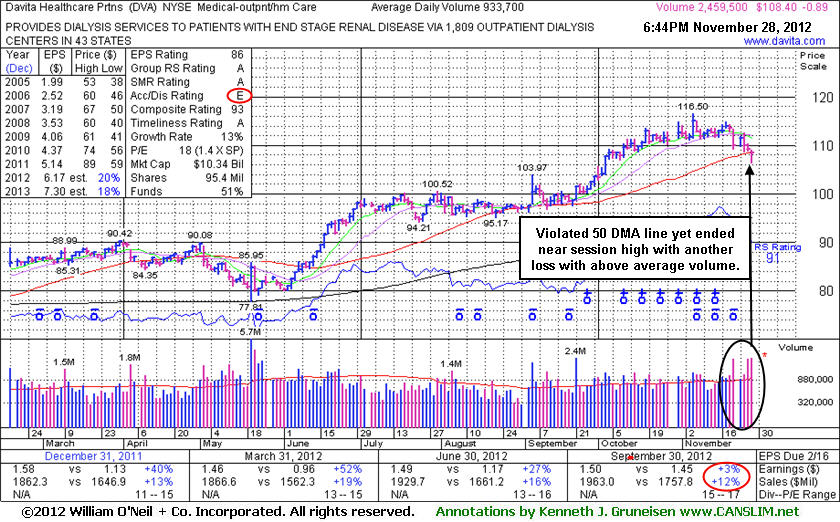
Davita Inc (DVA -$0.89 or -0.81% to $108.40) finished -7% off its 52-week high today. Technical concerns were raised while slumping below its 50-day moving average (DMA) line with above average volume behind today's 3rd consecutive loss. It will be dropped from the Featured Stocks list tonight. Fundamental concerns were recently noted after it reported earnings +3% on +12% sales for the Sep '12 quarter, below the guidelines of the fact-based system.
It has shown steady annual earnings (A criteria) growth. Ownership by top-rated funds rose from 959 in Jun '12 to 975 in Sep '12, a slightly reassuring sign concerning the I criteria. However, the Medical - Outpatient/Home Care firm has seen its Accumulation/Distribution Rating slump to a E from a B- since 11/08/12 when it made its last appearance in this FSU section under the headline, "Weak Earnings Increase Raises Concern After 7 Weekly Gains", as it was then noted - "Disciplined investors might be inclined to give it the benefit of the doubt until technical sell signals argue more seriously for exiting, however, keep in mind that the M criteria argues in favor of protecting profits and reducing market exposure when the major averages are in a serious correction."
The broader market action (M criteria) has improved while returning to a confirmed uptrend as noted in the Market Commentary this week. This individual issue may find prompt support near its short-term average and eventually rally higher. However, disciplined investors know that they typically have more favorable odds by buying fresh breakouts rather than bargain hunting and going after slumping stocks showing weaker earnings. Since first featured at $102.92 in the 9/05/12 mid-day report the stock had shown mostly bullish action and traded as much as +13.2% higher before the current slump.
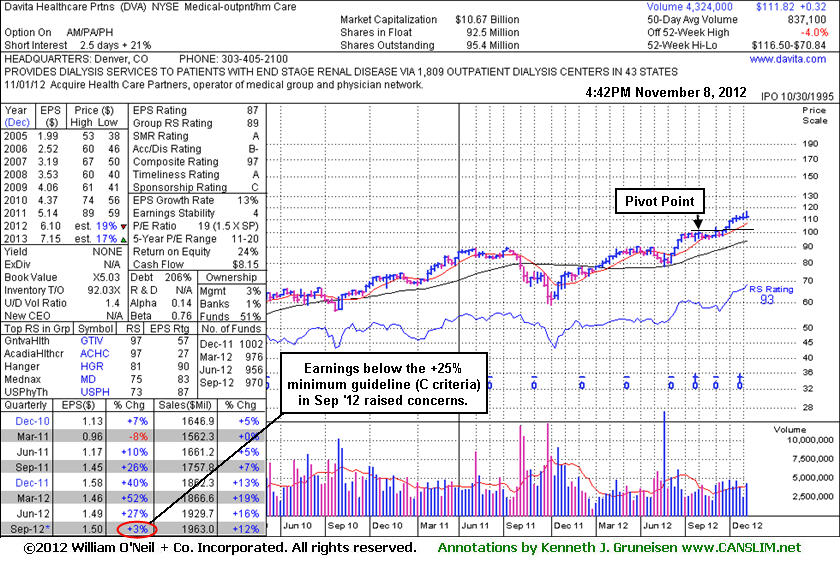
It may be on the cusp of closing out an 8th consecutive weekly gain. The stock was recently noted as - "Extended from its latest sound base." Prior highs and its 50-day moving average (DMA) line define near-term support to watch on pullbacks where violations may trigger technical sell signals. It was last shown in this FSU section on 10/10/12 with an annotated graph under the headline, "Extended From Base Following More Volume-Driven Gains ", yet it went on to rally higher into new high territory getting even more extended from its latest sound base. Disciplined investors avoid chasing extended stocks.
The Medical - Outpatient/Home Care firm has earned great ranks, and the industry group has a Group Relative Strength Rating of 89, a reassuring sign concerning the L criteria. It has shown steady annual earnings (A criteria) growth. Ownership by top-rated funds rose from 955 in Jun '12 to 970 in Sep '12, a slightly reassuring sign concerning the I criteria.
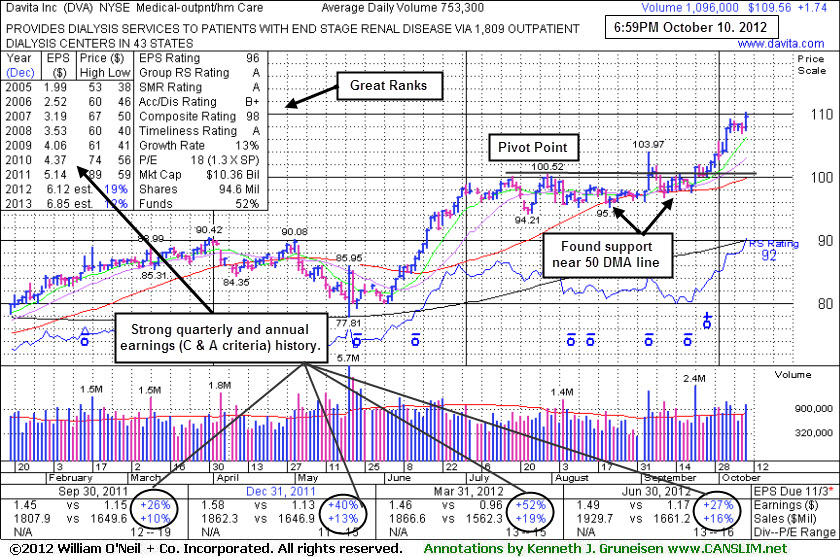
Davita Inc (DVA +$1.743 or +1.61% to $109.56) hit another new 52-week high today, getting even more extended from its latest sound base. Prior highs near $100 and its 50-day moving average (DMA) line define near term support to watch on pullbacks where violations may trigger technical sell signals. It was last shown in this FSU section on 9/05/12 with an annotated graph under the headline, "Distributional Pressure Led to Finish Just Below Pivot Point", when it encountered distributional pressure and ultimately failed to finish that session above its pivot point after hitting a new high with a considerable volume-driven gain. It encountered distributional pressure in the weeks that followed, yet it found support at its 50 DMA line, an important support level for chart readers. Subsequent volume-driven gains clinched a technical buy signal, and it soon rallied more than +5% above its pivot point, getting "extended" from its prior base. Disciplined investors avoid chasing extended stocks.
The Medical - Outpatient/Home Care firm has earned great ranks. Quarterly earnings increases have been above the +25% guideline (C criteria) and it has shown steady annual earnings (A criteria) growth. Ownership by top-rated funds rose from 955 in Jun '12 to 965 in Sep '12, a slightly reassuring sign concerning the I criteria.
Often, when a leading stock is setting up to breakout of a solid base it is highlighted in CANSLIM.net's Mid-Day Breakouts Report. The most relevant factors are noted in the report which alerts prudent CANSLIM oriented investors to place the issue in their watch list. After doing any necessary backup research, the investor is prepared to act after the stock triggers a technical buy signal (breaks above its pivot point on more than +50% average turnover) but before it gets too extended from a sound base. In the event the stock fails to trigger a technical buy signal and its price declines then it will simply be removed from the watch list. Disciplined investors know to buy as near as possible to the pivot point and avoid chasing stocks after they have rallied more than +5% above their pivot point. It is crucial to always limit losses whenever any stock heads the wrong direction, and disciplined investors sell if a struggling stock ever falls more than -7% from their purchase price.
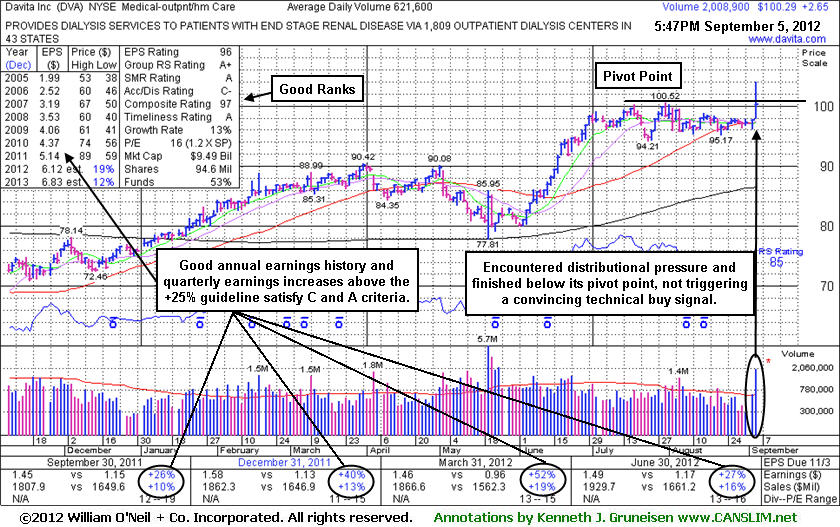
Davita Inc (DVA +$2.65 or +2.71% to $100.29) was highlighted in yellow with pivot point cited based on its 52-week high plus 10 cents in the earlier mid-day report (read here). However, it encountered distributional pressure and ultimately failed to finish the session above its pivot point after hitting a new high with a considerable volume-driven gain. It has formed an orderly flat base and has no overhead supply to act as resistance. Subsequent volume-driven gains may help to clinch a convincing technical buy signal. Keep in mind that one way investors can reduce risk and allow the market action dictate their actions is to use a smart tactic taught in the Certification called "pyramiding".
Quarterly earnings increases have been above the +25% guideline (C criteria) and it has shown steady annual earnings (A criteria) growth. Ownership by top-rated funds fell from 1,005 in Dec '11 to 950 in Jun '12, a slightly disconcerting sign concerning the I criteria.