200 DMA Breach Soon Follows Disappointing Earnings Report - Friday, August 03, 2007
A very important technical tool that savvy investors have learned to incorporate in their technical analysis is the 200-day moving average (DMA) line. The 200 DMA line plays a pivotal role relative to a stock's price. If the price of a stock is above its 200 DMA then odds are that its 200 DMA will act as longer term support. Conversely, if the price is below its 200 DMA then the moving average acts as resistance. Obviously, if a technical breakdown or violation takes place on heavy volume it is a more serious concern. Sometimes quiet violations are repaired quickly, without a lot of additional losses. However, the key moving averages are always an important line to watch.
Dril-Quip Inc. (DRQ -$4.05 or -9.19% to $40.01) plunged below its longer term 200 DMA line for a considerable loss on very heavy volume, further deteriorating after the prior session's gap down below its 50 DMA and violation of earlier chart lows. This technical damage came immediately after the company said earnings for its latest quarter increased +11% while sales gained +6%, which was significantly lower than recent, stronger, quarters. Whenever a stock plunges on a tepid earnings report it is a clear technical sell signal based on fundamental weakness. Paying attention to a stock's reaction to earnings is as important, or sometimes more important, than the actual results.
DRQ was first featured in the April '07 issue of CANSLIM.net News (read here) with a $44.78 pivot point and a $47.02 maximum buy price. One week later, on Monday April 9, 2007, DRQ triggered a technical buy signal when it blasted above its $44.78 pivot point on the necessary volume (at least +50% above average) to trigger a technical buy signal. In the first few weeks, the stock surged an impressive +18%. However, it negatively reversed from a 52-week high on April 30th, 2007, and the very next day it gapped down on massive volume after reporting quarterly financial results. In a two day period, DRQ gave back its entire 18% gain. It spent the next few weeks building a base-on-base pattern. By definition, the lows of a base-on-base pattern correspond with the highs of the stock's prior base. Most disciplined investors would have sold it earlier and avoided the recent disappointment. On June 26, 2007, when DRQ sliced through support, the action was summarized in the CANSLIM.net After Market Report as follows - "The technical deterioration of the stock would be hard to ignore, as the entire base-on-base pattern might be negated. If the bulls do not promptly show up and quell the bearish selling above this key chart support level, further declines become even more likely. As always, strictly selling whenever a stock falls 7-8% from your purchase price is the best way to prevent greater losses." As of tonight this stock will be dropped from the CANSLIM.net Featured Stocks list.
C A N S L I M | StockTalk | News | Chart | SEC | Zacks Reports

View all notes | Alert me of new notes | CANSLIM.net Company Profile
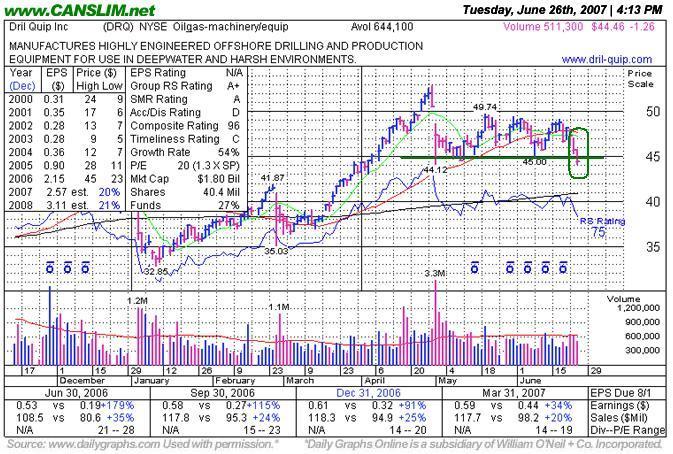
Prior Chart Highs Offer Remaining Chart Support - Tuesday, June 26, 2007
Another important factor is the relationship between an uptrend and a stock's pivot point. Typically, stocks begin forming an uptrend after rising above their pivot point. In the event the upward trend is violated, the stock will generally be expected to continue falling until it can retest support. Initial support is often the 50 DMA, or its pivot point, whichever is higher.
Dril-Quip Inc. (DRQ -$1.19 or -2.60% to $44.53) closed lower on below average volume, however in doing so it closed below its most recent pivot point of $44.78. This stock was first featured in the April '07 issue of CANSLIM.net News (read here) with a $44.78 pivot point and a $47.02 maximum buy price. One week later, on Monday April 9, 2007, DRQ triggered a technical buy signal when it blasted above its $44.78 pivot point on the necessary volume (at least +50% above average) to trigger a technical buy signal. The first few weeks of action was admirable, but the past few weeks have been less than stellar.
In the first few weeks after DRQ was featured in CANSLIM.net News, the stock surged an impressive +18%. However, it negatively reversed from a 52-week high on April 30th, 2007, and the very next day it gapped down on massive volume after reporting its latest quarterly financial results. In that two day period, DRQ gave back its entire 18% gain. It spent the next few weeks building a base-on-base pattern. By definition, the lows of a base-on-base pattern correspond with the highs of the stock's prior base. Therefore, DRQ is at a critical juncture now, and it is of the utmost importance to not see the stock's December 8, 2006 high close of $44.15 breached with a lower close. Otherwise, the technical deterioration of the stock would be hard to ignore, as the entire base-on-base pattern might be negated. If the bulls do not promptly show up and quell the bearish selling above this key chart support level, further declines become even more likely. As always, strictly selling whenever a stock falls 7-8% from your purchase price is the best way to prevent greater losses.
C A N S L I M | StockTalk | News | Chart | ![]() DGO | SEC | Zacks Reports
DGO | SEC | Zacks Reports
View all notes | Alert me of new notes | CANSLIM.net Company Profile
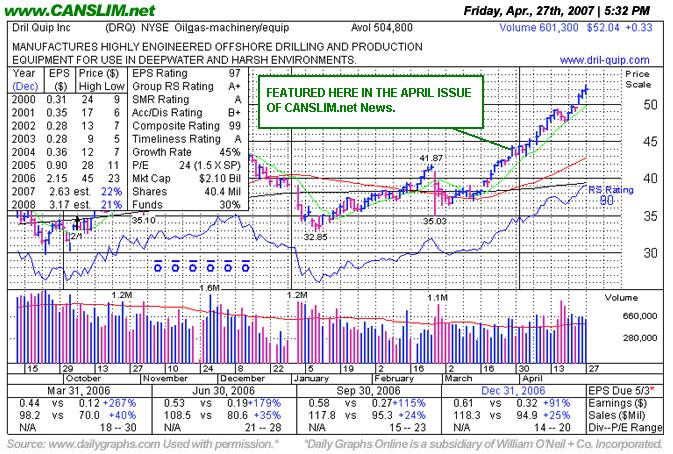
Drilling Down the Details on Another Strong CANSLIM.net Leader - Friday, April 27, 2007
A classic example of the success enjoyed by many CANSLIM.net readers usually starts when an investor reads a CANSLIM.net report and buys a featured stock before it has risen above the pivot point by greater than 5%. After a stock breaks out above its pivot point, there is only a +5% window that investors have to purchase the stock under the proper guidelines. Once a stock rises above the "maximum buy price" the risk of a shake out balloons, meaning that even a normal retracement in the stock might force you to employ the 7-8% loss cutting rule. Much can be told by the stock's daily action in the weeks and months that follow a breakout. Typically, a light volume and orderly pullback suggests that the bulls remain in control. However, high volume pullbacks that violate support paint a totally different picture.
Dril-Quip Inc. (DRQ +$0.33 or +0.63% to $52.04) has continued marching higher after breaking out of a sound base earlier this month. This stock was first featured in the April '07 issue of CANSLIM.net News (read here) with a $44.78 pivot point and a $47.02 maximum buy price. One week later, on Monday April 9, 2007, DRQ triggered a technical buy signal when it blasted above its $44.78 pivot point on the necessary volume (at least +50% above average) to trigger a technical buy signal. That action was discussed in greater detail in the Monday April 9, 2007 CANSLIM.net After Market Update under a headline that read "Oil Equipment Stock Drills Its Way Through Resistance" (read here). The stock's post-breakout action has been admirable.
In four short weeks, DRQ has traded up +17% above its pivot point, and the odds favor even further gains, however it is too extended to be considered a proper buy candidate now. While it steadily hit new 52-week highs, in the process it also traced out a well-defined steep upward trendline. Whenever that trendline is breached it could be considered an early sell signal, and the next important chart support level would be all the way down near its December 2006 chart high ($44.68). The "C" criteria remains strong, as the company managed to increase its earnings per share over the year earlier by +75% and +85% in the two latest quarters ended September and December of '06. The company is slated to report their first quarter results in early May, which typically can lead to extra volatility. As always, strictly selling whenever a stock falls 7-8% from your purchase price is the best way to prevent greater losses.
C A N S L I M | StockTalk | News | Chart | ![]() DGO | SEC | Zacks Reports
DGO | SEC | Zacks Reports
View all notes | Alert me of new notes | CANSLIM.net Company Profile
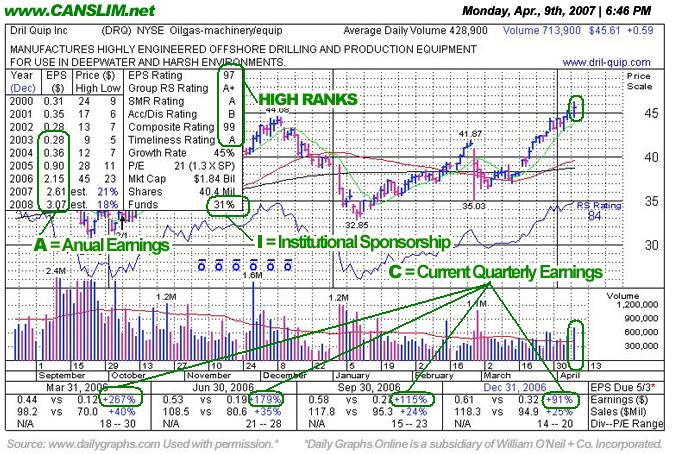
Oil Equipment Stock Drills Its Way Through Resistance - Monday, April 09, 2007
Once again, the "L" criteria in CAN SLIM(R) tells investors to choose leading companies in leading industry groups, and when we have identified a high-ranked leader with the proper characteristics we should wait and watch for gains on at least +50% above average volume as a confirmation that a breakout is attracting meaningful institutional sponsorship. A classic example of the success enjoyed by many CANSLIM.net readers usually starts when an investor reads a CANSLIM.net report and buys a featured stock before it has risen above the pivot point by greater than 5%. After a stock triggers a technical buy signal and is purchased, it is always important to employ the 7-8% loss cutting rule in the event of a downturn.
Dril-Quip Inc. (DRQ +$0.59 or +1.31% to $45.61) blasted further above its $44.78 pivot point today and the volume total behind the session's gains met the guideline to trigger a proper technical buy signal. This stock was first featured in the April 2007 issue of CANSLIM.net News (read here) with a $44.78 pivot point and a $47.02 maximum buy price. Dril Quip Inc. sports a very healthy Earnings Per Share (EPS) rating of 97. It is also encouraging to see the company earn a very healthy Relative Strength (RS) rating of 84. The company has managed to increase its earnings by well above the +25% guideline in each of the past four quarterly comparisons versus the year earlier, satisfying the "C" criteria. DRQ resides in the Oilgas- machinery/equip group which is currently ranked 6th of out the 197 Industry Groups covered in the paper, placing it in the much preferred top quartile and satisfying the "L" criteria.
On Thursday, DRQ jumped above its pivot point, but that day's volume total failed to meet the necessary volume increase (a minimum of +50% above average) to trigger a proper technical buy signal. After a long holiday weekend, it continued higher on Monday, when volume swelled above the +50% above average level to trigger a proper technical buy signal. It was very encouraging to see DRQ post another gain on higher volume. It is important to note that this stock is approaching its "maximum buy" price of $47.02, where it would then be too extended to consider for purchase under the proper guidelines. As always, it is of the utmost importance to have a sell discipline to protect your interest, and the guidelines in the book "How to Make Money in Stocks" suggest selling a stock if it ever drops 7-8% below your purchase price.
C A N S L I M | StockTalk | News | Chart | ![]() DGO | SEC | Zacks Reports
DGO | SEC | Zacks Reports
View all notes | Alert me of new notes | CANSLIM.net Company Profile
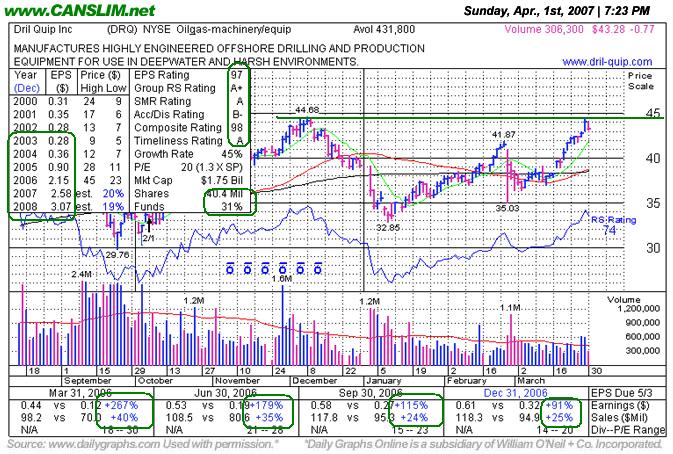
STWNM (DRQ) Potential Breakout From Very Long Base - Sunday, April 01, 2007
|
Dril-Quip, Inc. (DRQ) |
||
|
Ticker Symbol: DRQ (NYSE) |
Industry Group: Oilgas-machinery/equip |
Shares Outstanding: 40,400,000 |
|
Price: $43.28 |
Day's Volume: 306,300 3/30/07 close |
Shares in Float: 23,000,000 |
|
52 Week High: $45.02 5/10/2006 |
50-Day Average Volume: 431,800 |
Up/Down Volume Ratio: 1.8 |
|
Pivot Point: $44.78 12/08/2006 high plus .10 |
Pivot Point +5% = Max Buy Price: $47.02 |
Web Address: http://www.dril-quip.com |
C A N S L I M | StockTalk | News | Chart | SEC | Zacks Reports
CANSLIM.net Profile: Dril-Quip, Inc. designs, manufactures, and services engineered offshore drilling and production equipment for use in deepwater, harsh environment, and severe service applications. The company has operations in North and South America, Europe,
What to Look For and What to Look Out For: Look for DRQ to breakout of a 13-month long base with gains backed by at least +50% above average volume. The ideal time to purchase a stock is when it blasts above its pivot point on above average volume, which successfully triggers a technical buy signal only when accompanied by sufficient volume. Ideally, one would like to see the stock follow through in the days that immediately following its journey into new high territory. If, after the buy signal is triggered, a stock reverses and falls back below its pivot point by more than 7% it would more than negate the breakout, then odds favor it moving even lower. The reason why it is imperative to wait for a fresh technical buy signal to be triggered is because prior resistance levels are often stubborn barriers which the market recognizes. Always limit losses per the 7-8% sell rule, and never hold a stock if it falls more than that much from your purchase price.
Technical Analysis: DRQ enjoyed very healthy gains in 2005. After an impressive sprint ($11-45 -split adjusted) it ran into resistance near the $45 level on multiple occasions during the process of building out a 13-month long base. DRQ is currently trading -3.9% shy of its 52-week high ($45.02). Once this issue manages to blast above its pivot point on above average volume then a new technical buy signal will be triggered. History shows us that stocks that have cleared prior resistance have the greatest chance of advancing meaningfully.