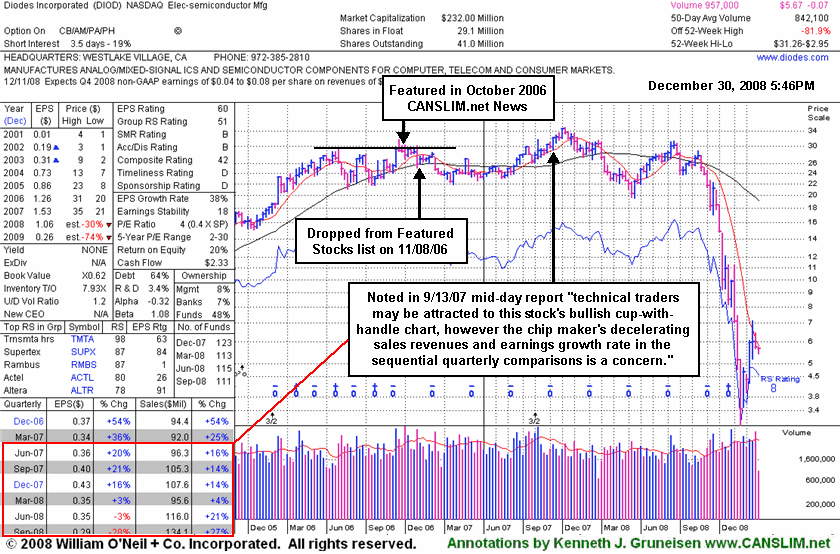
Electronics Firm Fizzled First Technically, Later Fundamentally - Tuesday, December 30, 2008
In recent weeks we have taken the opportunity to use this section to revisit some of the previously featured stocks that were dropped some time ago based on technical weakness, and later developed fundamental concerns. Studying what happened afterwards should hopefully allow investors to get a better understanding of the importance of having a sell discipline. Limiting losses while they are small is critically important to your success, and this investment system's rule is to always sell a losing stock after it falls more than 7-8% from your buy price. These well-known, high-profile companies serve now as perfect examples that will hopefully allow investors in the future to recognize the warning signs and technical sell signals so they will know when it is time to lock in profits or minimize losses per the investment system's sell rules.
Diodes Inc (DIOD +$0.09 or +1.61% to $5.67) now faces a tremendous amount of resistance due to overhead supply, making it unlikely to be a market leader in the near term. DIOD was first featured in the October 2006 issue of CANSLIM.net News (read here). But following heavy distribution leading to 50-day moving average (DMA) line and 200 DMA line violations which were noted, it was dropped from the Featured Stocks list on 11/08/06, and it has since traded as much as -90.20% lower. Investors who ignored technical sell signals long, long ago now have more serious concerns, because its fundamentals are not as solid as they need to be. Not long after it was dropped from the Featured Stocks list its quarterly comparisons against the year ago period started to deteriorate. Sales and earnings increases are most ideal when meeting or exceeding the investment system's +25% minimum guideline. DIOD reappeared on the mid-day screen results again later, prompting the last note which was added on 9/13/07 as it -"rallied up to challenge its September 2006 all-time highs, so technical traders may be attracted to this stock's bullish cup-with-handle chart, however the chip maker's decelerating sales revenues and earnings growth rate in the sequential quarterly comparisons is a concern" (read here).
C A N S L I M | StockTalk | News | Chart | SEC | Zacks Reports | ![]()
![]()
![]()
View all notes | Alert me of new notes | CANSLIM.net Company Profile
