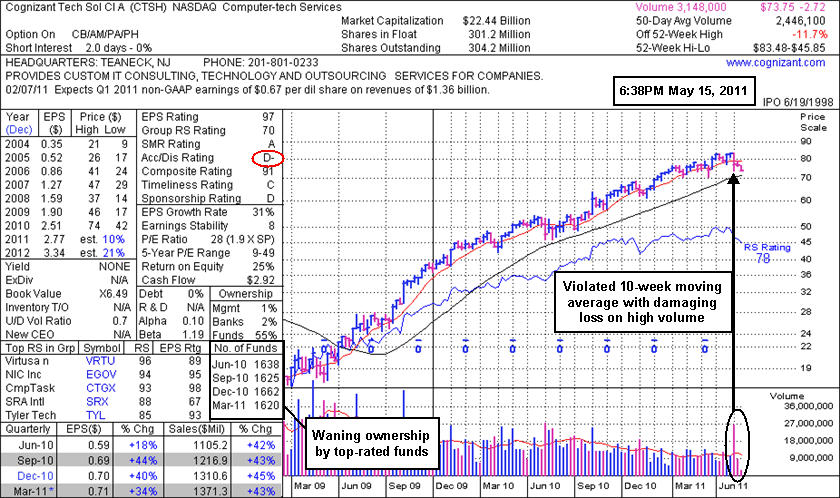
Waning Ownership From Top Funds And Noted Distribution - Monday, May 16, 2011
Cognizant Technology Solutions Corp. (CTSH -$2.72 or -3.56% to $73.75) suffered another considerable loss today with above average volume, slumping toward prior lows in the $70.50 range and its 200-day moving average (DMA) line. Its Accumulation/Distribution rating is now a D- (see red circle) while it is still perched just -11.7% off its 52-week high. However, overhead supply up through the $83 level is likely to hinder its upward progress for the near term.
CTSH initially found support near its 50 DMA line after its last appearance in this FSU section with an annotated graph on 4/15/11 under the headline, "Collateral Damage Hurts IT Firm's Shares", when its prominent competitor, India-based Infosys Technologies (INFY), gave disappointing guidance which put pressure on other IT companies' shares. After testing support at prior highs in the $77 area and its 50-day moving average (DMA) line it found prompt support and soon surged to a new all-time high again. However, the damaging gap down loss on 5/03/11 after its latest earnings report triggered a technical sell signal. The above linked article had noted - "Additional losses would make it increasingly harder to give it the benefit of the doubt, especially when compared to a fresh new breakout with healthy characteristics."
Lackluster earnings estimates (see red circle) for FY '11 were noted recently as cause for concern. It was also recognized as a familiar name to the institutional crowd. In fact, the number of top-rated funds owning its shares waned from 1,662 in Dec '10 to 1,620 in Mar '11.
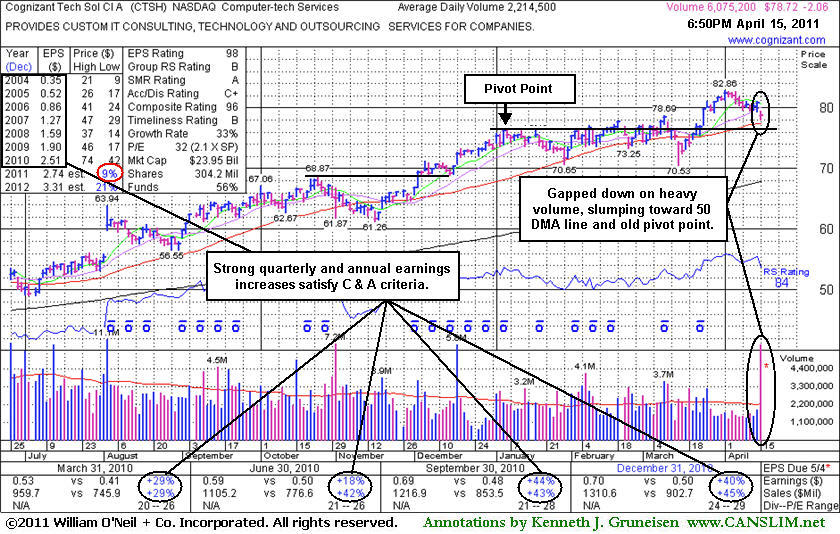
Collateral Damage Hurts IT Firm's Shares - Friday, April 15, 2011
Cognizant Technology Solutions Corp. (CTSH -$2.06 or -2.55% to $78.72) suffered collateral damage today. It gapped down for a damaging loss on high volume, testing support at prior highs in the $77-78 area previously noted as chart support to watch above its 50-day moving average (DMA) line. A prominent competitor, India-based Infosys Technologies (INFY -13.42%), sank after giving disappointing guidance, putting pressure on other IT companies' shares.
Since its gain with +40% above average volume on 2/08/11 cleared a short flat base, the high-ranked leader hailing from the strong Computer-tech Services group has given investors mixed signals. It sputtered along above its 50 DMA, then a gap down and shakeout on 3/15/11 below its 50 DMA line briefly undercut its January low, yet it found prompt support and soon repaired that 50 DMA violation. Then it surged to a new all-time high again with heavy volume behind its gains in late March.
Along with the concerns raised by the latest damaging loss, the low Street earnings estimates (see red circle) for FY '11 may be cause for concern. It is already a familiar name to the institutional crowd too. In fact, the number of top-rated funds owning its shares waned from 1,658 in Dec '10 to 1,612 in Mar '11. Additional losses would make it increasingly harder to give it the benefit of the doubt, especially when compared to a fresh new breakout with healthy characteristics.
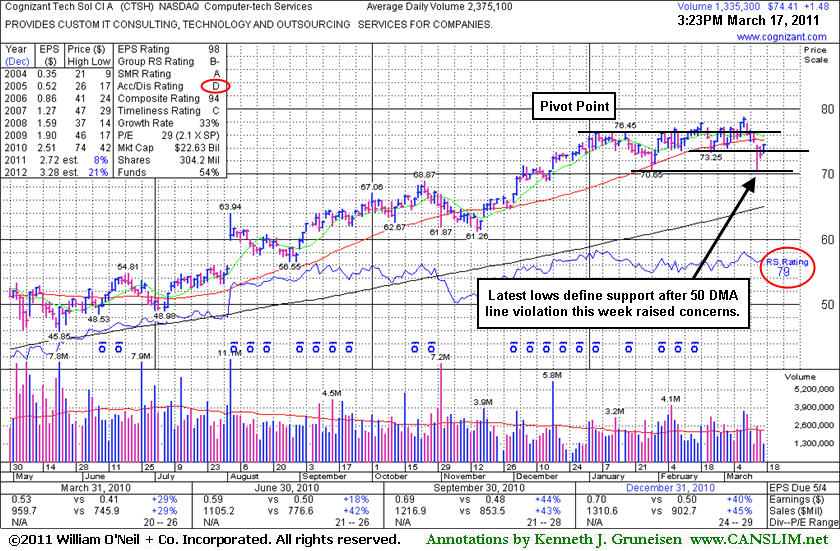
Pyramiding Technique May Have Minimized Exposure To Loss - Thursday, March 17, 2011
The headline to the article linked to below will take you to the last article from this FSU section on a high-ranked leader in which we outlined a strategy is known as "pyramiding". The pyramiding approach is extremely useful when used properly, as it lets the market action help to dictate how heavily you invest. Disciplined investors who may have made an initial purchase of a half-position would not have added any additional shares before the latest pullback likely prompted them to sell per the -7% sell rule. Thus, the loss would have been minimized versus a scenario where one had immediately jumped into a full position. Keep in mind that at a future point, if the market (M criteria) and the stock show renewed strength and bullish characteristics, another opportunity to accumulate shares within the system's guidelines may eventually present itself. Meanwhile, losses must always be limited in order to avoid the possibility of more substantial erosion of your precious investment capital.
Cognizant Technology Solutions Corp. (CTSH +$1.20 or +1.65% to $74.13) halted its slide today after 3 consecutive losses violated its 50-day moving average (DMA) line and its previously noted chart low ($73.25 on 2/23/11). Its color code was changed to green after the damaging technical violations. Any subsequent violation of its latest low of $70.53, which closely coincides with its earlier 1/28/11 low, would raise more serious concerns and trigger more worrisome technical sell signals. Meanwhile, a prompt rebound above its short-term average would help its outlook greatly.
Its Relative Strength rank fell below the 80+ guideline and Accumulation/Distribution rating has slumped from a B- to a D (see red circles) and CTSH obviously didn't ever manage to rally beyond its "max buy" level following its last appearance in the Featured Stock Update (FSU) section on 2/08/11 with an annotated graph under the headline, "Minimal Volume Increase With Gain Just Above Pivot Point". At that time it had posted a gain with +40% above average volume while rallying from a short flat base above its 50-day moving average (DMA) line. That helped the high-ranked leader hailing from the strong Computer-tech Services group rise with the bare minimum volume required for a new buy signal as it closed the session above the pivot point cited in the 2/07/11 mid-day report (read here). As the 2/08/11 analysis stated - "In recent months we have seen articles in the paper refer to a +40% above average volume threshold, after primarily standing by a +50% above average volume threshold as the minimum for a proper technical buy signal for as long as this analyst can remember. Additionally, it has been emphasized that the investment system's biggest winners identified in past models commonly showed an undeniable surge in buying demand with volume spiking many-fold over their typical daily volume totals while they posted meaningful gains."
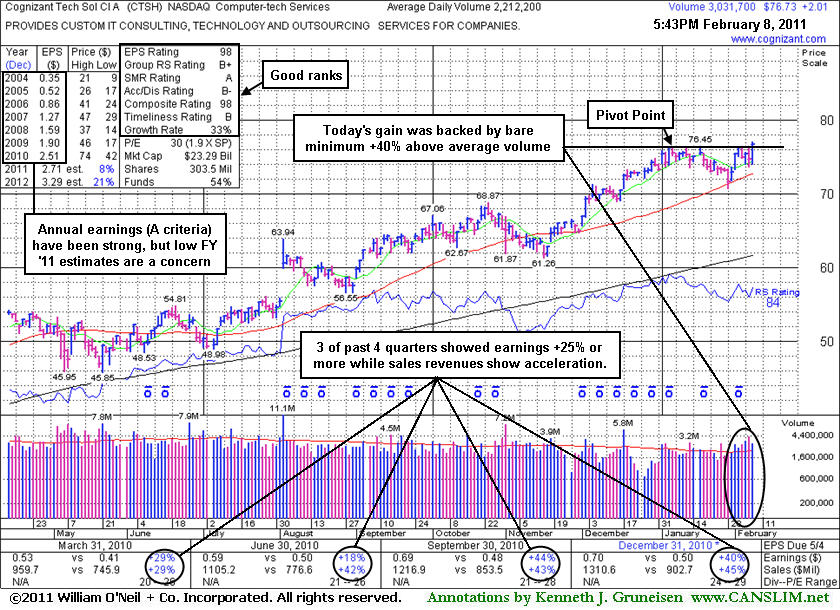
Minimal Volume Increase With Gain Just Above Pivot Point - Tuesday, February 08, 2011
Adding on to winning positions with buy decisions confirmed by market action is advised, especially for those who are set upon employing the smartest tactical approach for accumulating stocks. This was a topic discussed long ago when Cognizant Technology Solutions Corp. (CTSH) made its last appearance in this FSU section on 3/23/07 under the headline "Watching For Another Time to Buy, or Another Sell Signal". It faltered and triggered sell signals in that case and went through a deep consolidation before rebounding impressively, yet the article may be worth revisiting for the purpose of firming up one's education on the fact-based investment system's approach to "force feeding" winners whenever add-on buy signals may occur. At all times, disciplined investors limit losses at 7-8% below their purchase price on all shares bought to properly manage risk. The above mentioned article was published well after its appearance in the Wednesday, September 13, 2006 Mid Day Breakouts Report (read here) when it cleared a pivot point with great volume conviction. The 2:1 stock split that occurred in Oct '07 may confuse those looking back into its history.
Cognizant Technology Solutions Corp. (CTSH +$2.01 or +2.69% to $76.73) posted a gain today with +40% above average volume while rallying from a short flat base above its 50-day moving average (DMA) line. That helped the high-ranked leader hailing from the strong Computer-tech Services group close the session above the pivot point cited when it was color coded yellow in the 2/07/11 mid-day report (read
here) with the bare minimum volume required for a new buy signal. In recent months we have seen articles in the paper refer to a +40% above average volume threshold, after primarily standing by a +50% above average volume threshold as the minimum for a proper technical buy signal for as long as this analyst can remember. Additionally, it has been emphasized that the investment system's biggest winners identified in past models commonly showed an undeniable surge in buying demand with volume spiking many-fold over their typical daily volume totals while they posted meaningful gains. Gains with above average volume might offer a welcome reassurance or "confirmation day" of gains before it gets extended beyond its "max buy" level.Remember to proceed with caution, meaning only buying a small position in the strongest names that are breaking out on heavy volume. Then, if and only if, the stock advances 2-3% take another small position. Repeat this process one more time to round out your entire position. For example, if one wanted to buy $10,000 of stock; $5,000 would be the first buy, then if the stock rallies +2% the next buy would be $3,000, and the final $2,000 worth would be accumulated if the stock advances yet another +2%. This strategy is known as "pyramiding" and is extremely useful when used properly, as it lets the market action help to dictate how heavily you invest. Once meaningful gains are there to provide a profit cushion for investors, if a subsequent base forms, one might consider "force feeding" winners when subsequent buy signals may occur. Never average your cost basis up by buying larger amounts at higher prices, and never average down.
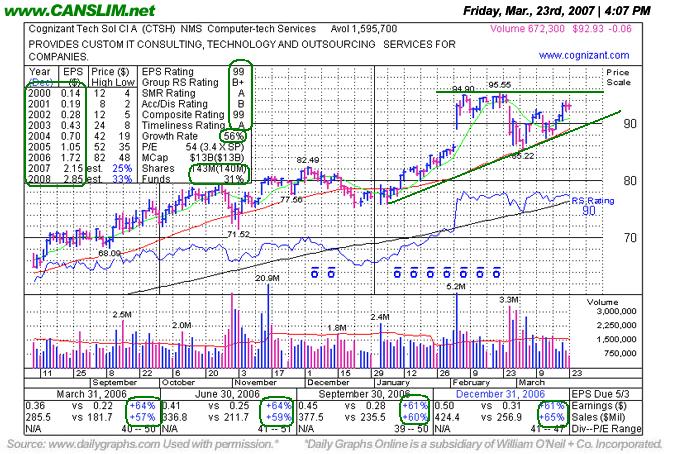
Watching For Another Time to Buy, or Another Sell Signal - Friday, March 23, 2007
Investors who hold profitable positions in any stock should have the essential skills to know when and how to add to a winner, while they must also be able to recognize when a compelling sell signal occurs. Today we are highlighting one situtation that long time readers may very likely be looking at. Hopefully, this study can be applied to other examples CANSLIM.net members may confront the future.
The ideal time to make initial stock purchases is when a high-ranked leader rises above its pivot point from a first stage base. Ideally, the stock spends the next few weeks rising, then begins building a base-on-base pattern. A smart time to add to the position will often be when the stock breaks out of another new base at least 6 weeks in duration. When adding to a winner, buy a smaller amount of shares at the higher levels so as to not raise your average cost too much. For example, if you initially bought 2,000 shares on the first breakout, you might buy only 1,000 shares on the add-on purchase. This pattern can be repeated after multiple breakouts, however at later stages stocks become more failure prone. When the stock tops out and sell signals start to mount, ultimately one must be ready to sell their entire position when critical support is violated.
Cognizant Technology Solutions Corp. (CTSH +$0.16 or +0.17% to $93.15), provider of information technology (IT) consulting and technology services, is nearing its prior chart highs, but its gains in the past two weeks have lacked great volume conviction. It was previously featured on Wednesday, September 13, 2006 in the CANSLIM.net Mid Day Breakouts Report (read here) with a $72.09 pivot point, which it cleared with great conviction. This leader hails from the strong Computer-tech Services group which is presently ranked 61st out of the 197 Industry Groups covered in the newspaper, placing it just outside of the top quartile. CTSH found great support at its 50 DMA line in early-November. When it slumped slightly under that important short-term average during the December-January period there were no losses with eye-catching heavy volume. However, volume definitely rose to above average levels later, as the stock started climbing into new high ground! Then it gapped up on February 5, 2007, posting considerable gains backed by huge volume.
At least one technical sell signal already occurred in CTSH as it gapped down on February 27th, the day the market averages began their sharp correction, creating an "island reversal" pattern - which is often an ominious sign. But it held above its 50 DMA line nicely during the market's recent correction, showing signs of institutional support. An eventual blast above its new pivot point of $95.65 with gains backed by at least +50% above average volume may produce a new technical buy signal. Of course, and violations of the 50 DMA line and upward trendline could be considered technical sell signals to watch out for. Disciplined investors will always limit losses at 7-8% below their purchase price to properly manage risk. In cases where shares were added at higher prices, those shares should always be sold whenever the stock falls 7% from the point of that add-on buy.
C A N S L I M | StockTalk | News | Chart | ![]() DGO | SEC | Zacks Reports
DGO | SEC | Zacks Reports
View all notes | Alert me of new notes | CANSLIM.net Company Profile
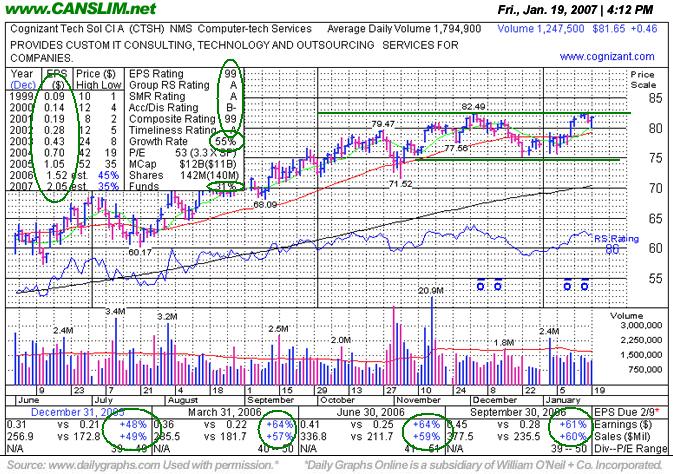
Leader Builds New Base - Friday, January 19, 2007
An essential skill to successful investing is knowing when and how to add to a winner. The ideal time to purchase a stock is when it breaks out through its pivot point from a first stage base. Ideally, the stock spends the next few weeks rising then begins building a base-on-base pattern. A smart time to add to the position would often be when the stock breaks out of another new base. When adding to a winner, buy a smaller amount of shares at the higher levels so as to not raise your average cost too much. For example, if you initially bought 2,000 shares on the first breakout, you might buy only 1,000 shares on the add-on purchase. This pattern can be repeated after multiple breakouts, however at later stages stocks become more failure prone. When the stock tops out and sell signals start to mount, ultimately one must be ready to sell their entire position when critical support is violated.
Cognizant Technology Solutions Corp. (CTSH +$0.47 or +0.57% to $81.66) positively reversed today, repairing early losses to close with a gain and finish in the upper half of its intra-day trading range. This stock was recently featured on Wednesday, September 13, 2006 in the CANSLIM.net Mid Day Breakouts Report (read here) with a $72.09 pivot point. More recently, this stock appeared in the November 10, 2006 CANSLIM.net After Market Report (read here) describing its action. Since that report, CTSH has spent the past few months tracing out a new base.
This leader hails from the strong Computer-tech Services group which is ranked 28th out of the 197 Industry Groups covered in the newspaper, placing it in the much preferred top quartile. Picking solid stocks in leading industry groups is a very important characteristic - the "L" criteria in the CANSLIM(R) investment program. CTSH is currently trading above its 50 DMA and just -1.2% off its recent 52-week high. Technically this issue has built another base which created a new pivot point. As a result, its CANSLIM.net status has changed from Green back to Yellow. Furthermore, if this stock manages to blast through its new pivot point of $82.59 with gains backed by at least +50% above average volume then a new technical buy signal will be triggered. Disciplined investors will always limit losses at 7-8% below their purchase price to properly manage risk.
C A N S L I M | StockTalk | News | Chart | ![]() DGO | SEC | Zacks Reports
DGO | SEC | Zacks Reports
View all notes | Alert me of new notes | CANSLIM.net Company Profile
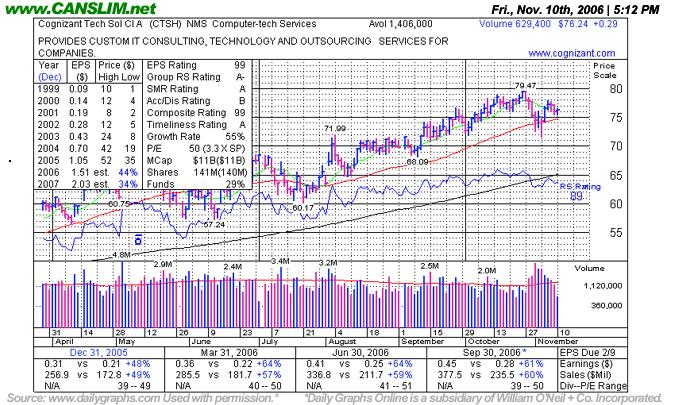
Support At 50 DMA Holding Thus Far - Friday, November 10, 2006
Longstanding readers of this section in the CANSLIM.net After Market Report are well versed on the importance of upward trendlines. It is also important to note how stocks behave after an upward trendline is violated. By definition, an upward trendline develops when a stock has steadily appreciated for an extended period of time. During that period the stock vacillates between the lower and upper boundary of the trendline. However, once the bears show up and the lower trendline is violated then odds start favoring the possibility of further downside testing.
Cognizant Technology Solutions Corp. (CTSH +$0.29 or +0.38% to $76.24) rallied Friday on below average volume as it continued consolidating above its 50 DMA. This stock was first featured on Wednesday, September 13, 2006 in the CANSLIM.net Mid Day Breakouts Report (read here) with a $72.09 pivot point. More recently, this stock appeared in the October 18, 2006 CANSLIM.net After Market Report (read here) discussing its recent action. CTSH has yet to make considerable upward progress since it was recently featured. Instead, it has endured some tough distributional action, yet it has also fought to continue trading above important support its 50-day moving average (DMA) line. This healthy leader hails from the strong Computer-tech Services group which is ranked 33rd out of the 197 Industry Groups covered in the newspaper. Picking solid stocks in leading industry groups is a very important characteristic - the "L" criteria in the CANSLIM(R) investment program. CTSH is currently trading above its 50 DMA and a few cents off its recent 52-week high, and odds still suggest that even higher prices will follow. Disciplined investors always limit losses at 7-8% to properly manage risk. Deterioration under the latest chart lows would be a bad technical failure. Any violation and close below the 50 DMA line would raise concerns, and any damaging losses on higher than average volume would be considered sell signals.
C A N S L I M | StockTalk | News | Chart | ![]() DGO | SEC | Zacks Reports
DGO | SEC | Zacks Reports
View all notes | Alert me of new notes | CANSLIM.net Company Profile
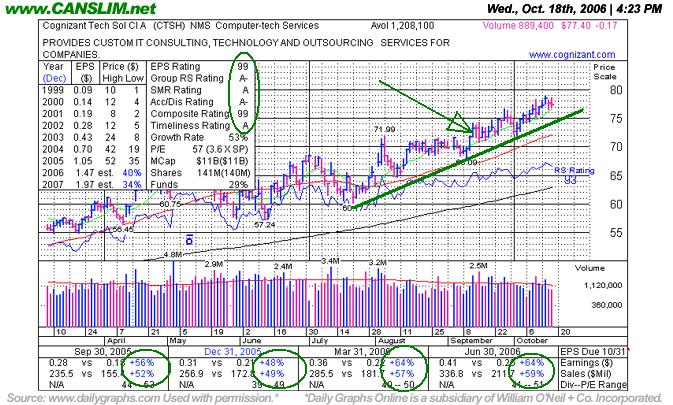
Healthy Action- Testing New Highs - Wednesday, October 18, 2006
Once again, the "L" criteria in CAN SLIM(TM) tells investors to choose leading companies in leading industry groups, and when we have identified a high-ranked leader with the proper characteristics we should wait and watch for gains on at least +50% above average volume as a confirmation that a breakout is attracting meaningful institutional sponsorship. A classic example of the success enjoyed by many CANSLIM.net readers usually starts when an investor reads a CANSLIM.net report and buys a featured stock before it has risen above the pivot point by greater than 5%. After a stock triggers a technical buy signal and is purchased, it is always important to employ the 7-8% loss cutting rule in the event of a downturn.
Cognizant Technology Solutions Corp. (CTSH -$0.17 or -0.22% to $77.40) closed lower on below average volume for the second consecutive day. This stock was first featured on Wednesday, September 13, 2006 in the CANSLIM.net Mid Day Breakouts Report (read here) with a $72.09 pivot point. That same day, this issue was featured in the CANSLIM.net After Market Report (read here) discussing, in detail, the amazing run this stock had and highlighting how risk picks up in latter stage bases. This stock is a healthy leader and it hails from the healthy Computer-tech Services group, which is ranked 36th out of the 197 Industry Groups covered in the newspaper. Picking solid stocks in healthy industry groups is a very important characteristic ("L") in the CANSLIM(R) investment program. CTSH is currently trading above its 50 DMA and a few cents off its recent 52-week high, and odds suggest that even higher prices will follow. However, buying any stock more than 5% above a sound buy point is risky, thus disciplined investors should refrain from entering new positions at today's prices.
C A N S L I M | StockTalk | News | Chart | SEC | Zacks Reports
View all notes | Alert me of new notes | CANSLIM.net Company Profile
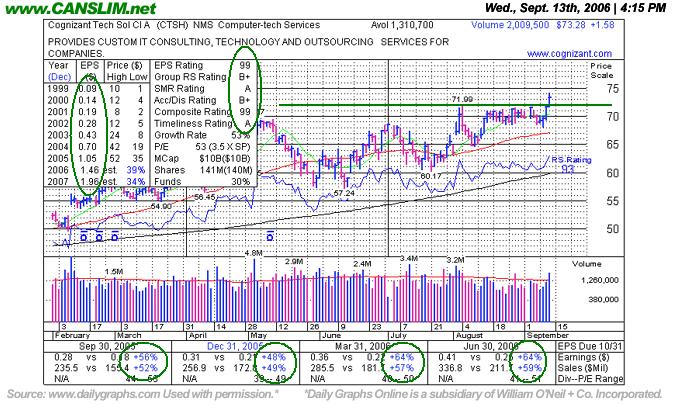
Familar Favorite Breaking Again Out At Later Stage - Wednesday, September 13, 2006
Cognizant Technology Solutions Corp. (CTSH +$1.58 or +2.11% to $73.28) managed to close at a fresh all-time high while breaking out from decent late stage base. With gains today lifting it above its prior chart highs, and above its pivot point, the session's volume total was just over the required minimum to trigger a proper technical buy signal. Ideally, one would like to see a leading stock blast above its pivot point on at least +50% above average volume. In fact, most big winners flash a more dramatic dramatic rise in volume during their breakouts, often trading several times their average daily volume totals.
CTSH sports solid rankings and was featured in today's CANSLIM.net Mid Day Breakouts Report (read here) with a $72.09 pivot point. However, it is also important to note how far this stock has moved in the past several years. It was not a low priced stock at the time it was beginning its major advance. It first appeared in the January 2003 issue of our monthly CANSLIM.net News (read here) at about $72 per share (not adjusting for two different stock splits that came later) and it initially struggled, but then it really took off in June of that year. When you look at a longer term chart today, it appears as if CTSH was trading near $12 a share back in January 2003, but obviously looks can be deceiving sometimes. Do not miss factoring in the 3-for-1 stock split that happened in April '03 or the 2-for-1 split in June '04. This helps to exemplify why many investors mistakenly believe they need to buy low priced stocks to have better chances at great gains. It is up about 6-fold since its January '03 appearance, but right when it was near the beginning of a great run, investors who look exclusively for stocks that are $5, $10 or $15 per share would have considered this stock too expensive.
As long as this issue continues trading above its pivot point, odds favor that higher prices will follow. It would be advisable to keep a close stop to avoid any unnecessary downside testing. A loss leading to a close back under its old high close at $71.50 (on 9/5/06) would totally negate the breakout and be cause for concern.
C A N S L I M | StockTalk | News | Chart | SEC | Zacks Reports
View all notes | Alert me of new notes | CANSLIM.net Company Profile