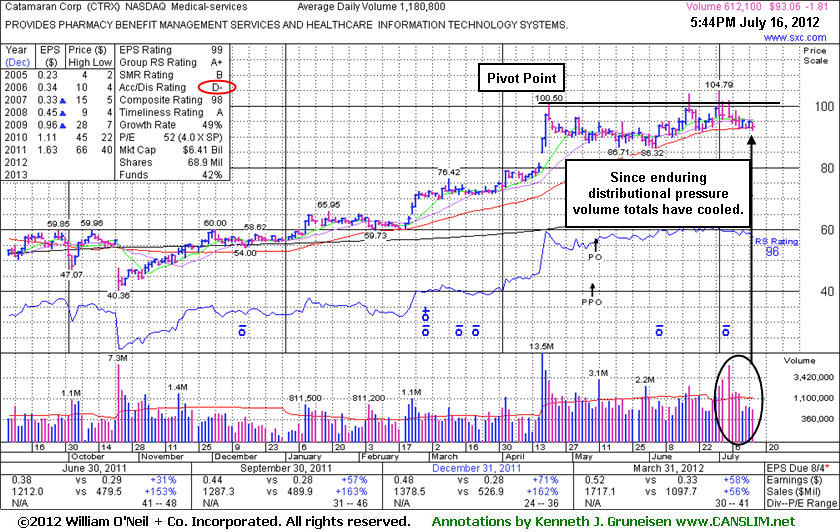
Negative Reversals Noted as Recent Signs of Distribution - Monday, July 16, 2012
Catamaran Corp (CTRX -$1.81 or -1.91% to $93.06) has been finding support near its 50-day moving average (DMA) line. Since enduring distributional pressure its volume totals have been cooling. Further deterioration would be a disconcerting sign. It was noted repeatedly as it churned above average volume while not making headway above its pivot point, and recent "negative reversals" were noted as signs of distributional pressure. Without volume-driven gains into new high territory, what was once a promising looking set-up could become a worrisome "double top" pattern. A subsequent breakdown below prior lows in the $86 area would complete that bearish pattern and trigger a more worrisome technical sell signal.
SXC Health Solutions and Catalyst Health Solutions recently completed a previously noted merger and re-branded the company as Catamaran Corp. SXC's last appearance in this FSU section was on 6/14/12 with an annotated daily graph under the headline, "New Pivot Point Cited While Building Based During Market Correction". Its Accumulation/Distribution Rating was B then, but it has slumped to a D- (see red circle).
It completed a new Public Offering on 5/10/12. It reported earnings +58% on +56% sales revenues for the quarter ended March 31, 2012 versus the year ago period, continuing its streak of strong quarterly and good annual earnings increases which satisfy the C and A criteria. Ownership by top-rated funds rose from 573 in Sep '11 to 661 in Mar '12. Concerning the I criteria, that is a very favorable sign. It was first featured at $62.05 on 1/10/12 when highlighted in yellow in the mid-day report with an annotated daily graph (read here).
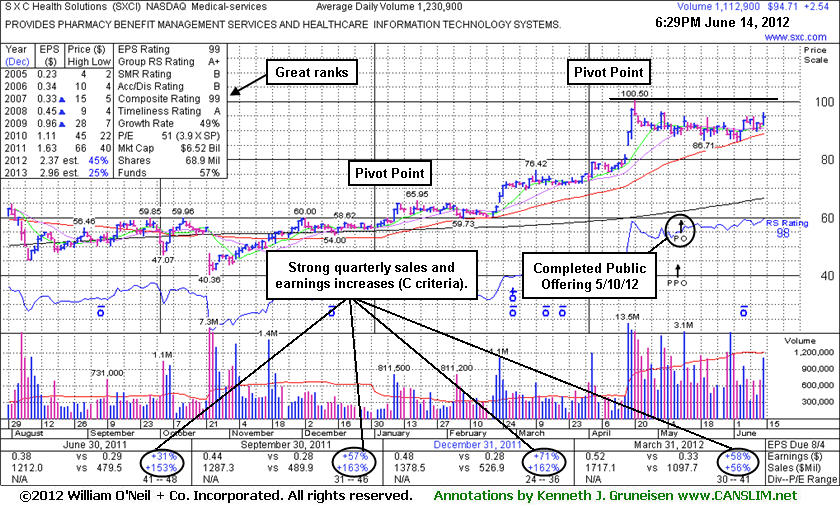
New Pivot Point Cited While Building Based During Market Correction - Thursday, June 14, 2012
SXC Health Solutions Corp. (SXCI +$3.59 or +3.89% to $95.76) has been consolidating in a tight trading range in recent weeks while finding support above its 50-day moving average (DMA) line. It completed a new Public Offering on 5/10/12. A new pivot point is cited based on its 4/20/12 high plus 10 cents while building on a 9-week base. Volume driven gains above the pivot point may trigger a new (or add-on) technical buy signal. However, the M criteria still argues against new buying efforts without a confirmed rally with a solid FTD from at least one of the major averages. It reported earnings +58% on +56% sales revenues for the quarter ended March 31, 2012 versus the year ago period, continuing its streak of strong quarterly and good annual earnings increases which satisfy the C and A criteria. Ownership by top-rated funds rose from 453 in Jun '10 to 608 in Dec '11. Concerning the I criteria, that is a very favorable sign.
Its last appearance in this FSU section was on 5/17/12 with an annotated daily graph under the headline, "Consolidation May Be New Base; Poor Market an Overriding Concern". Much earlier, on 2/23/12 its color code had been changed to yellow as a pivot point was cited based on its 1/19/12 high plus 10 cents. The gap up for a considerable volume-driven gain on that session triggered a new (or add-on) technical buy signal. It was first featured at $62.05 on 1/10/12 when highlighted in yellow in the mid-day report with an annotated daily graph (read here).
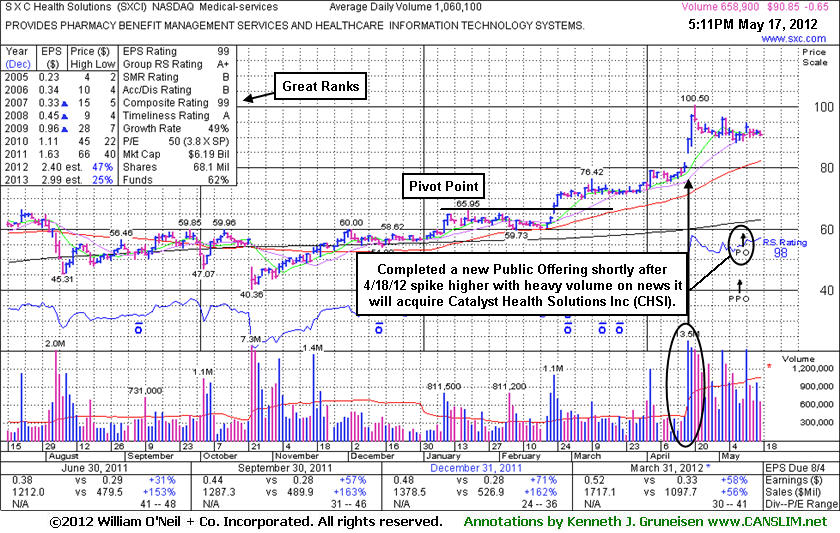
Consolidation May Be New Base; Poor Market an Overriding Concern - Thursday, May 17, 2012
SXC Health Solutions Corp. (SXCI -$0.65 or -0.71% to $90.85) is still holding its ground in a tight range after pricing a new Public Offering last week. It has been consolidating since it posted huge volume-driven gains on 4/18 and 4/19 while rallying following news it will acquire and merge with Catalyst Health Solutions Inc (CHSI). It may be forming a new base pattern, however poor market conditions (M criteria) argue against any new buying efforts until there is a new confirmed rally with a solid follow-through day from at least one of the major averagesIts last appearance in this FSU section was on 3/06/12 with an annotated daily graph under the headline, "Holding Ground While Extended From Latest Base Pattern", and it stayed well above prior highs in the $66 area which were noted as support to watch on pullbacks. On 2/23/12 its color code had been changed to yellow as a new pivot point was cited based on its 1/19/12 high plus 10 cents. The gap up for a considerable volume-driven gain on that session triggered a new (or add-on) technical buy signal. It was first featured at $62.05 on 1/10/12 when highlighted in yellow in the mid-day report with an annotated daily graph (read here).
It reported earnings +58% on +56% sales revenues for the quarter ended March 31, 2012 versus the year ago period, continuing its streak of strong quarterly and good annual earnings increases which satisfy the C and A criteria. Ownership by top-rated funds rose from 453 in Jun '10 to 608 in Dec '11. Concerning the I criteria, that is a very favorable sign.
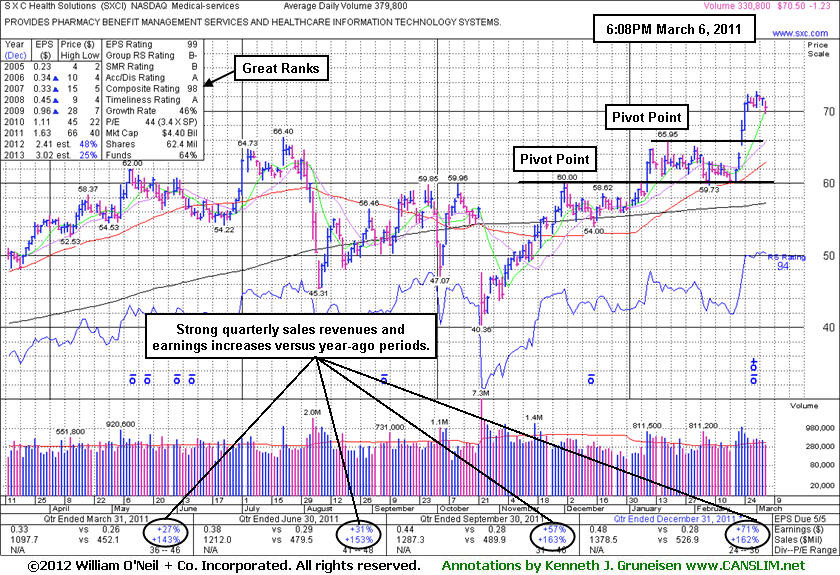
Holding Ground While Extended From Latest Base Pattern - Tuesday, March 06, 2012
SXC Health Solutions Corp. (SXCI -$1.23 -1.71% to $70.50) is holding its ground stubbornly near its all-time high. Prior highs in the $66 area define support to watch on pullbacks. No resistance remains due to "overhead supply", however it is extended from any sound base and currently consolidating above the "max buy" level cited which is +5% above the pivot point. It was first featured at $62.05 on 1/10/12 when highlighted in yellow in the mid-day report with an annotated daily graph (read here). That is when it was rallying above the first pivot point shown on the chart below.
Its last appearance in this FSU section was on 1/20/12 with an annotated weekly graph under the headline, "Four Winning Weeks While Approaching 52-Week High". On 2/01/12 its color code was changed to green after it had risen above the previously cited "max buy" level, however, in the following weeks it continued to consolidate and found support above its 50-day moving average (DMA) line.
It reported earnings +71% on +162% sales revenues for the quarter ended December 31, 2011 versus the year ago period, continuing its streak of strong quarterly and good annual earnings increases which satisfy the C and A criteria. On 2/23/12 its color code was changed to yellow as a new pivot point was cited based on its 1/19/12 high plus 10 cents. The gap up for a considerable volume-driven gain on that session triggered a new (or add-on) technical buy signal.
Regardless of where any stock is bought, disciplined investors always limit losses if a stock ever falls more than -7% from their purchase price per the investment system's "Rule #1". If things ever go wrong, that is always the best insurance against greater losses. One reassurance that things will not go wrong is when ownership by top-rated funds has been increasing, in this case rising from 453 in Jun '10 to 620 in Dec '11. Concerning the I criteria, that is a very favorable sign.
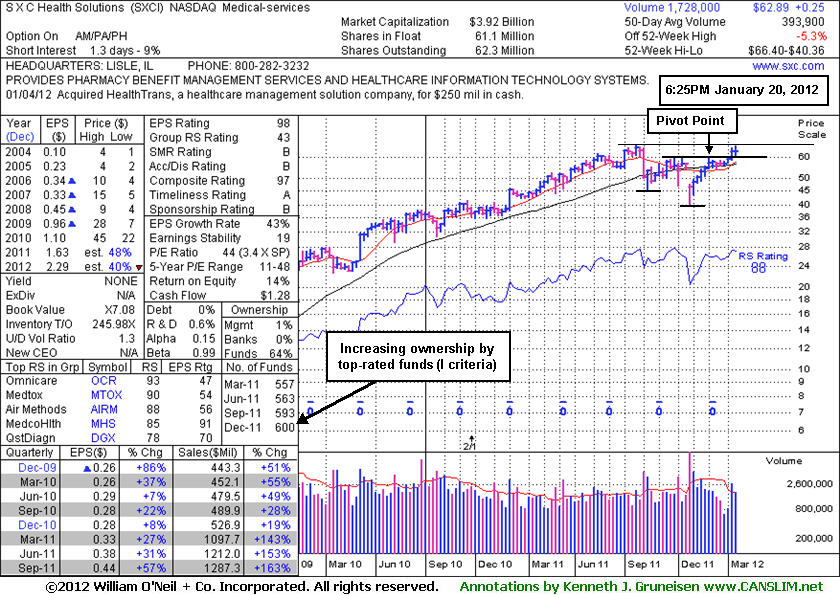
Four Winning Weeks While Approaching 52-Week High - Friday, January 20, 2012
SXC Health Solutions Corp. (SXCI +$0.04 +0.06% to $62.89) provides pharmacy benefit management (PBM) services and healthcare information technology solutions to the healthcare benefits management industry in North America. It was first featured on 1/10/12 when highlighted in yellow in the mid-day report with an annotated daily graph (read here).
The weekly graph below shows that it has tallied 4 consecutive weekly gains. As prior notes suggested, it has encountered some resistance due to "overhead supply". It was getting extended from its previously noted breakout from a sound base pattern, especially as it challenged its 52-week high after gapping up on Thursday (best seen on a daily graph), but it closed near that session's low after a negative reversal. Volume was even lighter on Friday as it held its ground. Now it is consolidating just below the "max buy" level cited, which is +5% above the pivot point.
SXCI already technically broke out on 1/10/12 with twice its average volume behind the breakout gain. Some may consider the 52-week high a "pivot point" and may later argue that new (or add-on) buying efforts are worth considering if additional bullish action transpires. A view of the weekly graph below, however, would sooner be considered a 27-week consolidation, which is a big "double base" pattern with a lower, more conservative pivot point. Regardless of where any stock is bought, disciplined investors always limit losses if a stock ever falls more than -7% from their purchase price per the investment system's "Rule #1". If things ever go wrong, that is always the best insurance against greater losses.
One reassurance that things will not go wrong is when ownership by top-rated funds has been increasing, in this case rising from 453 in Jun '10 to 600 in Dec '11. Concerning the I criteria, that is a very favorable sign. Strong prior quarters and good annual earnings history satisfy the C and A criteria.