53% Decline in Just Over 3 Months After Dropped From Featured Stocks - Friday, October 07, 2011
When the number of stocks included on the Featured Stocks page is low, and those currently listed have all received recent analysis in this FSU section, we occasionally go back to revisit a previously featured stock that was dropped. Today we will have another look at a stock that was dropped from the Featured Stocks list back on 4/28/11. CTCT sank as much as -53% lower in a little more than 3 months after it was dropped from the Featured Stocks list. That serves as a reminder that losses should always be limited by selling if ever any stock falls more than -7% from your purchase price. That is Rule #1 in the fact-based investment system CANSLIM.net supports.
Constant Contact Inc (CTCT -$0.55 or -3.10% to $17.22) made its last appearance in this FSU section with an annotated graph on 4/19/11 under the headline, "Damaging Distributional Action Negated Recent Breakout, as it was down considerably with a 2nd damaging loss with heavy volume in the span of 3 sessions. It had slumped below its 50-day moving average (DMA) line and finished near the session low, raising concerns and triggering worrisome technical sell signals. We observed that distributional pressure had completely negated its prior breakout from a choppy 13-week base, hurting its near-term chances of going on for much greater gains. From there it held its ground for another week, but it failed to rebound above the 50 DMA line. Then it was noted while being dropped from the Featured Stocks list as it reported earnings after the close on Thursday, April 28th. Earnings results for the quarter ended March 31, 2011 were disappointing, -33% from the year ago period despite a +27% increase in sales revenues. The stock gapped down badly the next day and since then it has continued to struggle.
It was previously noted that its sales revenues increases showed steady sequential deceleration from +55%, +49%, +47%, +43%, +40%, +37%, +34%, to +30% from the Mar '09 through the Dec '10 quarterly comparison(s) versus the respective year(s) earlier. Earnings increased by +245% on +24% sales revenues for the quarter ended June 30, 2011, maintaining its track record of steady sales revenues deceleration. Disciplined investors following the fact-based system would have a problem now with the flaw in its earnings track record. Additionally, increasing ownership by top-rated funds is normally a reassuring sign (I criteria) that disciplined investors look for in superior buy candidates. However, the number of top-rated funds owning CTCT shares has fallen from 314 in Mar '11 to 281 in Sep '11, not a very reassuring trend.

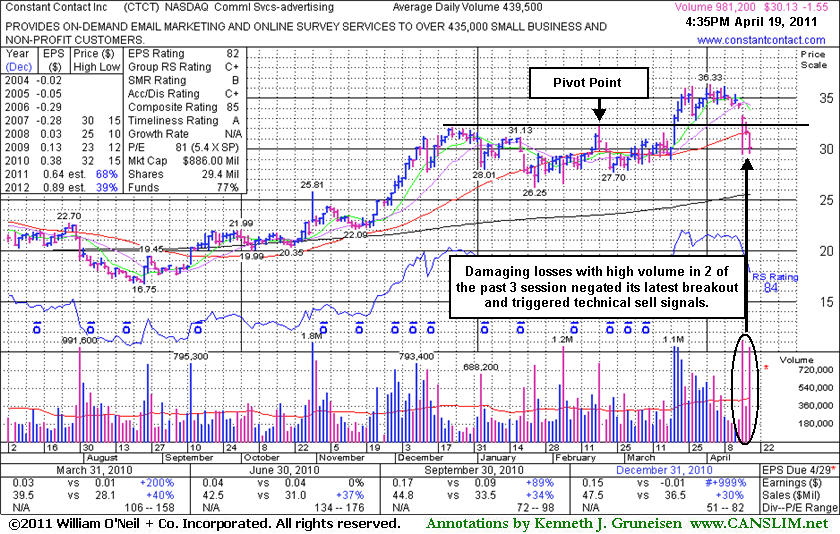
Damaging Distributional Action Negated Recent Breakout - Tuesday, April 19, 2011
Constant Contact Inc (CTCT -$1.55 or -4.89% to $30.13) was down considerably today with its 2nd damaging loss with heavy volume in the span of 3 sessions. It slumped below its 50-day moving average (DMA) line again and finished near the session low, raising concerns and triggering worrisome technical sell signals. A gap down and damaging loss on Friday raised concerns, however its resilient finish near the session high suggested that prompt support (buying) was coming from the institutional crowd. The quiet loss on Monday, however, was followed by yet another damaging distribution day as it closed today's session decisively below its 50 DMA line. The distributional pressure has completely negated its breakout from a choppy 13-week base, hurting its near-term chances of going on for much greater gains.CTCT is due to report earnings after the close on Thursday, April 28th. Volume and volatility often increase near earnings announcements. After its last appearance in this FSU section with an annotated graph on 3/22/11 under the headline, "Big Volume Accompanied Breakout This Week", it went on and hit new all-time highs. As previously noted, sales revenues increases show steady sequential deceleration from +55%, +49%, +47%, +43%, +40%, +37%, +34%, to +30% from the Mar '09 through the latest Dec '10 quarterly comparison(s) versus the respective year(s) earlier. It has shown good annual earnings increases since FY '08 and (A criteria) and great earning improvement in recent quarterly comparisons. Increasing ownership by top-rated funds is a reassuring sign (I criteria), rising from 241 in Mar '10 to 307 in Mar '11. As always, losses should be limited by selling if ever any stock falls more than -7% from your purchase price. That is Rule #1 in the fact-based investment system CANSLIM.net supports.
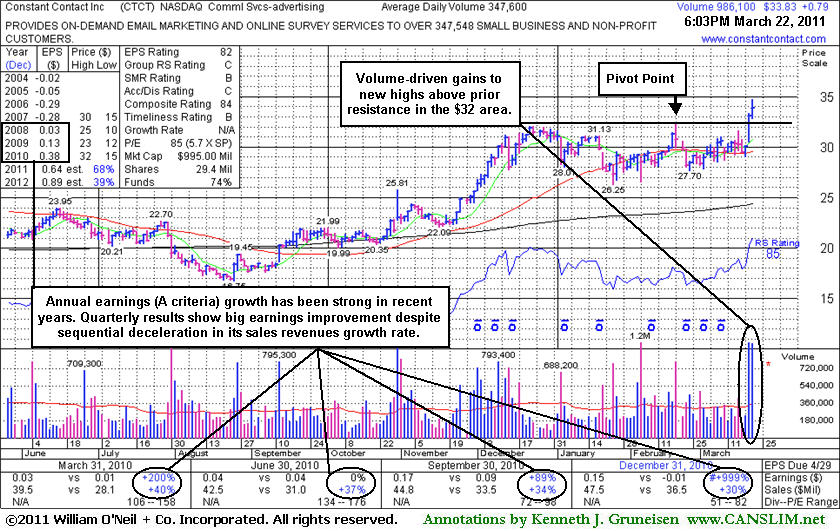
Big Volume Accompanied Breakout This Week - Tuesday, March 22, 2011
A proper technical buy signal under the investment system's guidelines requires a gain above the pivot backed by more than +50% above average volume. Most big winners in market history, in fact, blasted off with very heavy volume, they did not barely limp over their pivot points. Volume is a critical component to a sound technical breakout, as the intense burst of trading activity is what gives investors evidence of serious institutional buying demand - which is needed for a sustained advance!
Constant Contact inc (CTCT +$0.79 +2.39% to $33.83) hit a new all-time high today with a second consecutive volume-driven gain backed by approximately 3 times average volume. Its color code was changed to yellow with pivot point cited based on its prior high plus 10 cents when featured in the mid-day report earlier today. Volume driven gains to new all-time highs (N criteria) were reassuring proof of fresh institutional (I criteria) buying demand which can potentially lead to a sustained advance into new high territory. The bullish action warrants attention, however disciplined investors know that the M criteria remains an overriding concern until a follow-through day (FTD) from at least one of the major averages confirms a new rally. Three out of four stocks tend to go in the same direction of the major averages, and waiting for a FTD increases the odds that your new buying efforts will turn out to be profitable. The market commentary this evening goes into greater detail concerning what constitutes a proper FTD.
The 3/16/11 mid-day report cautiously had noted - "Sales revenues increases show steady sequential deceleration from +55%, +49%, +47%, +43%, +40%, +37%, +34%, to +30% from the Mar '09 through the latest Dec '10 quarterly comparison(s) versus the respective year(s) earlier. It has shown good annual earnings increases since FY '08 and (A criteria) and great earning improvement in recent quarterly comparisons. Very little overhead supply remains to act as resistance up through the $32 level, meanwhile it has been enduring distributional pressure while building a choppy 13-week base. Increasing ownership by top-rated funds is a reassuring sign (I criteria), rising from 241 in Mar '10 to 293 in Dec '10."