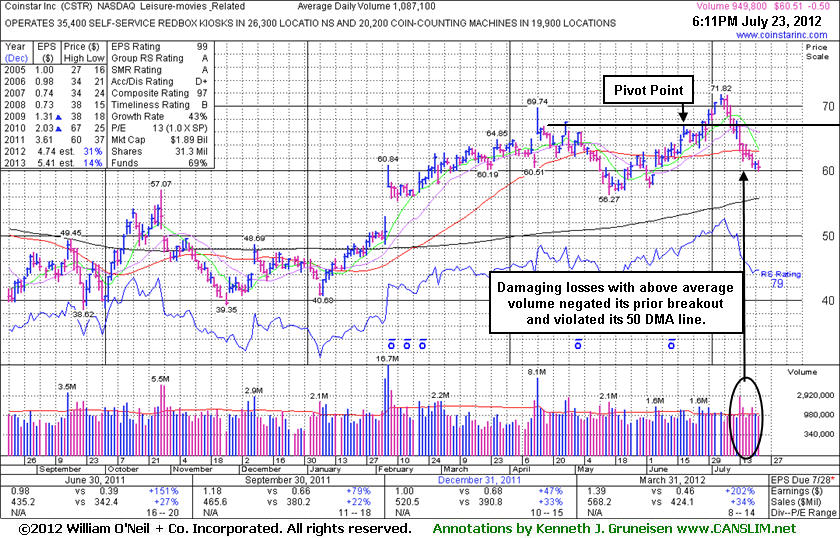
Slumping Further Below 50 DMA Line Following Damaging Losses - Monday, July 23, 2012
Coinstar Inc (CSTR -$0.50 or -0.82% to $60.51) sank further below its 50-day moving average (DMA) line today a small loss on near average volume. Above average volume was behind recent losses which negated its prior breakout and violated its 50 DMA line triggering technical sell signals. Disciplined investors always limit losses by selling if any stock falls more than -7% from their purchase price. It needs gains above its 50 DMA line to improve its technical stance and its near-term outlook. Meanwhile it appears vulnerable to greater damage, and the next important support level is defined by its May lows and its 200 DMA line.
Its Accumulation/Distribution Rating has slumped from a B to a D+ since it was last shown in this FSU section on 6/26/12 with an annotated graph under the headline, "Formed Cup-With Handle Base, But Watch First For Technical Breakout" after highlighted in yellow in the mid-day report (read here) with pivot point based on its 6/19/12 high after a cup-with handle base. It was then observed - "There was above average volume behind its gain, but it did not rally above its pivot point. Disciplined investors will watch for a solid volume-driven gain to confirm a breakout before taking action. It is now perched within close striking distance of its 52-week high and all-time high, however the $67-69 area has been a stubborn resistance level in recent years." It subsequently posted a gain on 6/29/12 with +42% above average volume, near the bare minimum volume threshold, yet finished above its pivot point confirming a technical buy signal. However, by 7/13/12 it was noted that damaging action had negated its technical breakout and its color code was changed to green. Since then it has failed to produce gains backed by above average volume, yet it has endured more damaging distributional pressure.
It has earned the highest possible rank of 99 for its Earnings Per Share growth, and a 97 Composite Rating. Quarterly comparisons show strong sales revenues and earnings increases (C criteria), and its annual earnings (A criteria) history has been good. The number of top-rated funds owning its shares rose from 350 in Jun '11 to 401 in Jun '12, a reassuring sign concerning the I criteria.
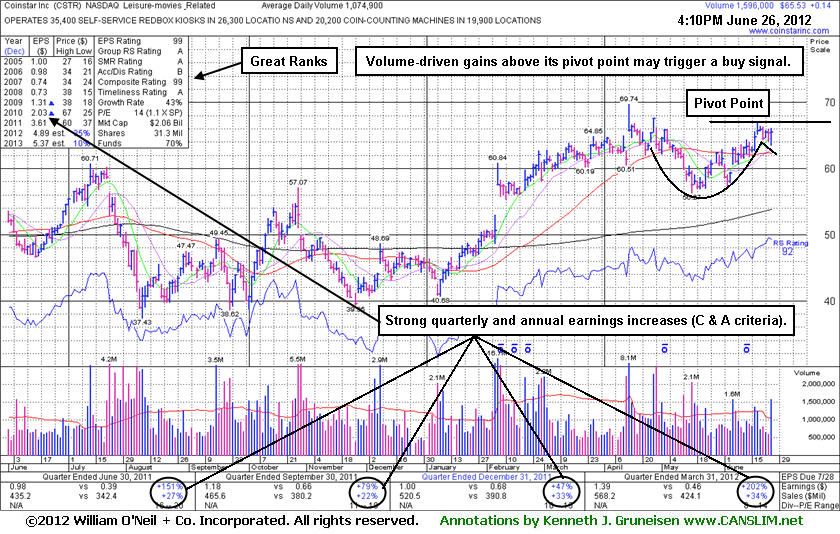
Formed Cup-With Handle Base, But Watch First For Technical Breakout - Tuesday, June 26, 2012
Often, when a leading stock is setting up to breakout of a solid base it is highlighted in CANSLIM.net's Mid-Day Breakouts Report. The most relevant factors are noted in the report which alerts prudent CANSLIM oriented investors to place the issue in their watch list. After doing any necessary backup research, the investor is prepared to act after the stock triggers a technical buy signal (breaks above its pivot point on more than +50% average turnover) but before it gets too extended from a sound base. In the event the stock fails to trigger a technical buy signal and its price declines then it will simply be removed from the watch list. Disciplined investors know to buy as near as possible to the pivot point and avoid chasing stocks after they have rallied more than +5% above their pivot point. It is crucial to always limit losses whenever any stock heads the wrong direction, and disciplined investors sell if a struggling stock ever falls more than -7% from their purchase price.
Coinstar Inc (CSTR +$0.14 or +0.21% to $65.53) was highlighted in yellow in the mid-day report today (read here) with pivot point based on its 6/19/12 high after a cup-with handle base. There was above average volume behind its gain, but it did not rally above its pivot point. Disciplined investors will watch for a solid volume-driven gain to confirm a breakout before taking action. It is now perched within close striking distance of its 52-week high and all-time high, however the $67-69 area has been a stubborn resistance level in recent years. It went through a consolidation below its 50-day moving average (DMA) line since noted on 4/13/12 following a considerable gap up gain after raising its guidance. "No overhead supply remains to act as resistance. Recently wedged to new 52-week highs without great volume conviction and did not form a sound base pattern. Disciplined investors may watch for an ideal base or secondary buy point to possibly develop and be noted. Quarterly comparisons show strong sales revenues and earnings increases (C criteria), and its annual earnings (A criteria) history has been good."
The number of top-rated funds owning its shares rose from 350 in Jun '11 to 394 in Mar '12, a reassuring sign concerning the I criteria. It has earned the highest possible rank of 99 for both its Earnings Per Share and Composite Rating, and it other great ranks. There is no advantage to getting in "early" however, and patient investors will watch for fresh signs of meaningful buying demand from the institutional crowd before leaping in. If a significant advance in price is going to happen, there will be evidence of more aggressive accumulation. Meanwhile, it is an ideal candidate for investors to have on their watchlist.