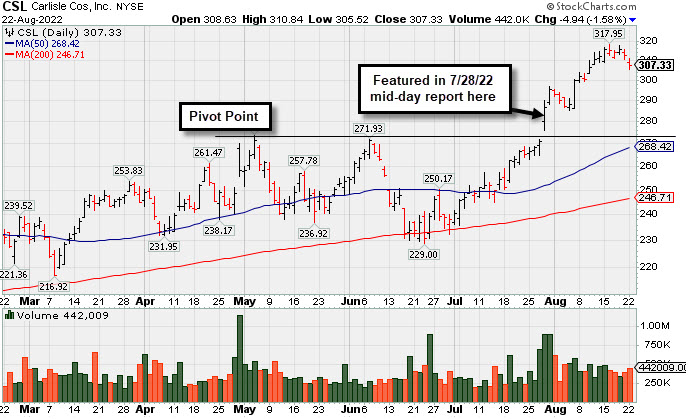
Consolidating Near High Well Above 50-Day Moving Average - Wednesday, September 14, 2022
Carlisle Cos Inc (CSL +$1.23 or +0.41% to $302.70) has been consolidating near its all-time high. Its prior low $291 defines near term support to watch above its 50-day moving average (DMA) line ($289).
Bullish action continued since highlighted in yellow in the 7/28/22 mid-day report (read here) with pivot point cited based on its 5/04/22 high plus 10 cents. CSL was last shown in detail in this FSU section on 8/22/22 with an annotated graph under the headline, "Pulling Back From All-Time High After Volume-Driven Gains".
CSL has a 97 Earnings Per Share Rating. It recently reported Jun '22 quarterly earnings +185% on +57% sales revenues versus the year ago period, its 4th very strong quarter well above the +25% minimum earnings guideline (C criteria). Annual earnings (A criteria) history included a small downturn in FY '20 that was previously noted.
There are 51.7 million shares outstanding, which can contribute to greater price volatility in the event of institutional buying or selling. The number of top-rated funds owning its shares rose from 772 in Sep '21 to 839 in Jun '22, a reassuring sign concerning the I criteria. Its current Up/Down Volume Ratio of 2.5 is an unbiased indication its shares have been under accumulation over the past 50 days.
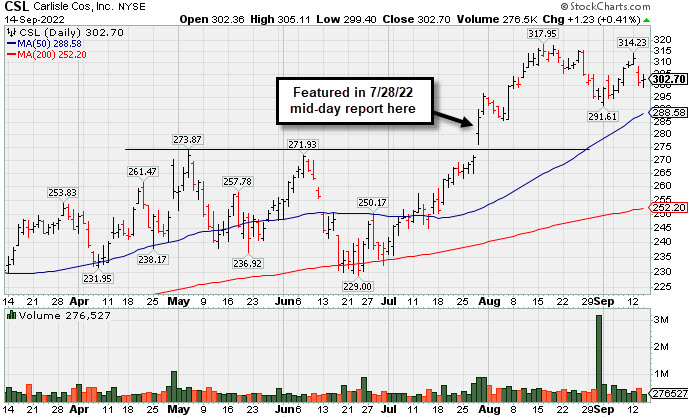
Pulling Back From All-Time High After Volume-Driven Gains - Monday, August 22, 2022
Carlisle Cos Inc (CSL -$4.94 or -1.58% to $307.33) pulled back from its all-time high with near average volume behind today's second consecutive loss. It has been noted as very extended from the previously noted base. Prior highs in the $275 area define initial support to watch on pullbacks.
Bullish action continued since highlighted in yellow in the 7/28/22 mid-day report with pivot point cited based on its 5/04/22 high plus 10 cents. It was last shown in detail in this FSU section on 8/02/22 with an annotated graph under the headline, "Carlisle Perched at All-Time High After Noted Breakout".
CSL has a 97 Earnings Per Share Rating. It recently reported Jun '22 quarterly earnings +185% on +57% sales revenues versus the year ago period, its 4th very strong quarter well above the +25% minimum earnings guideline (C criteria). Annual earnings (A criteria) history included a small downturn in FY '20 that was previously noted.
There are 51.7 million shares outstanding, which can contribute to greater price volatility in the event of institutional buying or selling. The number of top-rated funds owning its shares rose from 772 in Sep '21 to 827 in Jun '22, a reassuring sign concerning the I criteria. Its current Up/Down Volume Ratio of 1.8 is an unbiased indication its shares have been under accumulation over the past 50 days.
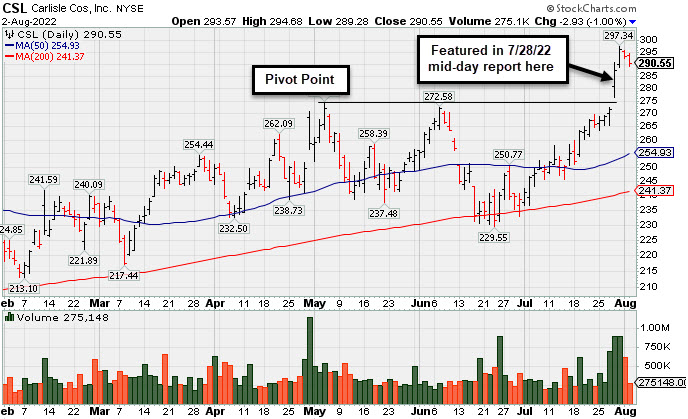
Carlisle Perched at All-Time High After Noted Breakout - Tuesday, August 2, 2022
Carlisle Cos Inc (CSL -$2.93 or -1.00% to $290.55) saw light volume behind today's small loss while remaining perched near its all-time high. It rallied above its "max buy" level with 5 consecutive volume-driven gains. Bullish action continued since highlighted in yellow in the 7/28/22 mid-day report with pivot point cited based on its 5/04/22 high plus 10 cents. It found support in recent weeks at its 200 DMA line ($241).
CSL has a 98 Earnings Per Share Rating. It recently reported Jun '22 quarterly earnings +185% on +57% sales revenues versus the year ago period, its 4th very strong quarter well above the +25% minimum earnings guideline (C criteria). Annual earnings (A criteria) history included a small downturn in FY '20 that was previously noted.
There are 51.7 million shares outstanding, which can contribute to greater price volatility in the event of institutional buying or selling. The number of top-rated funds owning its shares rose from 772 in Sep '21 to 814 in Jun '22, a reassuring sign concerning the I criteria. Its current Up/Down Volume Ratio of 2.2 is an unbiased indication its shares have been under accumulation over the past 50 days.