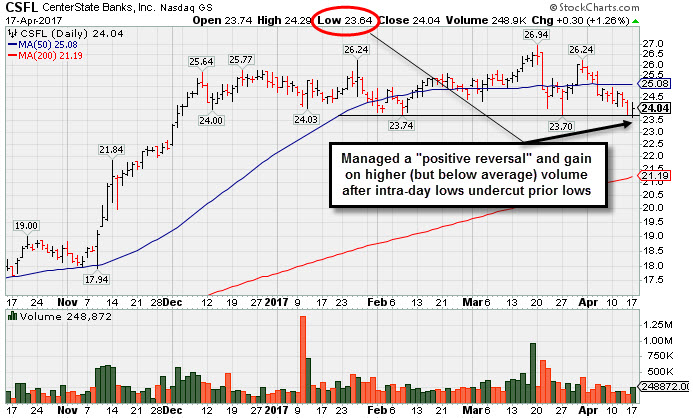
Positive Reversal After Intra-day Low Undercut Prior Lows - Monday, April 17, 2017
Centerstate Banks Inc (CSFL +$0.30 or +1.26% to $24.04) managed a "positive reversal" for a gain today with higher (but below average) volume after intra-day lows briefly undercut the prior lows noted as an important support level. More damaging losses would raise serious concerns. The ongoing slump below its 50-day moving average (DMA) line remains a problem chart-wise, and a rebound above the 50 DMA line ($25.08) is needed for its outlook to improve.It was last shown in this FSU section on 3/15/17 with an annotated graph under the headline, "Gain Backed By Volume For Best Ever Close". A subsequent gain backed by +210% above average volume on 3/17/17 cleared the a new pivot point cited based on its 1/26/17 high plus 10 cents and triggered a new (or add-on) technical buy signal. However, it stalled immediately and encountered distributional pressure.
CSFL traded up as much as +48% since highlighted in yellow at $18.20 in the 10/10/16 mid-day report (read here). It was first featured at $15.80 in the 5/27/16 mid-day report (read here). The company completed a new Public Offering of shares on 1/10/17. Such offerings often help companies to attract greater institutional ownership interest, although they can also hinder upward price progress for a while. The number of top-rated funds owning its shares rose from 180 in Jun '15 to 287 in Mar '17, a reassuring sign. Its current Up/Down Volume ratio of 1.0 is an unbiased indication its shares have been neutral, neither being accumulated or distributed noticeably over the past 50 days (I criteria). It currently has a Timeliness Rating of A and a Sponsorship rating of B.
The Dec '16 quarter marked its 9th consecutive earnings increase above the +25% minimum guideline (C criteria), and its annual earnings (A criteria) history has been good. Its small supply of only 49 millions shares (S criteria) in the public float can contribute to greater price volatility in the event of institutional buying or selling.
Charts used courtesy of www.stockcharts.com

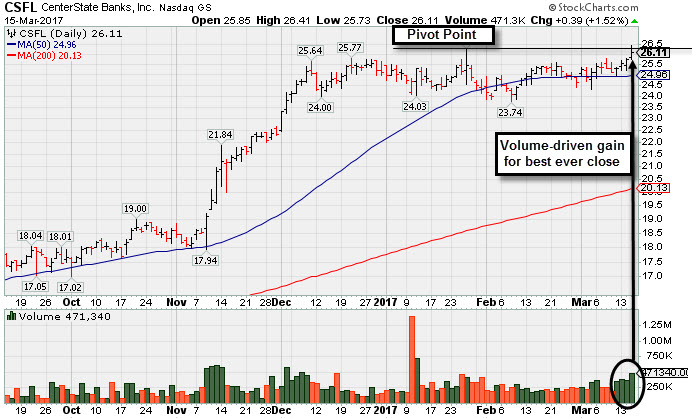
Gain Backed By Volume For Best Ever Close - Wednesday, March 15, 2017
Centerstate Banks Inc (CSFL +$0.39 or +1.52% to $26.11) posted a gain today backed by +61% above average volume and finished at a best-ever close. However, the gain did not clear the a new pivot point cited based on its 1/26/17 high plus 10 cents. Subsequent volume-driven gains for new highs may trigger a proper new (or add-on) technical buy signal. Recently it found support while consolidating near its 50 DMA line ($25), and the recent low ($23.80 on 2/08/17) defines the next important near-term support level where further deterioration would trigger a technical sell signal.
CSFL is up +43.5% since highlighted in yellow at $18.20 in the 10/10/16 mid-day report (read here). It was first featured at $15.80 in the 5/27/16 mid-day report (read here). The company completed a new Public Offering of shares on 1/10/17. It was last shown in this FSU section on 2/06/17 with an annotated graph under the headline, "Found Support Near 50-Day Average Following Offering". Such offerings often help companies to attract greater institutional ownership interest, although they can also hinder upward price progress for a while. The number of top-rated funds owning its shares rose from 180 in Jun '15 to 278 in Dec '16, a reassuring sign. Its current Up/Down Volume ratio of 0.9 is an unbiased indication its shares have been under very slight distributional pressure over the past 50 days (I criteria). It currently has a Timeliness Rating of A and a Sponsorship rating of B.
The Dec '16 quarter marked its 9th consecutive earnings increase above the +25% minimum guideline (C criteria), and its annual earnings (A criteria) history has been good. Its small supply of only 49 millions shares (S criteria) in the public float can contribute to greater price volatility in the event of institutional buying or selling.
Charts used courtesy of www.stockcharts.com

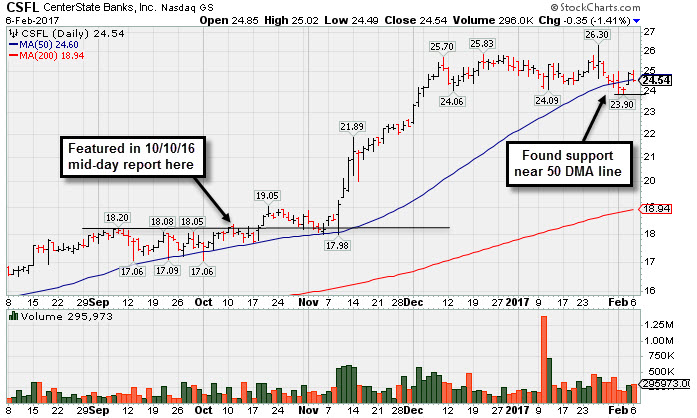
Found Support Near 50-Day Average Following Offering - Monday, February 6, 2017
Centerstate Banks Inc (CSFL -$0.35 or -1.41% to $24.54) pulled back today. It gapped up for a big gain on the prior session and rebounded above its 50-day moving average (DMA) line helping its outlook improve. Subsequent losses leading to deterioration below the 50 DMA line or damaging losses below the recent low ($23.90 last week) would raise concerns and trigger a technical sell signal.
It completed a new Public Offering of shares on 1/10/17, shortly after it was last shown in this FSU section on 1/04/16 with an annotated graph under the headline, "Bank Stock Perched Near Record Highs After Considerable Rally". Such offerings often help companies to attract greater institutional ownership interest, although they can also hinder upward price progress for a while. The number of top-rated funds owning its shares rose from 180 in Jun '15 to 266 in Dec '16, a reassuring sign. Its current Up/Down Volume ratio of 1.2 is an unbiased indication its shares have been under only slight accumulation over the past 50 days (I criteria). It currently has a Timeliness Rating of A and a Sponsorship rating of B.
The Dec '16 quarter marked its 9th consecutive earnings increase above the +25% minimum guideline (C criteria), and its annual earnings (A criteria) history has been good. Its small supply of only 48.4 millions shares (S criteria) in the public float can contribute to greater price volatility in the event of institutional buying or selling.
It remains up +34.8% since highlighted in yellow at $18.20 in the 10/10/16 mid-day report (read here). CSFL was first featured at $15.80 in the 5/27/16 mid-day report (read here).
Charts used courtesy of www.stockcharts.com

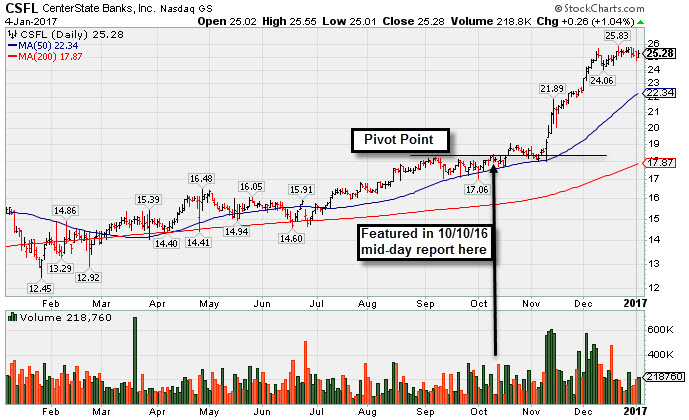
Bank Stock Perched Near Record Highs After Considerable Rally - Wednesday, January 4, 2017
Centerstate Banks Inc (CSFL +$0.26 or +1.04% to $25.28) has been stubbornly holding its ground near all-time highs, very extended from any sound base. Its 50-day moving average (DMA) line ($22) defines near-term support above prior highs in the $19 area. It has risen +38.9% since highlighted in yellow with new pivot point cited based on its 9/08/16 high plus 10 cents in the 10/10/16 mid-day report (read here). It rallied further and stubbornly held its ground since last shown in this FSU section on 12/02/16 with an annotated graph under the headline, "Very Extended From Base Following Additional Gains on Volume". CSFL was first featured at $15.80 in the 5/27/16 mid-day report (read here).
The Sep '16 quarter marked its 8th consecutive earnings increase above the +25% minimum guideline (C criteria), and its annual earnings (A criteria) history has been good. Its small supply of only 46.1 millions shares (S criteria) in the public float can contribute to greater price volatility in the event of institutional buying or selling.
The number of top-rated funds owning its shares rose from 180 in Jun '15 to 259 in Sep '16, a reassuring sign. Its current Up/Down Volume ratio of 2.2 is an unbiased indication its shares have been under only slight accumulation over the past 50 days (I criteria).
Charts used courtesy of www.stockcharts.com

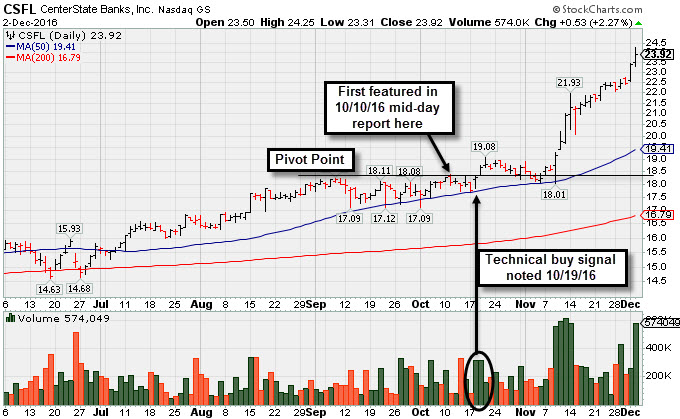
Very Extended From Base Following Additional Gains on Volume - Friday, December 2, 2016
Centerstate Banks Inc (CSFL +$0.53 or +2.27% to $23.92) hit another new all-time high today, getting very extended from any sound base. Its 50-day moving average (DMA) line and prior highs define near-term support in the $19 area. CSFL was last shown in this FSU section on 11/11/16 with an annotated graph under the headline, "Extended From Base After Volume Driven Gains".
It has risen +31.4% since first highlighted in yellow with new pivot point cited based on its 9/08/16 high plus 10 cents in the 10/10/16 mid-day report (read here). Subsequent volume-driven gains for new highs (N criteria) triggered a proper technical buy signal on 10/19/2016 as it was noted - "Hit a new 52-week high with today's gain above its pivot point backed by +91% above average volume triggering a technical buy signal under the fact-based investment system's guidelines."
The Sep '16 quarter marked its 8th consecutive earnings increase above the +25% minimum guideline (C criteria), and its annual earnings (A criteria) history has been good. Its small supply of only 46.1 millions shares (S criteria) in the public float can contribute to greater price volatility in the event of institutional buying or selling.
The number of top-rated funds owning its shares rose from 180 in Jun '15 to 255 in Sep '16, a reassuring sign. Its current Up/Down Volume ratio of 2.3 is an unbiased indication its shares have been under only slight accumulation over the past 50 days (I criteria).
Charts used courtesy of www.stockcharts.com

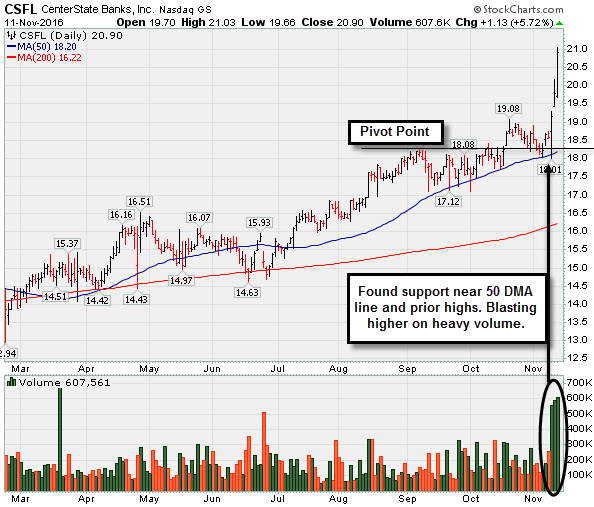
Extended From Base After Volume Driven Gains - Friday, November 11, 2016
Centerstate Banks Inc (CSFL +$1.13 or +5.72% to $20.90) hit yet another new high with today's 3rd consecutive volume-driven gain, getting more extended from any sound base. Its 50-day movingb average (DMA) line and prior highs define near-term support in the $18 area.
CSFL was last shown in this FSU section on 10/10/16 with an annotated graph under the headline, "Challenged 52-Week High With Another Volume-Driven Gain", after highlighted in yellow with new pivot point cited based on its 9/08/16 high plus 10 cents in the earlier mid-day report. Subsequent volume-driven gains for new highs (N criteria) triggered a proper technical buy signal.
The Sep '16 quarter marked its 8th consecutive earnings increase above the +25% minimum guideline (C criteria), and its annual earnings (A criteria) history has been good. Its small supply of only 46.1 millions shares (S criteria) in the public float can contribute to greater price volatility in the event of institutional buying or selling.
The number of top-rated funds owning its shares rose from 180 in Jun '15 to 247 in Sep '16, a reassuring sign. Its current Up/Down Volume ratio of 1.5 is an unbiased indication its shares have been under only slight accumulation over the past 50 days (I criteria).
Charts used courtesy of www.stockcharts.com

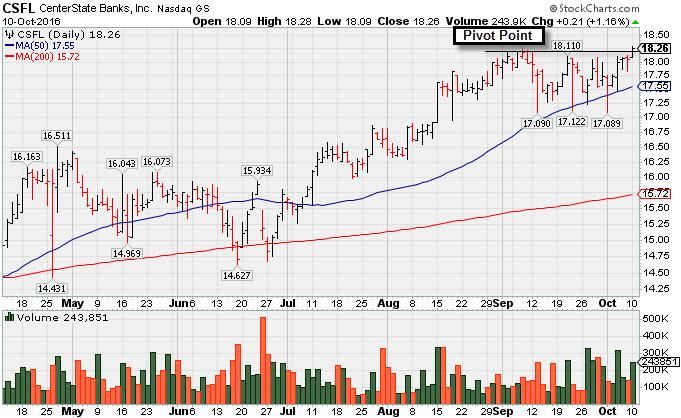
Challenged 52-Week High With Another Volume-Driven Gain - Monday, October 10, 2016
Centerstate Banks Inc (CSFL +$0.21 or +1.16% to $18.26) was highlighted in yellow with new pivot point cited based on its 9/08/16 high plus 10 cents in the earlier mid-day report. Disciplined investors will note that subsequent volume-driven gains for new highs (N criteria) are needed to trigger a proper technical buy signal before action may be justified under the fact-based investment system.
The Jun '16 quarter marked its 7th consecutive earnings increase above the +25% minimum guideline (C criteria), and its annual earnings (A criteria) history has been good. Its small supply of only 46 millions shares (S criteria) in the public float can contribute to greater price volatility in the event of institutional buying or selling.
CSFL was last shown in this FSU section on 5/27/16 with an annotated graph under the headline, "Forming Ideal Base and Fundamentals Are Favorable". It found support near its 200-day moving average (DMA) line then rebounded and rallied for new highs after dropped from the Featured Stocks list on 6/17/16.
The number of top-rated funds owning its shares rose from 180 in Jun '15 to 247 in Jun '16, a reassuring sign. Its current Up/Down Volume ratio of 1.1 is an unbiased indication its shares have been under only slight accumulation over the past 50 days (I criteria).
Charts used courtesy of www.stockcharts.com

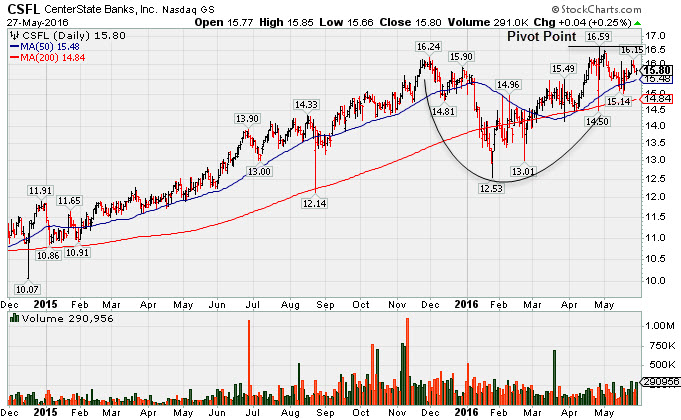
Forming Ideal Base and Fundamentals Are Favorable - Friday, May 27, 2016
Centerstate Banks Inc (CSFL +$0.04 or +0.25% to $15.80) was highlighted in yellow with pivot point cited based on its 4/27/16 high plus 10 cents. Disciplined investors will note that subsequent volume-driven gains for new highs (N criteria) are needed to trigger a proper technical buy signal before action may be justified under the fact-based investment system.
The Mar '16 quarter marked its 6th consecutive earnings increase above the +25% minimum guideline (C criteria), and its annual earnings (A criteria) history has been good. Its small supply of only 46 millions shares (S criteria) in the public float can contribute to greater price volatility in the event of institutional buying or selling.
The number of top-rated funds owning its shares rose from 180 in Jun '15 to 237 in Mar '16, a reassuring sign. Its current Up/Down Volume ratio of 1.4 is another unbiased indication its shares have been under accumulation over the past 50 days (I criteria). It formed a cup-with-handle type base since noted with caution in the 11/10/15 mid-day report - "Annual earnings (A criteria) history has not been a great match with the winning models of the fact-based investment system which call for strong and steady growth."
