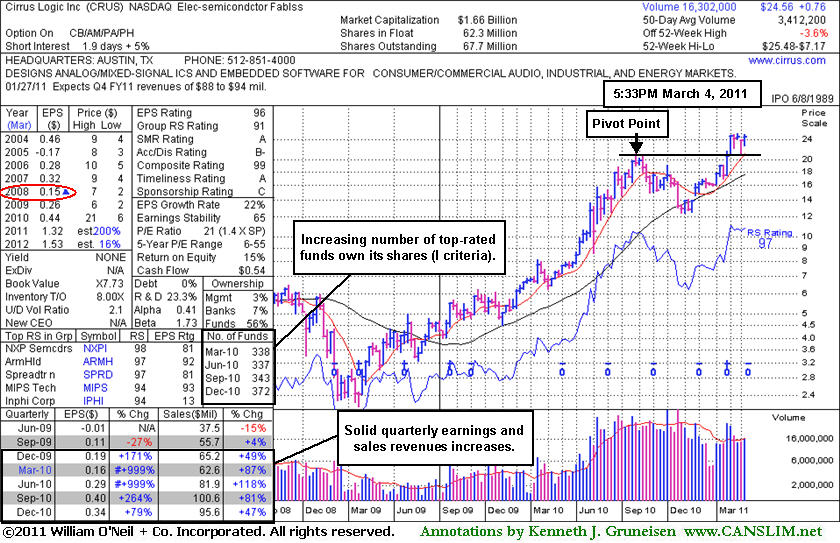
Strong Semiconductor Firm Attracting Top-Rated Funds - Friday, March 04, 2011
Cirrus Logic Inc (CRUS -$0.57 or -2.68% to $20.72) is now perched only -3.6% off its 52-week high after recently finding support above prior chart resistance and its 10-week moving average (WMA) line. Its recent low (2/23/11 low $21.17) and much earlier high close ($20.54 on 7/26/10) define chart support to watch along with its 50-day moving average (DMA) line.
After it was last analyzed in the Featured Stock Update (FSU) section on 1/28/11 with an annotated daily graph under the headline "No Overhead Supply After Reverse-Head-And-Shoulders Pattern
" it rallied with more volume-driven gains for new 52-week highs (N criteria). One may consider it a valid secondary buy point to accumulate shares between a stock's first test (after a sound technical breakout) of its 10 WMA line anywhere up to 5% above its latest high ($25.48 X 1.05 = $26.75). In this case, a close look at its weekly graph below shows that CRUS did not quite pull back enough to touch the 10 WMA line, yet it appears to be building a bullish base-on-base type pattern. Always limit losses by selling if a stock ever falls more than -7% from your purchase price.The number of top-rated funds owning its shares gradually rose from 338 in Mar '10 to 372 in Dec '10. Its current Up/Down Volume Ratio of 2.1 also provides an unbiased indication of institutional (I criteria) accumulation. CRUS found support near its 200-day moving average (DMA) line during its deep consolidation since it was noted in the mid-day report on 7/23/10 with cautionary remarks. Quarterly sales revenues and earnings increases in quarterly comparisons versus the year ago period have shown impressive increases. One concern is that its annual earnings (A criteria) history was up and down in the past (see red oval around FY '08), but earnings came in strong for FY '09 and '10.
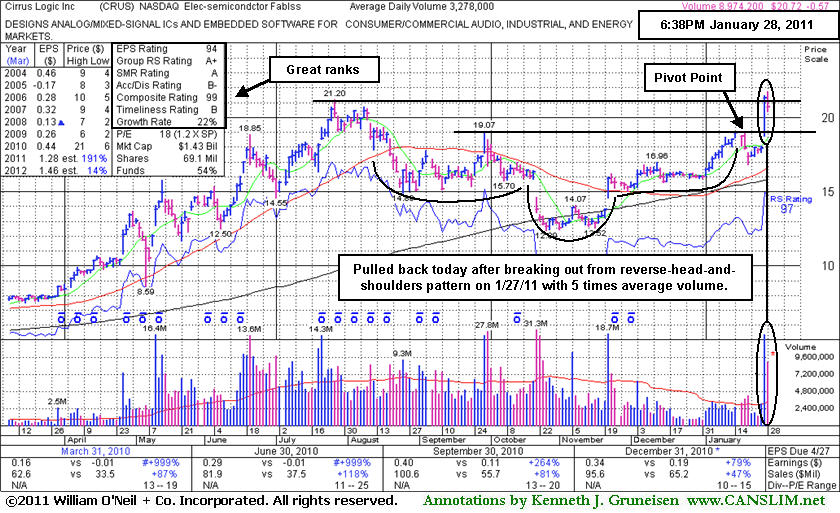
No Overhead Supply After Reverse-Head-And-Shoulders Pattern - Friday, January 28, 2011
Cirrus Logic Inc (CRUS -$0.57 or -2.68% to $20.72) reversed into the red while churning heavy volume today, yet it was featured in the mid-day breakouts report when its color code was changed to yellow and a pivot point was cited based on its 1/19/11 high plus ten cents. A considerable breakout gain on 1/27/11 allowed it to convincingly blast from a bullish reverse-head-and-shoulders type pattern with more than 5 times average volume and hit new 52-week highs (N criteria), triggering a technical buy signal. The number of top-rated funds owning its shares gradually rose from 338 in Mar '10 to 349 in Dec '10. Its current Up/Down Volume Ratio of 2.1 provides an unbiased indication of institutional (I criteria) accumulation.
CRUS found support near its 200-day moving average (DMA) line during its deep consolidation since noted in the mid-day report on 7/23/10 with cautionary remarks. Quarterly sales revenues and earnings increases in quarterly comparisons versus the year ago period have shown impressive increases. Its annual earnings (A criteria) history was up and down in the past, but came in strong for FY '09 and '10.