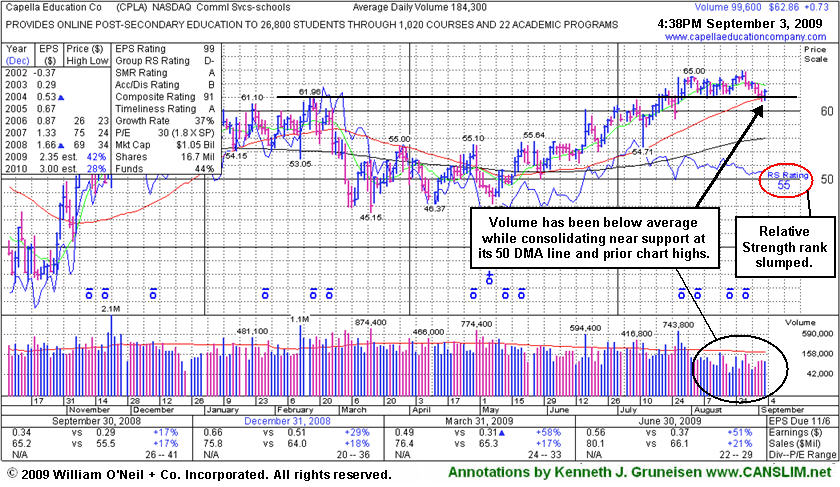
Healthy Consolidation Above Prior Highs And 50-Day Average - Thursday, September 03, 2009
Capella Education Co. (CPLA +$0.66 or +1.05% to $62.79) found support near its 50-day moving average (DMA) line today. Its current consolidation resembles a bullish base-on-base type pattern while trading in a tight range on light volume near its pivot point, within close striking range of its 52-week high. Volume has been mostly quiet during its healthy consolidation, and there is virtually no resistance due to overhead supply. Its gap up gain on 7/28/09 with more than +50% above average volume helped it rise above its pivot point and trigger a technical buy signal. However, since first featured in yellow in the 7/09/09 Mid-Day BreakOuts Report (read here) its Relative Strength rank has slumped to a mediocre 65 (see the red circle), under the 80+ guideline, a sign that it has recently been lagging. By comparison, Bank Of America Corp (BAC +3.50%) is now -57.4% off its 52 week high, yet it currently is being rewarded with a 92 Relative Strength rank. This anomaly is due to the fact the newspapers' relative strength ranking system puts greater emphasis on the most recent 6 month period, and CPLA has moved mostly sideways in that time frame, meanwhile many badly beaten down stocks like BAC have rallied back considerably from their extreme lows in the past 6 months.
This is a strong performing leader in the Commercial Services-Schools Group. While the group has shown some leadership, concern is raised by the fact it currently has a D- for a Relative Strength Rating. CPLA's small supply of only 13.9 million shares in the float could contribute to greater price volatility in the event of institutional accumulation or distribution. The number of top-rated funds owning an interest rose from 91 in Sept '08, to 139 as of June '09, which is reassuring with respect to the I criteria. It has a very good earnings history that satisfies the C & A criteria.
A follow through day of constructive gains with heavier volume from the major averages, and from this issue, would be very crucial reassurances confirming heavy buying demand from the large institutional investors - demand which can fuel a sustained rally. Meanwhile, subsequent deterioration back under its pivot point (based on the old $61.96 high of February 17, 2009) would negate its breakout, raise concerns, and trigger a technical sell signal.
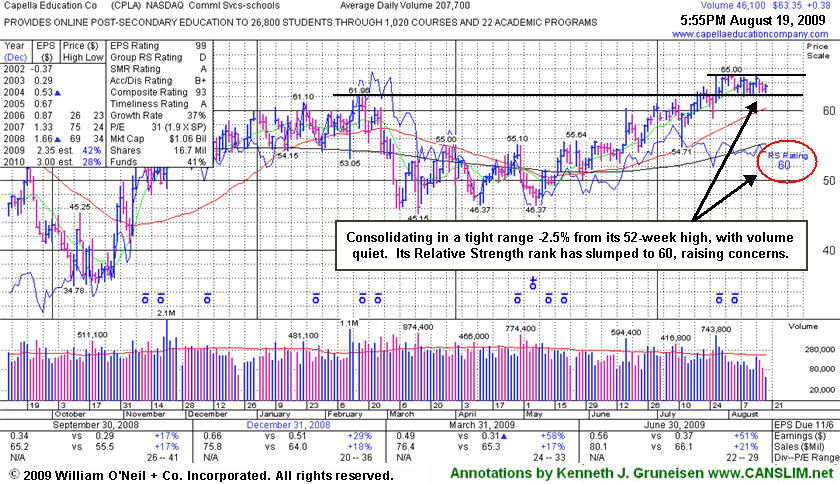
Relative Strength Rank Emphasizes Recent Underperformance - Wednesday, August 19, 2009
Capella Education Co. (CPLA +$0.38 or +0.60% to $63.35) is consolidating above prior chart highs now which are likely to serve as a support level. Just -2.5% from its 52-week high, volume has been mostly quiet during its healthy consolidation, and there is virtually no resistance due to overhead supply. Its gap up gain on 7/28/09 with more than +50% above average volume helped it rise above its pivot point and trigger a technical buy signal. However, since first featured in yellow in the 7/09/09 Mid-Day BreakOuts Report (read here) its Relative Strength rank has slumped to a mediocre 60 (see the red circle), under the 80+ guideline, a sign that it has recently been lagging. By comparison, Bank Of America Corp (BAC -0.89%) is now -57.6% off its 52 week high, yet it currently is being rewarded with a 90 Relative Strength rank. This anomaly is due to the fact the newspapers' relative strength ranking system puts greater emphasis on the most recent 6 month period, and CPLA has moved mostly sideways in that time frame, meanwhile many badly beaten down stocks like BAC have rallied back considerably from their extreme lows in the past 6 months.
This is a strong performing leader in the Commercial Services-Schools Group. While the group has shown some leadership, concern is raised by the fact it currently has a D for a Relative Strength Rating. CPLA's small supply of only 13.9 million shares in the float could contribute to greater price volatility in the event of institutional accumulation or distribution. The number of top-rated funds owning an interest rose from 91 in Sept '08, to 136 as of June '09, which is reassuring with respect to the I criteria. It has a very good earnings history that satisfies the C & A criteria.
A follow through day of constructive gains with heavier volume from the major averages, and from this issue, would be very crucial reassurances confirming heavy buying demand from the large institutional investors - demand which can fuel a sustained rally. Meanwhile, subsequent deterioration back under its pivot point would negate its breakout, raise concerns, and trigger a technical sell signal.
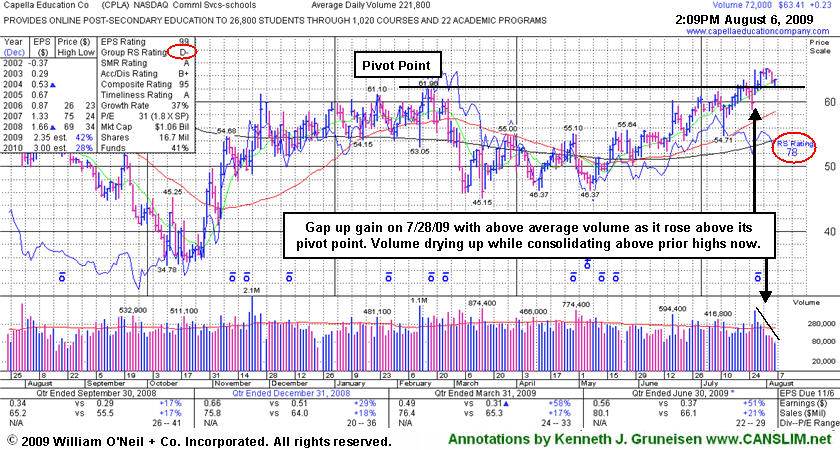
Volume Drying Up While Consolidating Above Prior Highs - Thursday, August 06, 2009
Capella Education Co. (CPLA +$0.21 or +0.33% to $63.39) is consolidating above prior chart highs now which are likely to serve as a support level. Volume has been drying up during its healthy consolidation since its gap up gain on 7/28/09 with more than +50% above average volume helped it rise above its pivot point and trigger a technical buy signal. This is a strong performing leader in the Commercial Services-Schools Group. Its small supply of only 13.9 million shares in the float could contribute to greater price volatility in the event of institutional accumulation or distribution. The number of top-rated funds owning an interest rose from 91 in Sept '08, to 134 as of March '09, which is reassuring with respect to the I criteria. It has a very good earnings history that satisfies the C & A criteria.
Since first featured in yellow in the 7/09/09 Mid-Day BreakOuts Report (read here) its Relative Strength rank has slumped under the 80+ guideline, a sign that it has recently been lagging. The group has shown some leadership, yet currently has a D- for a Relative Strength Rating. (See the red circles.)
A follow through day of constructive gains with heavy volume would be a reassuring confirmation of heavy buying demand from the large institutional investors - demand which can fuel a sustained rally. Meanwhile, subsequent deterioration back under its pivot point would negate its breakout, raise concerns, and trigger a technical sell signal.
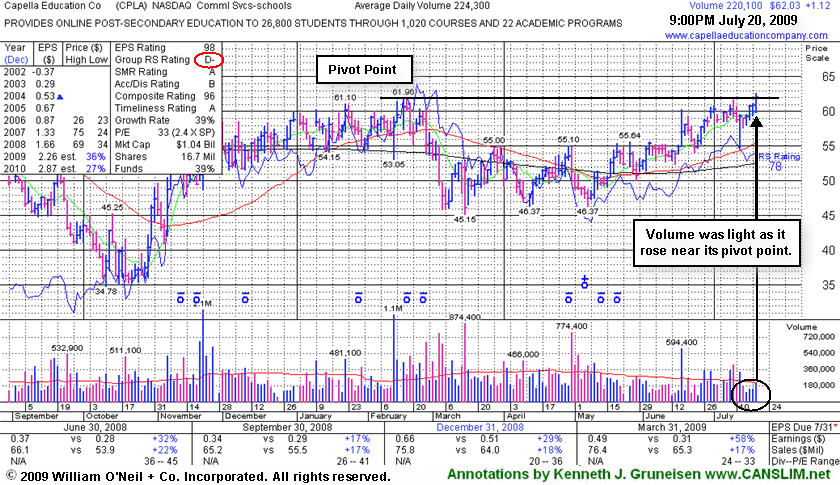
Volume Is Needed To Confirm Institutional Demand - Monday, July 20, 2009
Capella Education Co. (CPLA +$1.12 or +1.81% to $62.03) hit a new 52-week high today with a 4th consecutive gain on only average volume, closing just shy of its pivot point. It has not yet triggered a technical buy signal since first featured in yellow in the 7/09/09 Mid-Day BreakOuts Report (read here). The group has shown some leadership, yet currently has a D- for a Relative Strength Rating. CPLA is a high-ranked leader in the Commercial Services-Schools Group. Its small supply of only 13.9 million shares in the float could contribute to greater price volatility in the event of institutional accumulation or distribution. The number of top-rated funds owning an interest rose from 91 in Sept '08, to 129 as of March '09, which is reassuring with respect to the I criteria. It has a very good earnings history that satisfies the C & A criteria, while recent quarters showed steady sales revenues increases in the +17-18% range.
Volume should be at least +50% above average behind a breakout under the investment system's guidelines. Heavy volume behind gains is a critical sign of heavy buying demand from the large institutional investors - demand which can fuel a sustained rally.
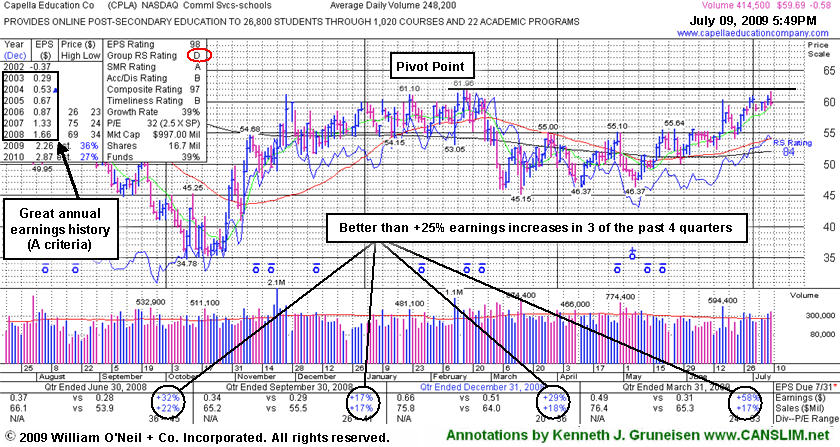
Education Group Leader Near 52-Week High - Thursday, July 09, 2009
A classic example of the success enjoyed by many CANSLIM.net readers usually starts when an investor reads a CANSLIM.net report and buys a featured stock before it has risen above the pivot point by greater than 5%. After a stock breaks out above its pivot point, there is only a +5% window that investors have to purchase the stock under the proper guidelines. Once a stock rises above the "maximum buy price" the risk of a shake out balloons, meaning that even a normal retracement in the stock might force you to employ the 7-8% loss cutting rule. Much can be told by the stock's daily action in the weeks and months that follow a breakout. Typically, a light volume and orderly pullback suggests that the bulls remain in control. However, high volume pullbacks that violate support paint a totally different picture.
Capella Education Co. (CPLA -$0.58 or -0.96% to $59.69) negatively reversed for a loss with above average volume after it was featured in yellow in today's mid-day report (read here). It has quietly been rallying in recent weeks, and is now perched within -5% of its 52-week high. The group has shown some leadership, yet currently has a D for a Relative Strength Rating (see red circle). CPLA is a high-ranked leader in the Commercial Services-Schools Group. Its small supply of only 13.9 million shares in the float could contribute to greater price volatility in the event of institutional accumulation or distribution. The number of top-rated funds owning an interest rose from 91 in Sept '08, to 129 as of March '09, which is reassuring with respect to the I criteria. It has a very good earnings history that satisfies the C & A criteria, while recent quarters showed steady sales revenues increases in the +17-18% range.
Leader Teaches Lessons On How It Is Done - Tuesday, November 20, 2007
A classic example of the success enjoyed by many CANSLIM.net readers usually starts when an investor reads a CANSLIM.net report and buys a featured stock before it has risen above the pivot point by greater than 5%. After a stock breaks out above its pivot point, there is only a +5% window that investors have to purchase the stock under the proper guidelines. Once a stock rises above the "maximum buy price" the risk of a shake out balloons, meaning that even a normal retracement in the stock might force you to employ the 7-8% loss cutting rule. Much can be told by the stock's daily action in the weeks and months that follow a breakout. Typically, a light volume and orderly pullback suggests that the bulls remain in control. However, high volume pullbacks that violate support paint a totally different picture.
Capella Education Co. (CPLA +$0.36 or +0.52% to $69.73) closed with a small gain on about average volume as this high-ranked leader continued consolidating well above its 50-day moving average (DMA) line. Investors who want to be protective of hard-earned profits might watch for a violation of the upward trendline connecting its recent chart lows as an early technical sell signal. CPLA was first featured on Wednesday, August 22, 2007 in the CANSLIM.net Mid Day Breakouts Report (read here) with a $47.62 pivot point and a $50.00 maximum buy price. Capella Education triggered a technical buy signal on August 17, 2007, but the "M" criteria was not conducive for buying stocks at that time. However, a week later, on August 29, 2007, the major averages scored a proper follow-through day which confirmed the market's last constructive rally. At the time, CPLA was trading above its maximum buy price and was considered too extended from its base to be considered buyable under the proper guidelines. Patience was rewarded for those who waited, because in early September the stock quietly pulled back and found support near its pivot point, offering investors a perfect chance to accumulate this strong leader within the proper guidelines. It was encouraging to see the bulls promptly show up and defend support, which helped send the stock back above its maximum buy price on September 11, 2007. One week later, on September 18, 2007, the Federal Reserve cut rates for the first time in several years. The market, and this stock, enjoyed more healthy gains. CPLA spent much of October consolidating well above its 50 DMA line, where it continues to trade, which is a very strong sign considering the recent weakness in so many stocks and the major averages. This is another great example of the success enjoyed by CANSLIM.net members. Investors should keep CPLA on an active watchlist while waiting for the market to enter a new confirmed rally.
C A N S L I M | StockTalk | News | Chart | SEC | Zacks Reports | ![]()
![]()
![]()

View all notes | Alert me of new notes | CANSLIM.net Company Profile
Pullback Offered A Chance To Avoid Chasing Recent Breakout - Monday, September 17, 2007
A classic example of the success enjoyed by many CANSLIM.net readers usually starts when an investor reads a CANSLIM.net report and buys a featured stock before it has risen above the pivot point by greater than 5%. After a stock breaks out above its pivot point, there is only a +5% window that investors have to purchase the stock under the proper guidelines. Once a stock rises above the "maximum buy price" the risk of a shake out balloons, meaning that even a normal retracement in the stock might force you to employ the 7-8% loss cutting rule. Much can be told by the stock's daily action in the weeks and months that follow a breakout. Typically, a light volume and orderly pullback suggests that the bulls remain in control. However, high volume pullbacks that violate support paint a totally different picture.
Capella Education Co. (CPLA +$0.16 or +0.31% to $51.34) closed slightly higher on below average volume as it continued to consolidate its recent gains. CPLA was first featured on Wednesday, August 22, 2007 in the CANSLIM.net Mid Day Breakouts Report (read here) with a $47.62 pivot point and a $50.00 maximum buy price. Capella Education had recently triggered a technical buy signal but the "M" criteria was not conducive for buying stocks. A week later, on August 29, 2007, the major averages scored a proper follow-through day which confirmed the markets latest rally attempt. However, at the time, CPLA was trading above its maximum buy price and was considered too extended to be considered buyable under the proper guidelines. Patience was rewarded for those who waited because earlier this month, the stock pulled back and found support near its pivot point. The bulls promptly showed up and defended support, then the stock rallied back above its maximum buy price. Volume has dried up over the past few weeks as CPLA quietly consolidated, which is constructive action, since it allows the 50-day moving average (DMA) line to catch up to the price of the stock. Recently, CPLA appeared in on August 24, 2007 in the CANSLIM.net After Market Update (read here), discussing its strong attributes.
C A N S L I M | StockTalk | News | Chart | ![]() DGO | SEC | Zacks Reports
DGO | SEC | Zacks Reports

View all notes | Alert me of new notes | CANSLIM.net Company Profile
CPLA - 7 Stocks That Should Now Be On Your Watch List - Sunday, August 26, 2007
|
Capella Education Company |
||
|
Ticker Symbol: CPLA (NASDAQ) |
Industry Group: Commercial Services- Schools |
Shares Outstanding: 16,700,000 |
|
Price: $48.47 4:00PM ET 8/24/2007 |
Day's Volume: 131,000 8/24/2007 |
Shares in Float: 10,400,000 |
|
52 Week High: $52.12 8/22/2007 |
50-Day Average Volume: 191,200 |
Up/Down Volume Ratio: 1.0 |
|
Pivot Point: $47.62 7/3/2007 high plus .10 |
Pivot Point +5% = Max Buy Price: $50.00 |
Web Address: http://www.capellaeducationcompany.com/ |
C A N S L I M | StockTalk | News | Chart | SEC | Zacks Reports

CANSLIM.net Company Profile: Capella Education Company, through its wholly owned subsidiary, Capella University, provides online post-secondary education services in the United States. It offers various doctoral, bachelor's, and master's degree programs in the health and human services, business management and technology, and education disciplines primarily to working adults. As of December 31, 2006, the company offered approximately 760 courses and 13 academic programs with 75 specializations at the graduate and undergraduate levels to approximately 18,000 learners. Capella Education Company was founded in 1991 and is headquartered in Minneapolis, Minnesota. It sports a strong Earnings Per Share (EPS) rating of a 95 and a very healthy Relative Strength (RS) rating of 96. The company has managed to increase its earnings by above the +25% guideline in each of the past four quarterly comparisons versus the year earlier, satisfying the "C" criteria. CPLA resides in the very strong Commerical Services-Schools group which is currently ranked 15th out of the 197 Industry Groups covered in the paper, placing it in the much preferred top quartile and satisfying the "L" criteria.
What to Look For and What to Look Out For: Since CPLA has already risen above its pivot point with gains backed by the necessary volume to trigger a proper technical buy signal, it would be very encouraging to see it retrace on light volume back toward support near prior chart highs in the $47 area. However, any breakdown leading to a close back into its prior base would raise concerns. Its 50-day moving average (DMA) line would then be the next nearby support level of importance chart-wise, and violations could trigger technical sell signals. Avoid chasing it above its maximum buy price of $50.00, where it would be too extended from a sound price base. Waiting for a proper follow-through day in the broader market coupled (the "M" criteria) with a light volume pullback in this stock could allow patient investors a better chance to accumulate shares within proper guidelines. As always, it is of the utmost importance to sell a stock if it drops 7-8% below your purchase price.
Technical Analysis: On August 17, 2007, CPLA surged above its pivot point with the necessary volume to trigger a proper technical buy signal. It was encouraging to see CPLA continue advancing over the next couple of days even though the market is in a correction. The stock is currently pulling back toward a possible retest of support near its old chart highs and pivot point. As long as those levels are not breached, and the latest breakout is not negated, the stock is still considered a strong buy candidate once a proper follow-through day emerges. CPLA was first featured in the August 22nd, 2007 CANSLIM.net Mid Day Breakouts Report (read here) with a $47.62 pivot point and a $50.00 maximum buy price.
Recent Breakout Pulling Back In Healthy Fashion - Friday, August 24, 2007
Statistically, about 40% of winning stocks will pull back after breaking out. In other words, it is not uncommon for stocks to pullback and retest support near their pivot point after breaking out. It is important to see the bulls show up and offer support at or above the pivot point. This may offer investors a chance to increase their exposure before the stock continues advancing. However, an important caveat is that volume should contract as the stock pulls back towards its pivot point. Heavy volume behind losses can be cause for concern, especially if the stock does not find support at its pivot point. Whenever a recent breakout is completely negated by a loss that leads to a close back in the prior base, this is construed as a technical sell signal and a sign that the bears are regaining control.
Capella Education Co. (CPLA -$0.91 or -1.84% to $48.47) pulled back on below average volume Friday. This stock was first featured on Wednesday, August 22, 2007 in the CANSLIM.net Mid Day Breakouts Report (read here) with a $47.62 pivot point and a $50.00 maximum buy price. Capella Education sports a very healthy Earnings Per Share (EPS) rating of 95. It is also encouraging to see the company earn a very healthy Relative Strength (RS) rating of 97. The company has managed to increase its earnings by above the +25% guideline in each of the past four quarterly comparisons versus the year earlier, satisfying the "C" criteria. CPLA resides in the Commercial Services- School group which is currently ranked 16th of out the 197 Industry Groups covered in the paper, placing it in the much preferred top quartile. On August 17, 2007, CPLA surged above its pivot point with the necessary volume to trigger a proper technical buy signal. It was encouraging to see CPLA continue advancing over the next couple of days even though the market is in a correction. The stock is currently pulling back toward a possible retest of support near its old chart highs and pivot point. As long as those levels are not breached, and the latest breakout is not negated, the stock is still considered a strong buy candidate once a proper follow-through day emerges. Always limit losses per the 7-8% sell rule, and never hold a stock if it falls more than that much from your purchase price. Also, keep in mind that satisfying the "M" criteria calls for being sure the major averages first produce a proper follow-through day before initiating any new positions. Market conditions need to show technical improvement and leadership (new highs) must expand, otherwise odds are stacked against investors for now.
C A N S L I M | StockTalk | News | Chart | SEC | Zacks Reports

View all notes | Alert me of new notes | CANSLIM.net Company Profile