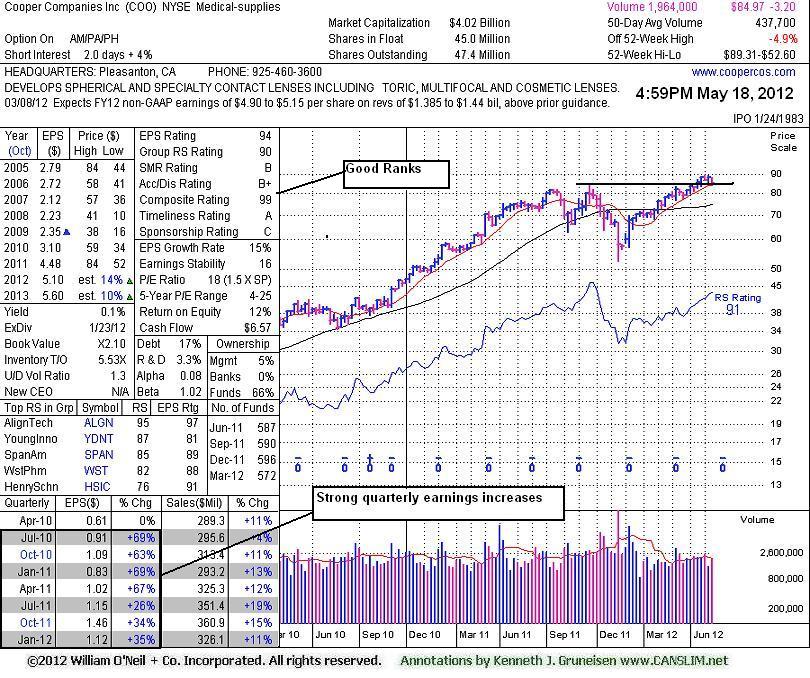
Weak Market Environment Weighs On All Stocks - Friday, May 18, 2012
Cooper Companies Inc (COO -$0.78 or -0.91% to $84.97) fell for a 6th consecutive loss today on ever-increasing volume. It is consolidating above prior highs in the $83-84 area and above its 50-day moving average (DMA) line, important near-term support. A subsequent violation may trigger a worrisome sell signal.
COO's last appearance in this FSU section with an annotated graph was on 3/09/12 under the headline, "Gap Up Gain With 4 Times Average Volume", when it was breaking out of a near 6-month cup-with-handle type base pattern. Afterward it stayed above its 50 DMA line and continued higher.
The number of top-rated funds owning its shares rose from 532 in Mar '11 to 572 in Mar '12, a reassuring sign concerning the I criteria. Its Up/Down Volume Ratio of 1.3 also offers an unbiased indication its shares have recently been under accumulation. It small supply of only 45.0 million shares (S criteria) in the public float can contribute to great price volatility in the event of institutional buying or selling activity. Recent quarters showed earnings increases above the +25% minimum guideline satisfying the C criteria of the fact-based investment system. Its annual earnings (A criteria) growth has been good since a downturn in FY '06 & '07.
Keep in mind that 3 out of 4 stocks tend to go in the direction of the major averages (M criteria). Especially during a market correction, investors mush watch out for technical sell signals which may alert them to reduce market exposure and raise safe cash.
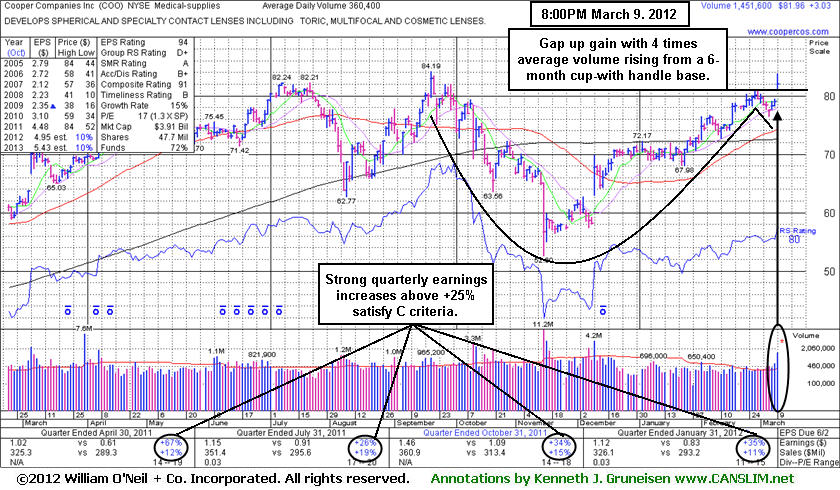
Gap Up Gain With 4 Times Average Volume - Friday, March 09, 2012
Cooper Companies Inc (COO +$3.03 or +3.84% to $81.96) gapped up today for a solid gain backed by 4 times average volume, breaking out of a near 6-month cup-with-handle type base pattern. Technically the action triggered a buy signal, although it ended in the lower half of its intra-day trading range. Its was featured in yellow in the mid-day report (read here) with pivot point cited based on its 2/29/12 high plus 10 cents. It is challenging its 52-week high and faces very little remaining resistance due to overhead supply. Subsequent volume-driven gains into new high territory could help confirm today's bullish action as the beginning of a more meaningful and sustained advance. As always, disciplined investors limit losses by selling if ever any stock falls more than -7% from their purchase price.
One concern is that its 80 Relative Strength Rank is at the minimum for buy candidates under the fact-based system. The Relative Strength Line (jagged blue line) was also plotted much higher back on the left side of its base. Odds are usually better for a candidate when its Relative Strength Line leads the share price by rising into new high territory first.
The number of top-rated funds owning its shares rose from 532 in Mar '11 to 609 in Dec '11, a reassuring sign concerning the I criteria. Its Up/Down Volume Ratio of 1.3 also offers an unbiased indication its shares have recently been under accumulation. It small supply of only 45.3 million shares (S criteria) in the public float can contribute to great price volatility in the event of institutional buying or selling activity. Recent quarters showed earnings increases above the +25% minimum guideline satisfying the C criteria of the fact-based investment system. Its annual earnings (A criteria) growth has been good since a downturn in FY '06 & '07. Went through a deep consolidation below its 200 DMA line then rebounded since last noted in the 10/12/11 mid-day report - "It survived but failed to impress since dropped from the Featured Stocks list on 3/29/05."