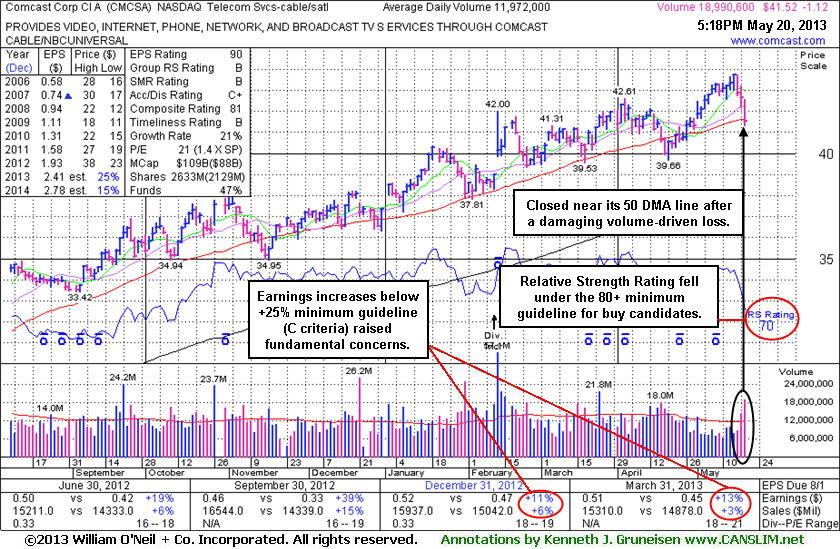
Following Fundamental Flaws Technical Weakness Developing - Monday, May 20, 2013
Comcast Corp Cl A (CMCSA -$1.12 or -2.63% to $41.52) slumped to a close just below its 50-day moving average line today with a damaging loss backed by above average volume. Despite fundamental concerns recently noted it had been holding its ground near its 52-week high with volume totals cooling in recent weeks. The loss today on heavier volume hinted that at least some institutional investors were heading for the exit. Its Relative Strength Rating has slumped to 70, well below the 80+ minimum guideline for buy candidates. It may likely find support near its short-term average, however, due to fundamental and technical concerns it will be dropped from the Featured Stocks list tonight.The Telecom Services - Cable/Satellite firm's annual earnings (A criteria) history has been strong and leadership from other firms in the industry group is a reassuring sign concerning the L criteria. The number of top-rated funds owning its shares rose from 1,916 in Jun '11 to 2,303 in Mar '13, a reassuring sign concerning the I criteria. Its huge supply of 2.097 billion shares in the float could make it less likely to be a great sprinter, meanwhile, the S criteria calls for investors to usually look at small-cap or mid-cap companies. Comcast recently reported earnings +13% on +3% sales revenues for the Mar '13 quarter, marking its 2nd consecutive quarterly comparison with earnings well below the +25% minimum guideline (C criteria). It was last shown in this FSU section on 4/16/13 with an annotated graph under the headline, "Fundamental Concerns Remain While Hovering At Highs". Disciplined investors following the fact-based system would likely choose a candidate showing strength and solid earnings increases over one which appears to be faltering.
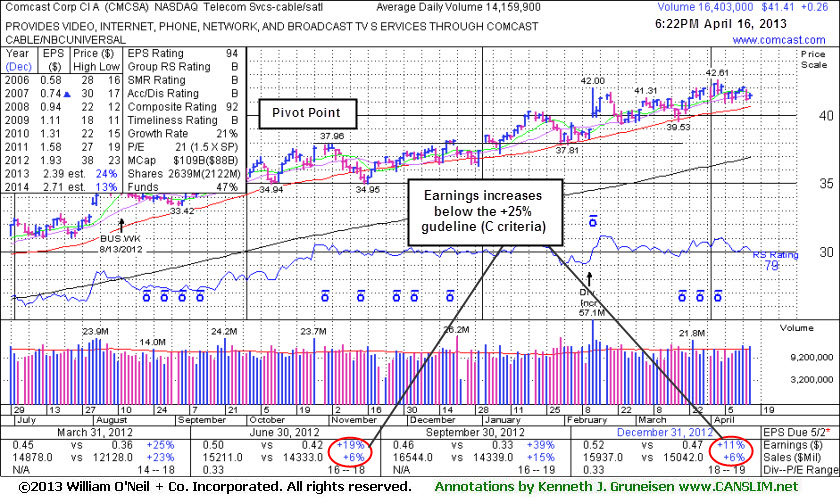
Fundamental Concerns Remain While Hovering At Highs - Tuesday, April 16, 2013
Comcast Corp Cl A (CMCSA +$0.26 or +0.63% to $41.41) is hovering near its 52-week high after finding recent support and rallying from its 50-day moving average (DMA) line. Its Relative Strength Rating has slumped to 79, just under the 80+ guideline for buy candidates. Fundamental concerns remain since it reported earnings +11% on +6% sales revenues for the Dec '12 quarter, below the +25% minimum guideline (C criteria). It was last shown in this FSU section on 3/19/13 with an annotated graph under the headline, "Weakening Fundamental and Technical Characteristics a Concern", while testing support at its 50-day moving average (DMA) line and enduring mild distributional pressure.
The high-ranked Telecom Services - Cable/Satellite firm's annual earnings (A criteria) history has been strong and leadership from other firms in the industry group is a reassuring sign concerning the L criteria. The number of top-rated funds owning its shares rose from 1,916 in Jun '11 to 2,273 in Mar '13, a reassuring sign concerning the I criteria. Its huge supply of 2.097 billion shares in the float could make it less likely to be a great sprinter, meanwhile, the S criteria calls for investors to usually look at small-cap or mid-cap companies.
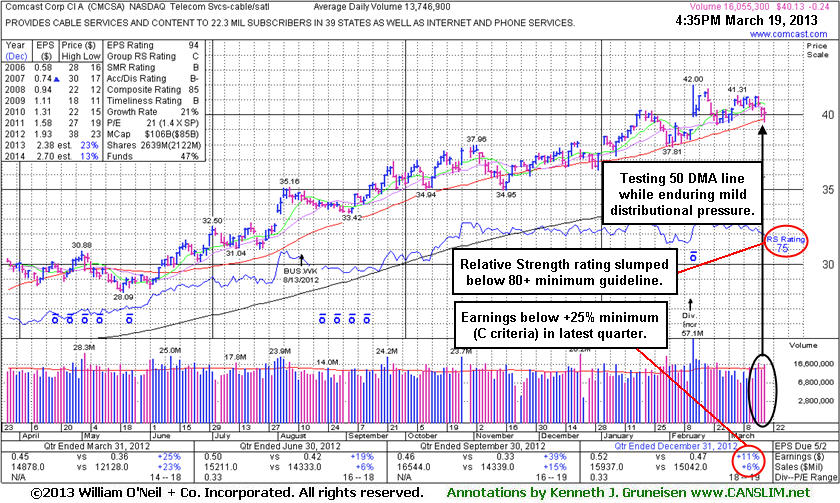
Weakening Fundamental and Technical Characteristics a Concern - Tuesday, March 19, 2013
Comcast Corp Cl A (CMCSA -$0.24 or -0.59% to $40.13) is testing support at its 50-day moving average (DMA) line while enduring mild distributional pressure. A damaging violation would trigger a technical sell signal. Fundamental concerns remain since it reported earnings +11% on +6% sales revenues for the Dec '12 quarter, below the +25% minimum earnings guideline (C criteria). Its Relative Strength Rating has also slumped to 75 (see red circle) below the 80+ minimum guideline for buy candidates. Prior highs in the $38 area help define chart support to watch below its 50 DMA line. Since it was last shown in this FSU section on 2/19/13 with an annotated graph under the headline, "Following Sub Par Earnings Bullish Action Has Continued", the subsequent gains it has posted lacked great volume conviction, and the losses it has tallied have been marked by above average volume in more than a few instances.The high-ranked Telecom Services - Cable/Satellite firm's annual earnings (A criteria) history has been strong and leadership from other firms in the industry group is a reassuring sign concerning the L criteria. The number of top-rated funds owning its shares rose from 1,916 in Jun '11 to 2,274 in Dec '12, a reassuring sign concerning the I criteria. Its huge supply of 2.097 billion shares in the float could make it less likely to be a great sprinter, meanwhile, the S criteria calls for investors to usually look at small-cap or mid-cap companies.
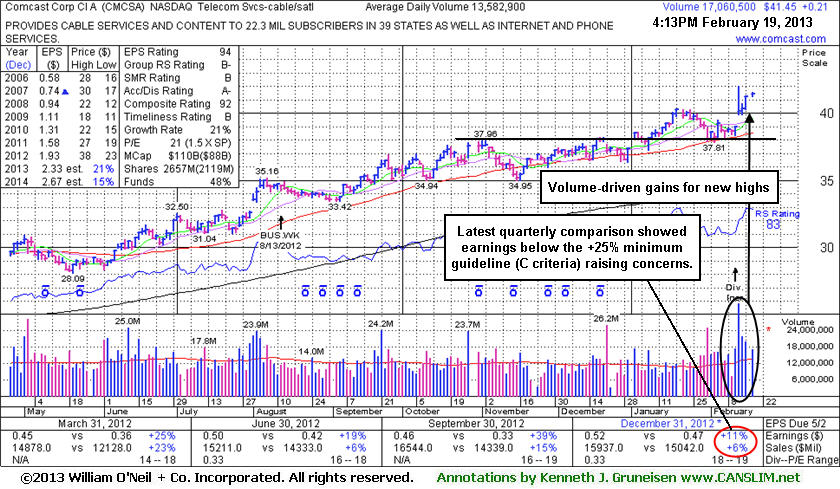
Following Sub Par Earnings Bullish Action Has Continued - Tuesday, February 19, 2013
Comcast Corp Cl A (CMCSA +$0.21 or +0.51% to $41.45) traded up today near its 52-week high hit during a streak of 5 consecutive gains backed by above average volume. It remains free to rally unhindered by resistance due to overhead supply, and patient investors may give it the benefit of the doubt while watching out for technical sell signals, seeing if it may go on to tally more climactic gains. Recently the company reported earnings +11% on +6% sales revenues (see red circle) for the Dec '12 quarter, below the +25% minimum earnings guideline (C criteria), raising fundamental concerns, yet bullish action has continued. It was last shown in this FSU section on 1/29/13 with an annotated graph under the headline "Distributional Pressure After Wedging Higher Following Breakout". It recently found support after dipping near its 50-day moving average (DMA) line again. Closely coinciding with that important short-term average, the prior highs in the $38 area also helped define chart support to watch.The high-ranked Telecom Services - Cable/Satellite firm has earned good ranks. Its annual earnings (A criteria) history has been strong and leadership from other firms in the industry group is a reassuring sign concerning the L criteria. The number of top-rated funds owning its shares rose from 1,916 in Jun '11 to 2,256 in Dec '12, a reassuring sign concerning the I criteria. Its huge supply of 2.097 billion shares in the float could make it less likely to be a great sprinter, meanwhile, the S criteria calls for investors to usually look at small-cap or mid-cap companies.
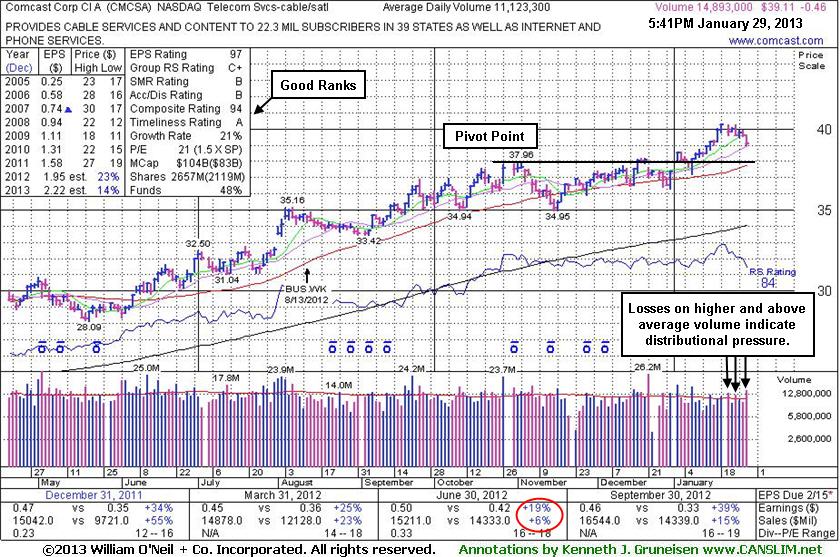
Distributional Pressure After Wedging Higher Following Breakout - Tuesday, January 29, 2013
Comcast Corp Cl A (CMCSA -$0.46 or -1.16% to $39.11) pulled back today for another small loss with above average volume. Recent action has been indicative of some mild distributional pressure, as illustrated on the annotated graph below. It is still perched only -2.9% off its 52-week high, however, and free to rally unhindered by resistance due to overhead supply. Its rally above its pivot point on 1/02/13 had sufficient volume to trigger a technical buy signal.Comcast wedged higher without great volume conviction behind gains since last shown in this FSU section on 1/11/13 with an annotated graph under the headline "Stalled After Latest Breakout Gain With Sufficient Volume". It had managed an impressive "positive reversal" on 1/08/13 for a gain on higher volume after dipping near its 50-day moving average (DMA) line intra-day. Closely coinciding with that important short-term average now, the prior highs in the $38 area help define chart support to watch on pullbacks.
The high-ranked Telecom Services - Cable/Satellite firm reported earnings +39% on +15% sales revenues for the Sep '12 quarter, above the fact-based investment system's +25% minimum guideline for the C criteria, a reassuring follow-up to the previously noted sub par quarter (see red circle). It has earned good ranks. Its annual earnings (A criteria) history has been strong and leadership from other firms in the industry group is a reassuring sign concerning the L criteria. The number of top-rated funds owning its shares rose from 1,916 in Jun '11 to 2,229 in Dec '12, a reassuring sign concerning the I criteria. Its huge supply of 2.097 billion shares in the float could make it less likely to be a great sprinter, meanwhile, the S criteria calls for investors to usually look at small-cap or mid-cap companies.
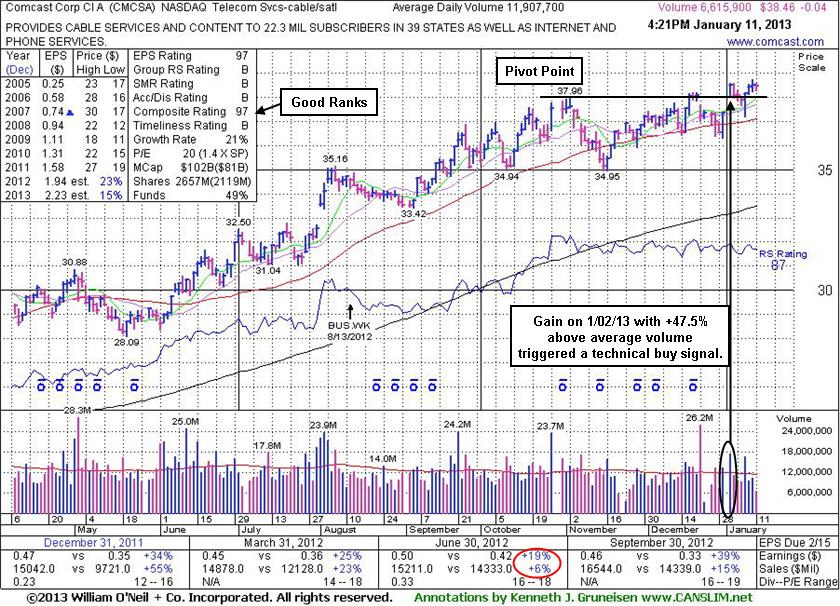
Stalled After Latest Breakout Gain With Sufficient Volume - Friday, January 11, 2013
Comcast Corp Cl A (CMCSA -$0.04 or -0.10% to $38.46) stalled and has been hovering near its 52-week high since its gain above its pivot point on 1/02/12 backed by +47.5% above average volume triggered a technical buy signal. No resistance remains due to overhead supply and it remains trading below its "max buy" level. It managed an impressive "positive reversal" on Tuesday for a gain on higher volume after dipping near its 50-day moving average (DMA) line intra-day. It was last shown in this FSU section on 12/27/12 with an annotated graph under the headline, "Found Support at 50-Day Average While Still Awaiting Breakout", when finishing in the upper half of its intra-day range after dipping below its 50-day moving average (DMA) line. It found prompt support near that important short-term average and it had been highlighted in yellow throughout December and repeatedly noted with caution - "Disciplined investors will watch for gains above the pivot point backed by at least the bare minimum +40% above average volume threshold to trigger a proper new (or add-on) technical buy signal before taking action."The high-ranked Telecom Services - Cable/Satellite firm reported earnings +39% on +15% sales revenues for the Sep '12 quarter, above the fact-based investment system's +25% minimum guideline for the C criteria, a reassuring follow-up to the previously noted sub par quarter (see red circle). It has earned good ranks. Its annual earnings (A criteria) history has been strong and leadership from other firms in the industry group is a reassuring sign concerning the L criteria. The number of top-rated funds owning its shares rose from 1,916 in Jun '11 to 2,222 in Dec '12, a reassuring sign concerning the I criteria. Its huge supply of 2.097 billion shares in the float could make it less likely to be a great sprinter, meanwhile, the S criteria calls for investors to usually look at small-cap or mid-cap companies.
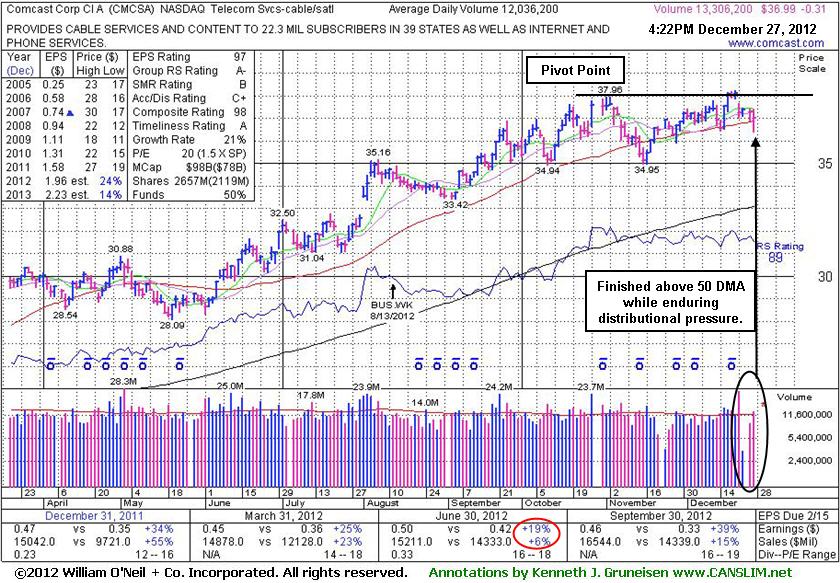
Found Support at 50-Day Average While Still Awaiting Breakout - Thursday, December 27, 2012
Comcast Corp Cl A (CMCSA -$0.31 or -0.83% to $36.99) finished in the upper half of its intra-day range after dipping below its 50-day moving average (DMA) line amid widespread weakness today. It did not trigger a technical buy signal yet while highlighted in yellow throughout December and repeatedly noted with caution - "Disciplined investors will watch for gains above the pivot point backed by at least the bare minimum +40% above average volume threshold to trigger a proper new (or add-on) technical buy signal before taking action." It was last shown in this FSU section on 12/07/12 with an annotated graph under the headline, "Perched Near New Pivot Point", while trading within close striking distance of its 52-week high with very little resistance remaining due to overhead supply.
Keep in mind that the M criteria argues against any new buying efforts when the major averages are in a correction. Subsequent volume-driven gains above the pivot point may trigger a new (or add-on) technical buy signal. Disciplined investors would have the patience to watch for a fresh breakout and favorable read on the current market environment before considering any new buying efforts.
It reported earnings +39% on +15% sales revenues for the Sep '12 quarter, above the fact-based investment system's +25% minimum guideline for the C criteria, a reassuring follow-up to the previously noted sub par quarter (see red circle). It has earned high ranks. Its annual earnings (A criteria) history has been strong and leadership from other firms in the Telecom Services - Cable/Satellite industry group is a reassuring sign concerning the L criteria. The number of top-rated funds owning its shares rose from 1,916 in Jun '11 to 2,221 in Sep '12, a reassuring sign concerning the I criteria. Its huge supply of 2.097 billion shares in the float could make it less likely to be a great sprinter, meanwhile, the S criteria calls for investors to usually look at small-cap or mid-cap companies.
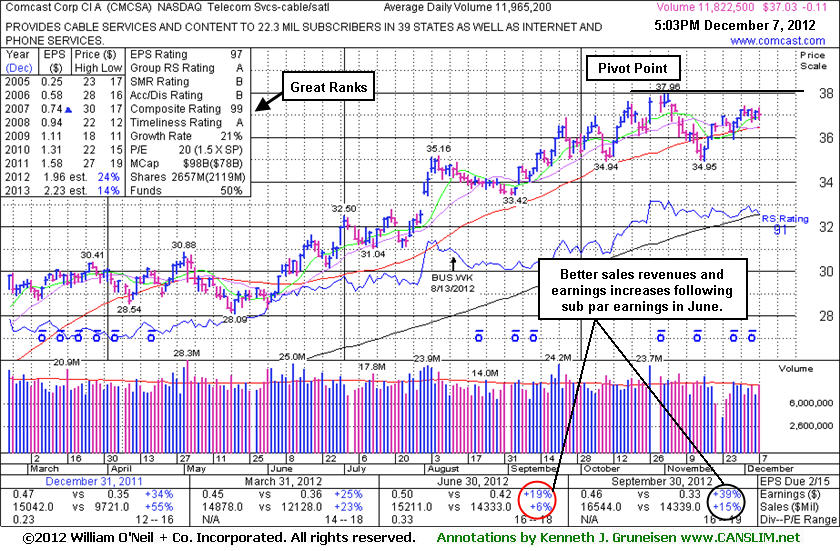
Perched Near New Pivot Point - Friday, December 07, 2012
Comcast Corp Cl A (CMCSA -$0.11 or -0.30% to $37.03) is perched within close striking distance of its 52-week high with very little resistance remaining due to overhead supply. Subsequent volume-driven gains above the pivot point may trigger a new (or add-on) technical buy signal. Disciplined investors would have the patience to watch for a fresh breakout before considering any new buying efforts. Recently its color code was changed to yellow with new pivot point cited based on its 11/02/12 high plus 10 cents while currently building on a short flat base. It was last shown in this FSU section on 11/19/12 with an annotated graph under the headline, "September Quarter Showed Stronger Earnings and Sales Increases". It reported earnings +39% on +15% sales revenues for the Sep '12 quarter, above the fact-based investment system's +25% minimum guideline for the C criteria, a reassuring follow-up to the previously noted sub par quarter.
It has earned high ranks. Its annual earnings (A criteria) history has been strong and leadership from other firms in the Telecom Services - Cable/Satellite industry group is a reassuring sign concerning the L criteria. The number of top-rated funds owning its shares rose from 1,916 in Jun '11 to 2,208 in Sep '12, a reassuring sign concerning the I criteria. Its huge supply of 2.097 billion shares in the float could make it less likely to be a great sprinter, meanwhile, the S criteria calls for investors to usually look at small-cap or mid-cap companies.
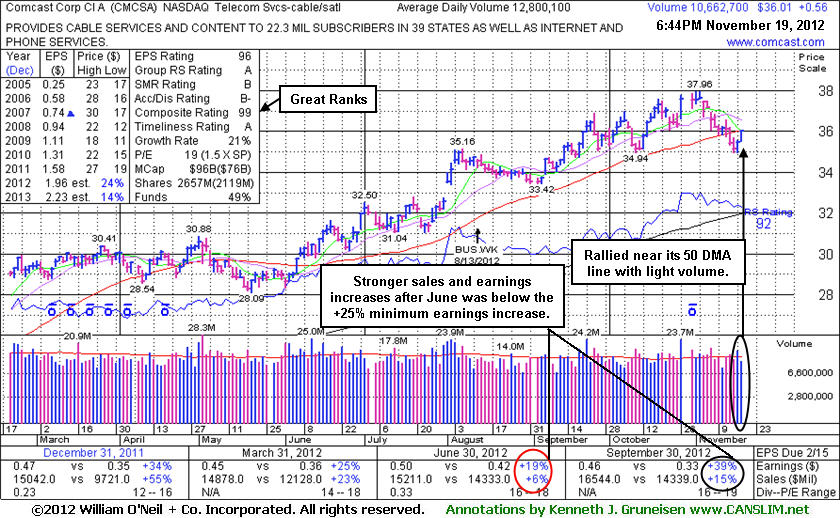
September Quarter Showed Stronger Earnings and Sales Increases - Monday, November 19, 2012
Comcast Corp Cl A (CMCSA +$0.56 or +1.58% to $36.01) posted a gain today on lighter volume, rallying near its 50-day moving average (DMA) line which may now act as a resistance level. It recently reported earnings +39% on +15% sales revenues for the Sep '12 quarter, above the fact-based investment system's +25% minimum guideline for the C criteria, a reassuring follow-up to the previously noted sub par quarter. It is consolidating only -5.1% off its 52-week high with little resistance remaining due to overhead supply up to the $38 level. It has not formed a sound base pattern. Additionally, the M criteria argues that 3 out of 4 stocks tend to go in the same direction as the major averages. Disciplined investors would have the patience to watch for a new confirmed rally and wait for an ideal new base and fresh breakout before considering any new buying efforts.It has earned high ranks. Its annual earnings (A criteria) history has been strong and leadership from other firms in the Telecom Services - Cable/Satellite industry group is a reassuring sign concerning the L criteria. The number of top-rated funds owning its shares rose from 1,916 in Jun '11 to 2,199 in Sep '12, a reassuring sign concerning the I criteria. Its huge supply of 2.097 billion shares in the float could make it less likely to be a great sprinter, meanwhile, the S criteria calls for investors to usually look at small-cap or mid-cap companies.
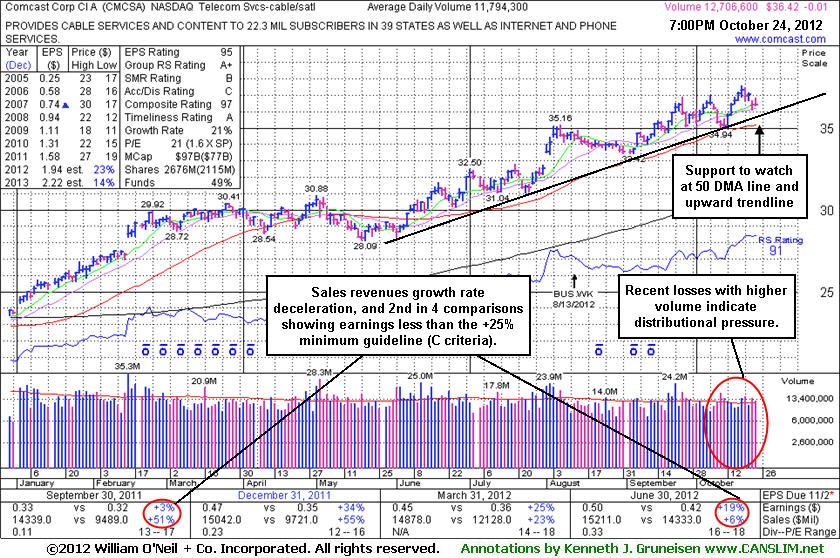
Trendline and 50-Day Moving Average Define Near-Term Support - Wednesday, October 24, 2012
Comcast Corp Cl A (CMCSA -$0.17 or -0.48% to $34.19) is consolidating only -3.1% off its 52-week high with no resistance remaining due to overhead supply. The upward trendline connecting its June-October lows and its 50-day moving average (DMA) line define near-term support levels to watch where violations would trigger technical sell signals. Fundamental concerns have been repeatedly noted - "Due to sub par sales and earnings growth in the Jun '12 quarter."Its last appearance in this FSU section with an annotated daily graph was on 9/21/12 under the headline, "Technically Strong, But Fundamental Flaws Raised Concerns". In the weeks that followed it gradually worked its way higher despite several down days marked by higher than average volume. That action is indicative of distributional pressure. Fundamental concerns were raised by sub par sales and earnings growth in the Jun '12 quarter. It recently reported earnings +19% on +6% sales revenues for the Jun '12 quarter, below the fact-based investment system's +25% minimum guideline for the C criteria.
Those who own it may give it the benefit of the doubt until there are any technical sell signals. However, buy candidates' earnings increases should be above the +25% guideline (C criteria) in 3 of the past 4 comparisons and, most ideally, they show signs of recent acceleration. In this case, decelerating sales revenues and earnings increases in the recent sequential quarters is cause for concern, fundamentally. Investors might find better odds in a buy candidate without any fundamental shortcomings.
Its annual earnings (A criteria) history has been strong and leadership from other firms in the Telecom Services - Cable/Satellite industry group is a reassuring sign concerning the L criteria. The number of top-rated funds owning its shares rose from 1,916 in Jun '11 to 2,149 in Sep '12, a reassuring sign concerning the I criteria. Its huge supply of 2.093 billion shares in the float could make it less likely to be a great sprinter, meanwhile, the S criteria calls for investors to usually look at small-cap or mid-cap companies.
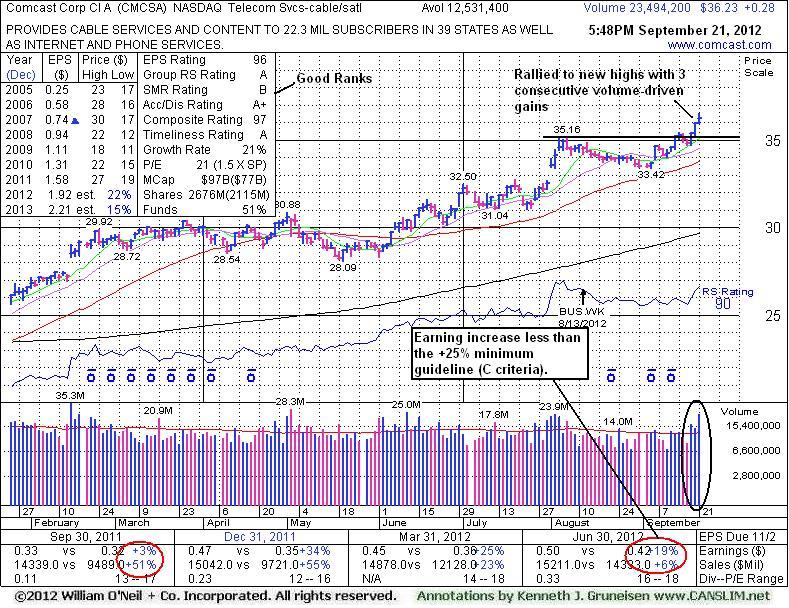
Technically Strong, But Fundamental Flaws Raised Concerns - Friday, September 21, 2012
Comcast Corp Cl A (CMCSA -$0.17 or -0.48% to $34.19) rallied today for a 3rd consecutive gain with above average volume and hit new 52-week highs, rising from an orderly flat base with no resistance remaining due to overhead supply. No new pivot point was cited, however, because of fundamental concerns that were raised by sub par sales and earnings growth in the Jun '12 quarter. Its last appearance in this FSU section with an annotated daily graph was on 8/15/12 under the headline, "Decelerating Sales and Earnings Growth a Concern Following Sub Par Quarter". It recently reported earnings +19% on +6% sales revenues for the Jun '12 quarter, below the fact-based investment system's +25% minimum guideline for the C criteria.
Those who own it may give it the benefit of the doubt until there are any technical sell signals. However, buy candidates' earnings increases should be above the +25% guideline (C criteria) in 3 of the past 4 comparisons and, most ideally, they show signs of recent acceleration. In this case, decelerating sales revenues and earnings increases in the recent sequential quarters is cause for concern, fundamentally. Investors might find better odds in a buy candidate without any fundamental shortcomings.
Its annual earnings (A criteria) history has been strong and leadership from other firms in the Telecom Services - Cable/Satellite industry group is a reassuring sign concerning the L criteria. The number of top-rated funds owning its shares rose from 1,916 in Jun '11 to 2,107 in Jun '12, a reassuring sign concerning the I criteria. Its huge supply of 2.093 billion shares in the float could make it less likely to be a great sprinter, meanwhile, the S criteria calls for investors to usually look at small-cap or mid-cap companies.
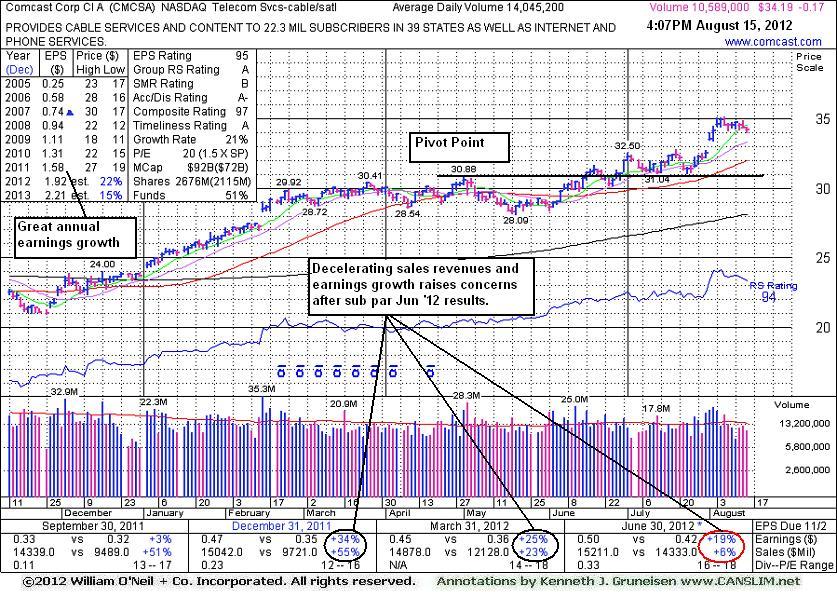
Decelerating Sales and Earnings Growth a Concern Following Sub Par Quarter - Wednesday, August 15, 2012
Comcast Corp Cl A (CMCSA -$0.17 or -0.48% to $34.19) is hovering in a tight range near its 52-week high. It recently reported earnings +19% on +6% sales revenues for the Jun '12 quarter, below the fact-based investment system's +25% minimum guideline for the C criteria. Buy candidates' earnings increases should be above the +25% guideline (C criteria) in 3 of the past 4 comparisons and, most ideally, they show signs of recent acceleration. In this case, decelerating sales revenues and earnings increases in the recent sequential quarters is cause for concern, fundamentally. However, its annual earnings (A criteria) history has been strong and leadership from other firms in the Telecom Services - Cable/Satellite industry group is a reassuring sign concerning the L criteria.Its last appearance in this FSU section with an annotated daily graph was on 7/11/12 under the headline, "Healthy Action Following Latest Breakout". It went on consolidating above prior highs and stayed well above its 50-day moving average (DMA) line in the weeks that followed, then it surged to new highs with volume-driven gains including a gap up on 8/01/12. The number of top-rated funds owning its shares rose from 1,916 in Jun '11 to 2,093 in Jun '12, a reassuring sign concerning the I criteria. Its huge supply of 2.093 billion shares in the float could make it less likely to be a great sprinter, meanwhile, the S criteria calls for investors to usually look at small-cap or mid-cap companies.
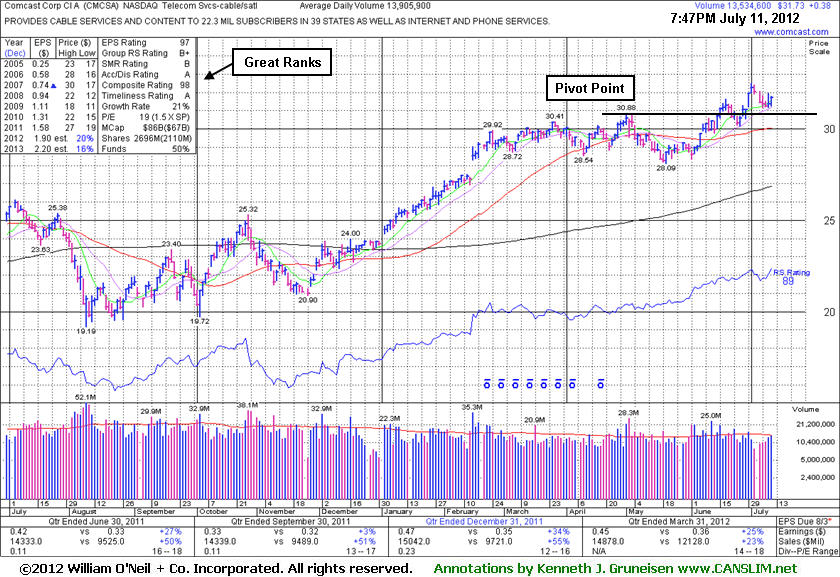
Healthy Action Following Latest Breakout - Wednesday, July 11, 2012
Comcast Corp Cl A (CMCSA +$0.38 or +1.21% to $31.73) has still been consolidating in a tight range near its 52-week high, holding ground above its pivot point. No overhead supply remains to act as resistance and it is still trading below its "max buy" level. Its last appearance in this FSU section with an annotated daily graph was on 6/11/12 under the headline, "New Pivot Point Cited as Resilient Leader Challenges Highs". Subsequent volume-driven gains above its pivot point triggered a new (or add-on) technical buy signal. Its prior highs and 50-day moving average (DMA) line now define important near-term chart support levels to watch on pullbacks. Healthy stocks do not usually slump more than -7% below their pivot point in a bullish market environment. Keep in mind that 3 out of 4 stocks follow along in the direction of the major averages (M criteria).
It recently reported earnings +25% on +23% sales for the quarter ended March 31, 2012 versus the year ago period. The 3 prior quarterly comparisons (through Dec '11) showed sales revenues increases above the year ago periods by +50%, and earnings increases were above the +25% guideline (C criteria) in 3 of the past 4 comparisons. Its annual earnings (A criteria) history has been strong. The number of top-rated funds owning its shares rose from 1,916 in Jun '11 to 2,014 in Mar '12, a reassuring sign concerning the I criteria. Leadership from other firms in the Telecom Services - Cable/Satellite industry group is a reassuring sign concerning the L criteria. Its huge supply of 2.088 billion shares in the float could make it less likely to be a great sprinter, meanwhile, the S criteria calls for investors to usually look at small-cap or mid-cap companies.
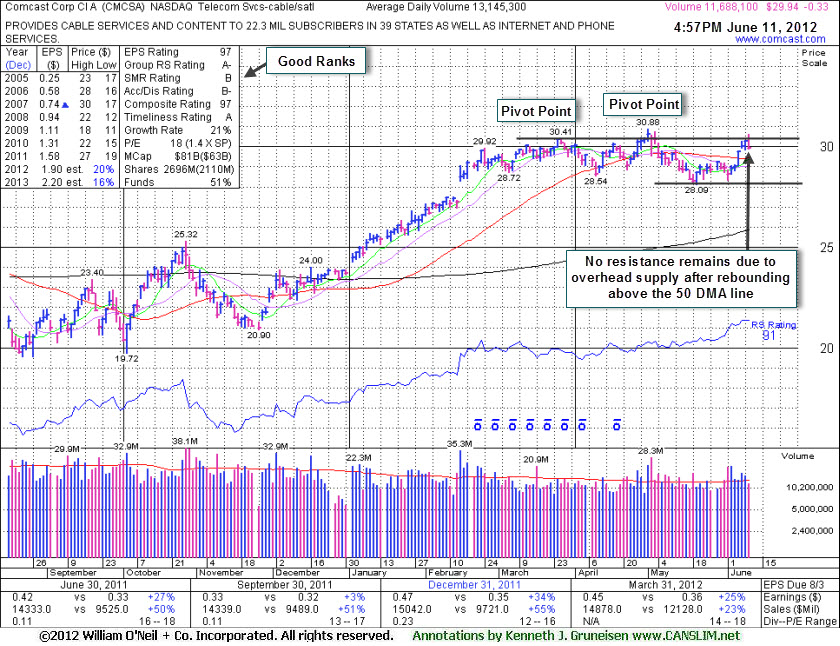
New Pivot Point Cited as Resilient Leader Challenges Highs - Monday, June 11, 2012
Comcast Corp Cl A (CMCSA -$0.33 or -1.09% to $29.94) ended lower today on lighter volume following a streak of 5 consecutive gains that helped it rally above its 50-day moving average (DMA) line and improved its technical stance. A new pivot point is being cited based on its 5/01/12 high plus 10 cents. New buying efforts may only be justified under the fact-based system if the stock triggers a new technical buy signal and a confirmation day (follow-through day) also signals that the broader market has resumed an upward trend. The prior low ($28.09 on 5/21/12) defines important near-term support to watch where further deterioration would raise more serious concerns.
Its last appearance in this FSU section with an annotated daily graph was on 5/07/12 under the headline, "Hovering Near 52-week High After Another Good Earnings Report", while holding its ground near its 50-day moving average (DMA) line. Subsequent losses below its prior low ($28.54 on 4/10/12) raised additional concerns and triggered a technical sell signal. Healthy stocks do not usually slump more than -7% below their pivot point in a bullish market environment. In this case the market slumped into a correction, and the stock slumped more than -7% below the pivot point. Keep in mind that 3 out of 4 stocks follow along in the direction of the major averages (M criteria). It recently reported earnings +25% on +23% sales for the quarter ended March 31, 2012 versus the year ago period. The 3 prior quarterly comparisons (through Dec '11) showed sales revenues increases above the year ago periods by +50%, and earnings increases were above the +25% guideline (C criteria) in 3 of the past 4 comparisons. Its annual earnings (A criteria) history has been strong.
The number of top-rated funds owning its shares rose from 1,916 in Jun '11 to 2,031 in Mar '12, a reassuring sign concerning the I criteria. Leadership from other firms in the Telecom Services - Cable/Satellite industry group is a reassuring sign concerning the L criteria. Its huge supply of 2.088 billion shares in the float could make it less likely to be a great sprinter, meanwhile, the S criteria calls for investors to usually look at small-cap or mid-cap companies.
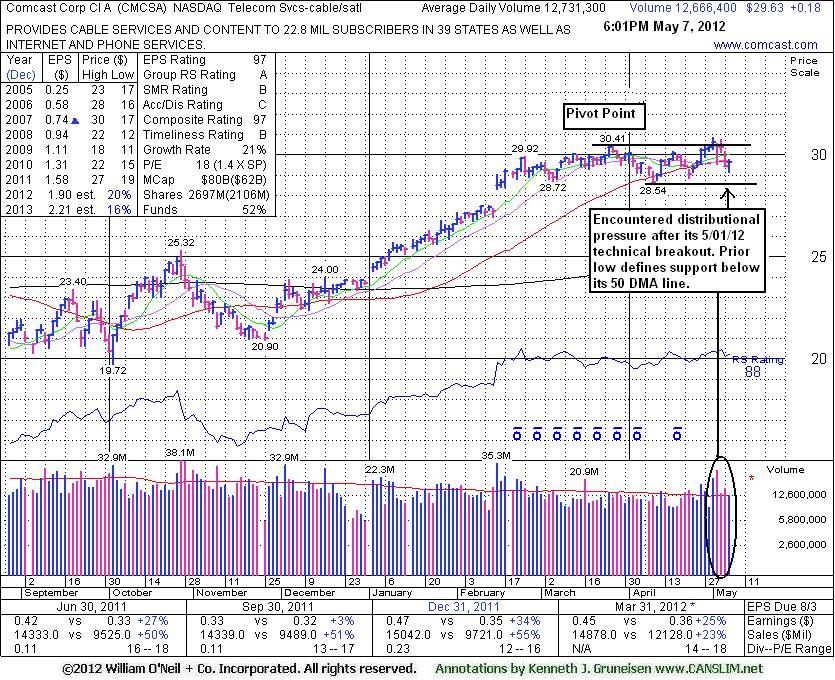
Hovering Near 52-week High After Another Good Earnings Report - Monday, May 07, 2012
Comcast Corp Cl A (CMCSA +$0.18 or +0.61% to $29.63) is holding its ground near its 50-day moving average (DMA) line. In the 5/02/12 mid-day report it was highlighted in yellow with a pivot point cited based on its 3/27/12 high plus 10 cents after a flat base. Technically, its volume driven-gain on the prior session had just triggered a technical buy signal capping a streak of 6 consecutive gains with an above average volume gain as it hit a new 52-week high (N criteria) and traded above its 2007 high.
It recently reported earnings +25% on +23% sales for the quarter ended March 31, 2012 versus the year ago period. The 3 prior quarterly comparisons (through Dec '11) showed sales revenues increases above the year ago periods by +50%, and earnings increases were above the +25% guideline (C criteria) in 3 of the past 4 comparisons. Its annual earnings (A criteria) history has been strong.
The number of top-rated funds owning its shares rose from 1,916 in Jun '11 to 2,029 in Mar '12, a reassuring sign concerning the I criteria. Leadership from other firms in the Telecom Services - Cable/Satellite industry group is a reassuring sign concerning the L criteria. Its huge supply of 2.085 billion shares in the float could make it less likely to be a great sprinter, meanwhile, the S criteria calls for investors to usually look at small-cap or mid-cap companies
Healthy stocks do not usually slump more than -7% below their pivot point in a bullish market environment. Keep in mind that 3 out of 4 stocks follow along in the direction of the major averages (M criteria). In this case, subsequent losses below its recent low ($28.54 on 4/10/12) would raise concerns and trigger a technical sell signal.