Volume-Driven Loss Tests Support at 50-Day Moving Average - Monday, August 24, 2020
Bullish Action Continued After Latest Strong Earnings Report - Thursday, August 6, 2020
Negative Reversal After Recently Wedging into New High Territory - Monday, July 13, 2020
Formed a Flat Base Perched Within Striking Distance of 52-Week High - Thursday, June 18, 2020
Sputtering Below 50-Day Average Line in Recent Weeks - Tuesday, August 27, 2019
Consolidating Above Prior Highs and 50-Day Average - Tuesday, August 6, 2019
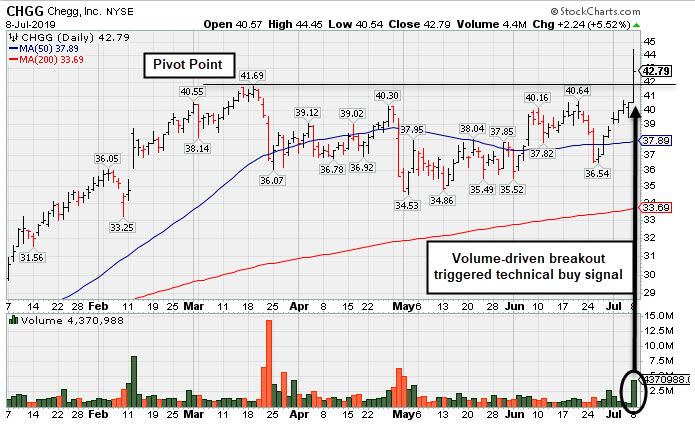
Tallied a Big Volume-Driven Breakout Gain for a New High - Monday, July 8, 2019
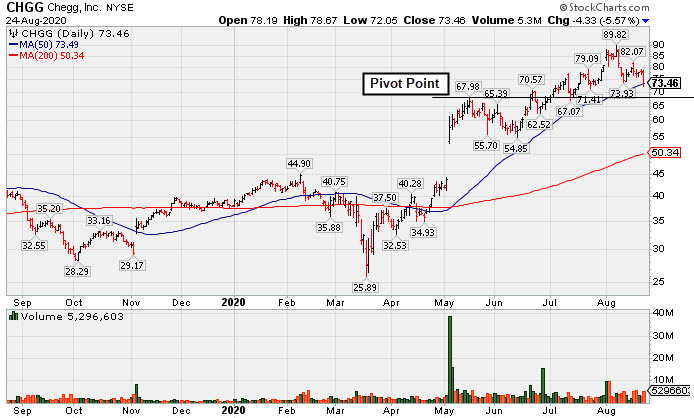
Volume-Driven Loss Tests Support at 50-Day Moving Average - Monday, August 24, 2020
Chegg Inc (CHGG -$4.33 or -5.57% to $73.46) suffered a big loss on +42% above average volume today testing support at its 50-day moving average (DMA) line ($73.48). It churned heavier volume in recent weeks while pulling back, enduring distributional pressure after getting very extended from any sound base. The 50 DMA line defines important support to watch above its prior high in the $68 area. Any further losses leading to damaging violations would raise greater concerns and trigger technical sell signals.
Reported Jun '20 quarterly earnings +61% on +63% sales revenues versus the year ago period, maintaining its long streak of earnings increases well above the +25% minimum earnings guideline (C criteria). Annual earnings (A criteria) have been growing at a strong pace since turning profitable in FY '16 following years of losses.
It completed its $13 IPO in November of 2013 and another new Public Offering in August of 2017. It has 124.3 million shares outstanding. The number of high-ranked funds owning its shares rose from 360 in Sep '18 to 626 in Jun '20, a reassuring sign concerning the I criteria. Its current Up/Down Volume Ratio of 1.5 is an unbiased indication its shares have been under accumulation over the past 50 days. It has earned a Timeliness Rating of A and Sponsorship Rating of C.
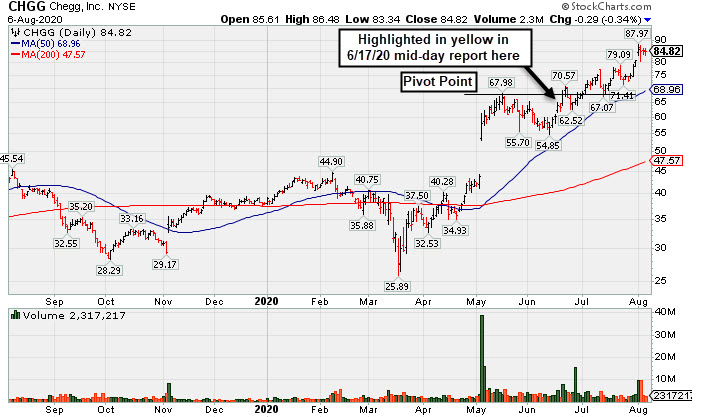
Bullish Action Continued After Latest Strong Earnings Report - Thursday, August 6, 2020
Chegg Inc (CHGG -$0.29 or -0.34% to $84.82) has been hovering near its all-time high since gapping up on 8/03/20. It is very extended from any sound base. Bullish action came after it reported Jun '20 quarterly earnings +61% on +63% sales revenues versus the year ago period, maintaining its long streak of earnings increases well above the +25% minimum earnings guideline (C criteria). Annual earnings (A criteria) have been growing at a strong pace since turning profitable in FY '16 following years of losses.
The prior high in the $68 area defines support to watch coinciding with its 50-day moving average (DMA) line ($68.96) where any losses leading to violations would raise concerns and trigger technical sell signals.
It completed its $13 IPO in November of 2013 and another new Public Offering in August of 2017. It has 123.6 million shares outstanding. The number of high-ranked funds owning its shares rose from 360 in Sep '18 to 586 in Jun '20, a reassuring sign concerning the I criteria. Its current Up/Down Volume Ratio of 1.7 is an unbiased indication its shares have been under accumulation over the past 50 days. It has earned a Timeliness Rating of B and Sponsorship Rating of C.
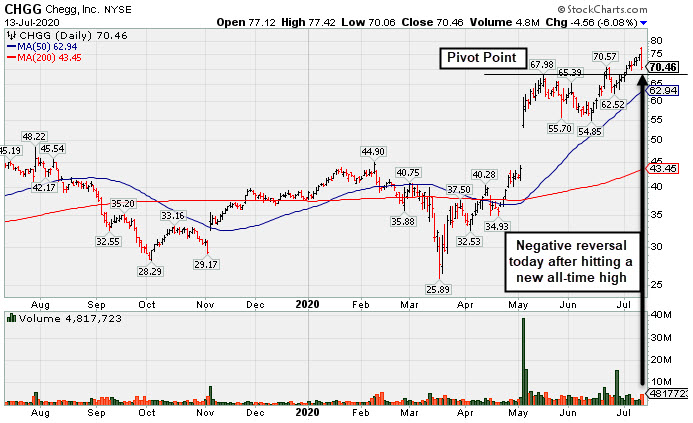
Negative Reversal After Recently Wedging into New High Territory - Monday, July 13, 2020
Chegg Inc (CHGG -$4.56 or -6.08% to $70.46) had a "negative reversal" today after hitting a new all-time high, finishing lower with a big loss on higher (near average). Its color code was changed to yellow after pulling back below its "max buy" level. Recent gains above the pivot point were backed by below average volume, action that is termed "wedging", as opposed to a strong technical buy signal. Prior highs in the $68 area defines initial support to watch on pullbacks.
It completed its $13 IPO in November of 2013 and another new Public Offering in August of 2017. It has 123.6 million shares outstanding. The number of high-ranked funds owning its shares rose from 360 in Sep '18 to 552 in Jun '20, a reassuring sign concerning the I criteria. Its current Up/Down Volume Ratio of 2.9 is an unbiased indication its shares have been under heavy accumulation over the past 50 days. It has earned a Timeliness Rating of A and Sponsorship Rating of C.
It won't be reporting financial results for the Jun '20 quarter until 8/03/20. Earnings rose +47% on +35% sales revenues for the Mar '20 quarter, and prior earnings increases were well above the +25% minimum earnings guideline (C criteria). Annual earnings (A criteria) have been growing at a strong pace since turning profitable in FY '16 following years of losses.
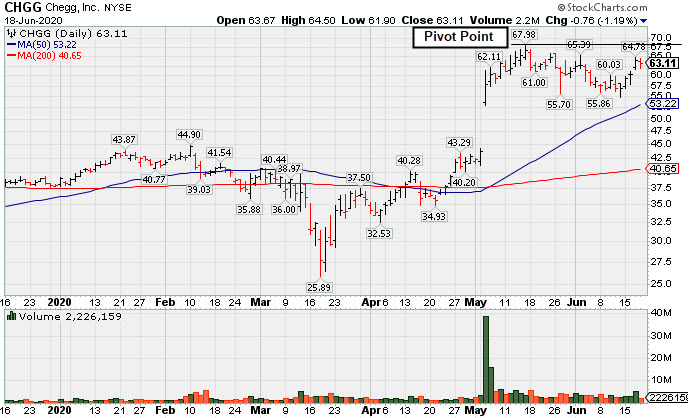
Formed a Flat Base Perched Within Striking Distance of 52-Week High - Thursday, June 18, 2020
Chegg Inc (CHGG -$0.76 or -1.19% to $63.11) was highlighted in yellow in the prior mid-day report (read here) with a new pivot point cited based on its 5/15/20 high plus 10 cents after a flat 5-week base. Subsequent gains above the pivot point backed by at least +40% above average volume may trigger a technical buy signal.
Bullish action came after it reported earnings +47% on +35% sales revenues for the Mar '20 quarter, continuing its strong earnings track record of earnings increases well above the +25% minimum earnings guideline (C criteria). Annual earnings (A criteria) have been growing at a strong pace since turning profitable in FY '16 following years of losses.. Went through a choppy consolidation since dropped from the Featured Stocks list on 9/03/19. Fundamentals have remained strong. CHGG slumped back below its pivot point and into the prior base since it was last shown in this FSU section on 8/27/19 with an annotated graph under the headline, "Sputtering Below 50-Day Average Line in Recent Weeks".
It completed its $13 IPO in November of 2013 and another new Public Offering in August of 2017. It has 123.6 million shares outstanding. The number of high-ranked funds owning its shares rose from 360 in Sep '18 to 497 in Mar '20, a reassuring sign concerning the I criteria. Its current Up/Down Volume Ratio of 2.5 is an unbiased indication its shares have been under heavy accumulation over the past 50 days. It has earned a Timeliness Rating of A and Sponsorship Rating of C.
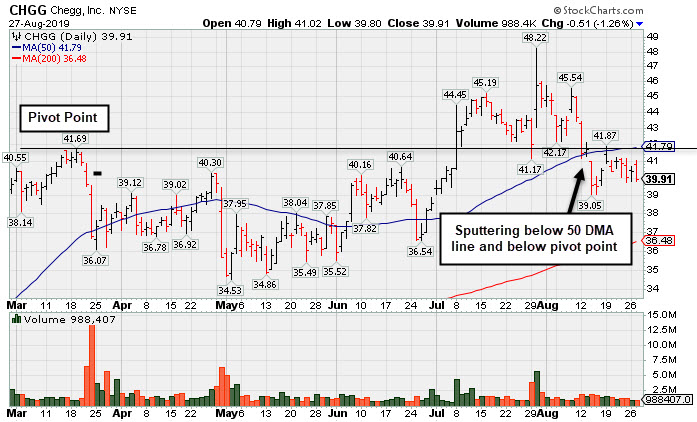
Sputtering Below 50-Day Average Line in Recent Weeks - Tuesday, August 27, 2019
Chegg Inc (CHGG -$0.51 or -1.26% to $39.91) remains below its 50-day moving average (DMA) line ($41.79) which acted as resistance after recent losses on higher volume. A rebound above the 50 DMA line is needed for its outlook to improve.
It reported earnings +92% on +26% sales revenues for the Jun '19 quarter, continuing its strong earnings track record of earnings increases well above the +25% minimum earnings guideline (C criteria). Annual earnings (A criteria) have been growing at a strong pace since turning profitable in FY '16 following years of losses. It completed its $13 IPO in November of 2013 and another new Public Offering in August of 2017. It has 119.7 million shares outstanding.
CHGG slumped back below its pivot point and into the prior base since it was last shown in this FSU section on 8/06/19 with an annotated graph under the headline, "Consolidating Above Prior Highs and 50-Day Average". It was highlighted in yellow in the 7/08/19 mid-day report with a pivot point cited based on its 3/19/19 high plus 10 cents (read here).
The number of high-ranked funds owning its shares rose from 360 in Sep '18 to 474 in Jun '19, a reassuring sign concerning the I criteria. Its current Up/Down Volume Ratio of 1.3 is an unbiased indication its shares have been under slight accumulation over the past 50 days. It has earned a Timeliness Rating of A and Sponsorship Rating of B.
Charts courtesy of www.stockcharts.com
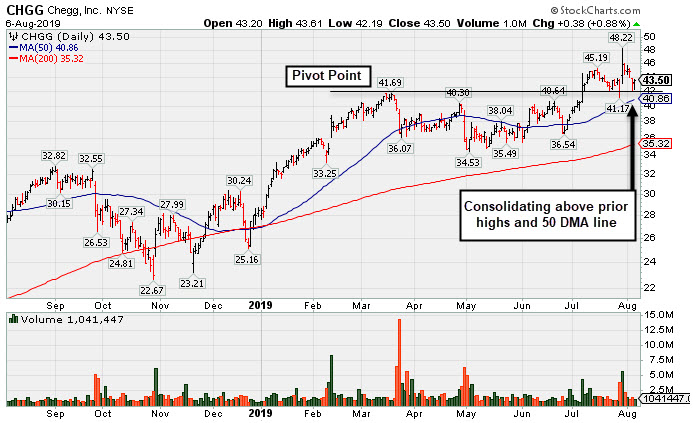
Consolidating Above Prior Highs and 50-Day Average - Tuesday, August 6, 2019
Chegg Inc (CHGG +$0.38 or +0.88% to $43.50) is consolidating above prior highs in the $40-41 area with define important near-term support to watch along with its 50-day moving average (DMA) line ($40.72).
It reported earnings +92% on +26% sales revenues for the Jun '19 quarter, continuing its strong earnings track record of earnings increases well above the +25% minimum earnings guideline (C criteria). Annual earnings (A criteria) have been growing at a strong pace since turning profitable in FY '16 following years of losses. It completed its $13 IPO in November of 2013 and another new Public Offering in August of 2017. It has 118.5 million shares outstanding.
It was highlighted in yellow with pivot point cited based on its 3/19/19 high plus 10 cents (read here). It triggered a technical buy signal as it hit a new 52-week high with +165% above average volume behind a big gain capping an 8-day winning streak. It was last shown in this FSU section on 7/08/19 with an annotated graph under the headline, "Tallied a Big Volume-Driven Breakout Gain for a New High".
The number of high-ranked funds owning its shares rose from 360 in Sep '18 to 481 in Jun '19, a reassuring sign concerning the I criteria. Its current Up/Down Volume Ratio of 1.5 is an unbiased indication its shares have been under slight accumulation over the past 50 days. It has earned a Timeliness Rating of A and Sponsorship Rating of B.
Charts courtesy of www.stockcharts.com
Tallied a Big Volume-Driven Breakout Gain for a New High - Monday, July 8, 2019
Chegg Inc (CHGG +$2.24 or +5.52% to $42.79) finished in the upper half of its intra-day range today after highlighted in yellow with pivot point cited based on its 3/19/19 high plus 10 cents (read here). It triggered a technical buy signal as it hit a new 52-week high with +165% above average volume behind today's big gain capping an 8-day winning streak. It formed an orderly base since last noted in the 5/01/19 mid-day report - "Violated its 50 DMA line with a big volume-driven loss on the prior session. Quarterly and annual earnings (C and A criteria) history has been strong."
Through Mar '19 its quarterly comparisons have shown earnings increases well above the +25% minimum earnings guideline (C criteria). Annual earnings (A criteria) have been growing at a strong pace since turning profitable in FY '16 following years of losses. It completed its $13 IPO in November of 2013 and another new Public Offering in August of 2017. It has 118.5 million shares outstanding.
The number of high-ranked funds owning its shares rose from 360 in Sep '18 to 455 in Jun '19, a reassuring sign concerning the I criteria. Its current Up/Down Volume Ratio of 1.2 is an unbiased indication its shares have been under slight accumulation over the past 50 days. It has earned a Timeliness Rating of A and Sponsorship Rating of B.
Charts courtesy of www.stockcharts.com