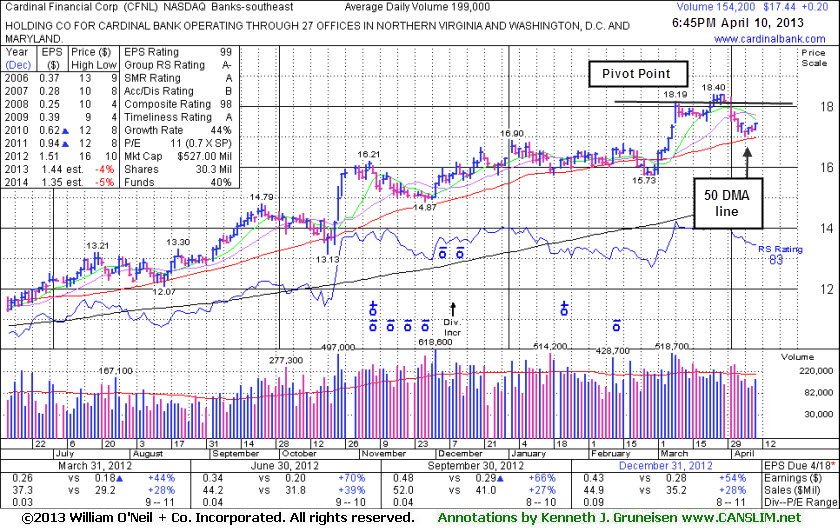
Found Support at 50 DMA Line After No Proper Breakout From "3-Weeks Tight" Base - Wednesday, April 10, 2013
Cardinal Financial Corp (CFNL +$0.20 or +1.16% to $17.44) recently retreated near its 50-day moving average (DMA) line, enduring distributional pressure instead of rallying from the previously noted advanced "3-weeks tight" base. Previously noted - "Gains above the pivot point must have at least the bare minimum +40% above average volume, preferably more, to trigger a proper new (or add-on) technical buy signal."
It was last shown in this FSU section on 3/18/13 with an annotated graph under the headline, "Holding Ground in Tight Range Following Technical Breakout." The high-ranked leader hailing from the Banks - Southeast industry group reported earnings +54% on +28% sales revenues for the quarter ended December 31, 2012 versus the year ago period, continuing its track record of strong quarterly earnings comparisons underpinned by encouraging sales revenues increases. It has earned the highest possible 99 Earnings Per Share (EPS) rank, and its high ranks and long term earnings history help it match favorably with the C and A criteria. The number of top-rated funds owning its shares rose from 172 in Sep '11 to 219 in Mar '13, a reassuring trend concerning the I criteria. Its small supply (S criteria) of only 30.3 millions shares outstanding is a favorable characteristic, yet it can contribute to greater price volatility in the event of institutional accumulation or distributional pressure.
Holding Ground in Tight Range Following Technical Breakout - Monday, March 18, 2013
Cardinal Financial Corp (CFNL -$0.02 or -0.11% to $17.77) has been holding its ground stubbornly in a tight range perched near its 52-week high since volume-driven gains recently cleared a "double bottom" base and triggered a technical buy signal. It is slightly extended from its prior base. Prior highs in the high $16 area define initial support to watch on pullbacks. It was last shown in this FSU section on 2/21/13 with an annotated graph under the headline, "Violation of 50-Day Moving Average on Light Volume", as it violated its 50-day moving average (DMA) line and finished the session at its low with a loss on below average volume. The deterioration raised concerns and triggered technical sell signal as it was then noted - "Only a prompt rebound above its 50 DMA line would help its outlook improve. It has been trading in a tight range in recent weeks without making meaningful progress above its latest pivot point. Meanwhile, more damaging losses leading to a slump below the recent low ($15.74 on 1/18/13) would raise more serious concerns and trigger an additional technical sell signal. Disciplined investors always limit losses if any stock ever falls more than -7% from their purchase price."
It stayed above the prior low noted and soon repaired its 50 DMA violation. Its rally on 3/07/13 was backed by volume +169% above average as it rose above the new pivot point cited based upon its 2/15/13 high, clearing a "double bottom" base and triggering a proper technical buy signal under the fact-based system. The high-ranked leader hailing from the Banks - Southeast industry group reported earnings +54% on +28% sales revenues for the quarter ended December 31, 2012 versus the year ago period, continuing its track record of strong quarterly earnings comparisons underpinned by encouraging sales revenues increases. It has earned the highest possible 99 Earnings Per Share (EPS) rank, and its high ranks and long term earnings history help it match favorably with the C and A criteria. The number of top-rated funds owning its shares rose from 172 in Sep '11 to 209 in Dec '12, a reassuring trend concerning the I criteria. Its small supply (S criteria) of only 29.3 millions shares outstanding is a favorable characteristic, yet it can contribute to greater price volatility in the event of institutional accumulation or distributional pressure.

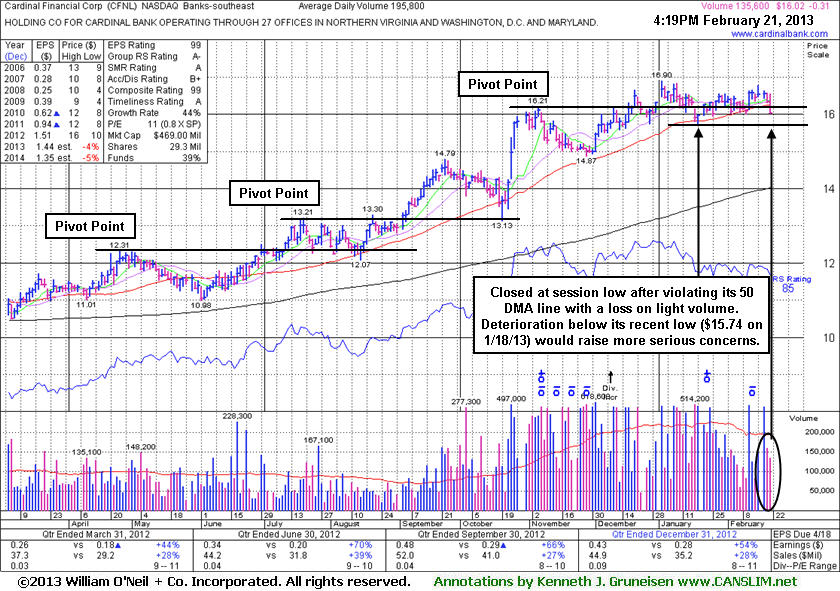
Violation of 50-Day Moving Average on Light Volume - Thursday, February 21, 2013
Cardinal Financial Corp (CFNL -$0.31 or -1.90% to $16.02 ) violated its 50-day moving average (DMA) line today and finished the session at its low with a loss on below average volume. The deterioration raised concerns and triggered technical sell signal. Only a prompt rebound above its 50 DMA line would help its outlook improve. It has been trading in a tight range in recent weeks without making meaningful progress above its latest pivot point. It may find support and make a stand near that important short-term average, however the weak finish at the session's low does not bode well for Friday's session. Meanwhile, more damaging losses leading to a slump below the recent low ($15.74 on 1/18/13) would raise more serious concerns and trigger an additional technical sell signal. Disciplined investors always limit losses if any stock ever falls more than -7% from their purchase price.It was last shown in this FSU section on 1/31/13 with an annotated graph under the headline, "Found Support Above 50-Day Moving Average But Relative Strength Has Been Waning". It did not ever trade above its "max buy" level after the rally above its pivot point on 1/02/13 with +72% above average volume triggered a technical buy signal. Its 85 Relative Strength Rating remains above the 80+ minimum for buy candidates, however that rank has been slumping.
The high-ranked leader hailing from the Banks - Southeast industry group reported earnings +54% on +28% sales revenues for the quarter ended December 31, 2012 versus the year ago period, continuing its track record of strong quarterly earnings comparisons underpinned by encouraging sales revenues increases. It has earned the highest possible 99 Earnings Per Share (EPS) rank, and its high ranks and long term earnings history help it match favorably with the C and A criteria. The number of top-rated funds owning its shares rose from 172 in Sep '11 to 205 in Dec '12, a reassuring trend concerning the I criteria. Its current Up/Down Volume Ratio of 1.3 also offers an unbiased indication that its shares have been under accumulation over the past 50 days. Its small supply (S criteria) of only 29.3 millions shares outstanding is a favorable characteristic, yet it can contribute to greater price volatility in the event of institutional accumulation or distributional pressure.
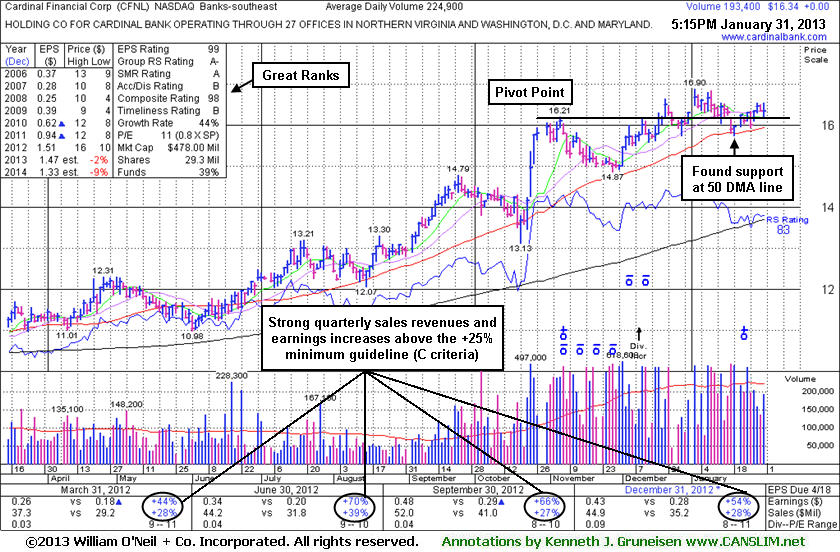
Found Support Above 50-Day Moving Average But Relative Strength Has Been Waning - Thursday, January 31, 2013
Cardinal Financial Corp's (CFNL $16.34) has been consolidating in a tight range above support at its 50-day moving average (DMA) line and trading just above its pivot point. It did not ever trade above its "max buy" level after the rally above its pivot point on 1/02/13 with +72% above average volume triggered a technical buy signal. Subsequent losses leading to a damaging violation and a slump below the 50 DMA and below the recent low ($15.74 on 1/18/13) would raise more serious concerns and trigger technical sell signals. Its 83 Relative Strength Rating remains above the 80+ minimum for buy candidates, however that rank has been slumping since last shown in this FSU section on 1/15/13 with an annotated graph under the headline, " Consolidating Above Support Following Breakout Gain".The high-ranked leader hailing from the Banks - Southeast industry group reported earnings +54% on +28% sales revenues for the quarter ended December 31, 2012 versus the year ago period, continuing its track record of strong quarterly earnings comparisons underpinned by encouraging sales revenues increases. It has earned the highest possible 99 Earnings Per Share (EPS) rank, and its high ranks and long term earnings history help it match favorably with the C and A criteria. The number of top-rated funds owning its shares rose from 172 in Sep '11 to 196 in Dec '12, a reassuring trend concerning the I criteria. Its small supply (S criteria) of only 29.3 millions shares outstanding is a favorable characteristic, yet it can contribute to greater price volatility in the event of institutional accumulation or distributional pressure.
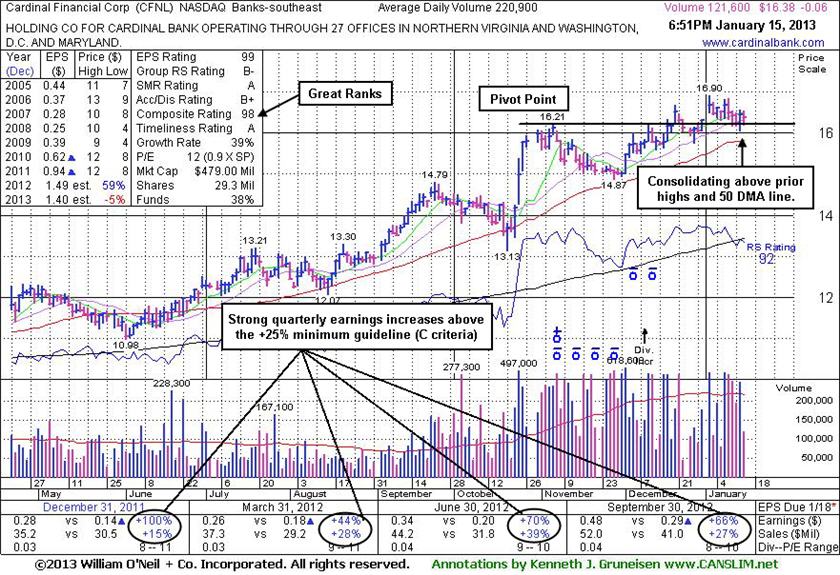
Consolidating Above Support Following Breakout Gain - Tuesday, January 15, 2013
Cardinal Financial Corp's (CFNL -$0.06 or -0.36% to $16.38) has been finding support while consolidating above its prior highs, and it has been staying well above its 50-day moving average (DMA) line. It was last shown in this FSU section on 12/31/12 with an annotated graph under the headline, "Volume-Driven Gain Still Needed to Trigger Technical Buy Signal". Now it is still trading below its "max buy" level after the subsequent rally above its pivot point on 1/02/13 with +72% above average volume triggered a technical buy signal.
A gain above a stock's pivot point needs to be backed by at least +40% above average volume to trigger a proper new (or add-on) technical buy signal. Without sufficient volume conviction investors have less reason to believe a stock is attracting the great buying demand from the institutional crowd which is necessary for any meaningful advance in the shares' price. In this case, volume was well above the minimum threshold.
It stayed above the prior high ($14.79 on 9/24/12) defining important support during its prior consolidation. The high-ranked leader hailing from the Banks - Southeast industry group reported earnings +66% on +27% sales revenues for the quarter ended September 30, 2012 versus the year ago period, continuing its track record of strong quarterly earnings comparisons underpinned by encouraging sales revenues increases. It has earned high ranks and matches favorably with the C and A criteria. The number of top-rated funds owning its shares rose from 172 in Sep '11 to 190 in Dec '12, a reassuring trend concerning the I criteria. Its small supply (S criteria) of only 29.3 millions shares outstanding is a favorable characteristic, yet it can contribute to greater price volatility in the event of institutional accumulation or distributional pressure.
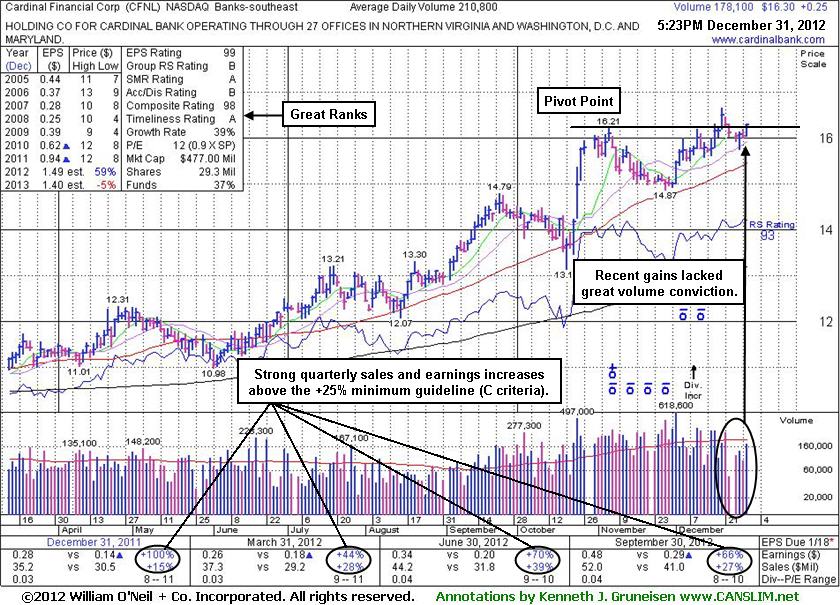
Volume-Driven Gain Still Needed to Trigger Technical Buy Signal - Monday, December 31, 2012
Cardinal Financial Corp's (CFNL +$0.25 or +1.56% to $16.30) still is quietly consolidating -2.2% off its 52-week high and hovering near its pivot point. A gain above the pivot point backed by at least +40% above average volume may trigger a proper new (or add-on) technical buy signal. It was last shown in this FSU section on 12/10/12 with an annotated graph under the headline, "Forming New Orderly Base Above Prior Highs and 50-Day Average".
It stayed above the prior high ($14.79 on 9/24/12) defining important support, however its recent gains lacked the volume conviction required for a proper technical buy signal. CFNL has traded up as much as +29.6% from $12.85 when first featured in the 7/20/12 mid-day report (read here). The high-ranked leader hailing from the Banks - Southeast industry group reported earnings +66% on +27% sales revenues for the quarter ended September 30, 2012 versus the year ago period, continuing its track record of strong quarterly earnings comparisons underpinned by encouraging sales revenues increases. It has earned high ranks and matches favorably with the C and A criteria. The number of top-rated funds owning its shares rose from 172 in Sep '11 to 185 in Sep '12, a reassuring trend concerning the I criteria. Its small supply (S criteria) of only 29.3 millions shares outstanding is a favorable characteristic, yet it can contribute to greater price volatility in the event of institutional accumulation or distributional pressure.
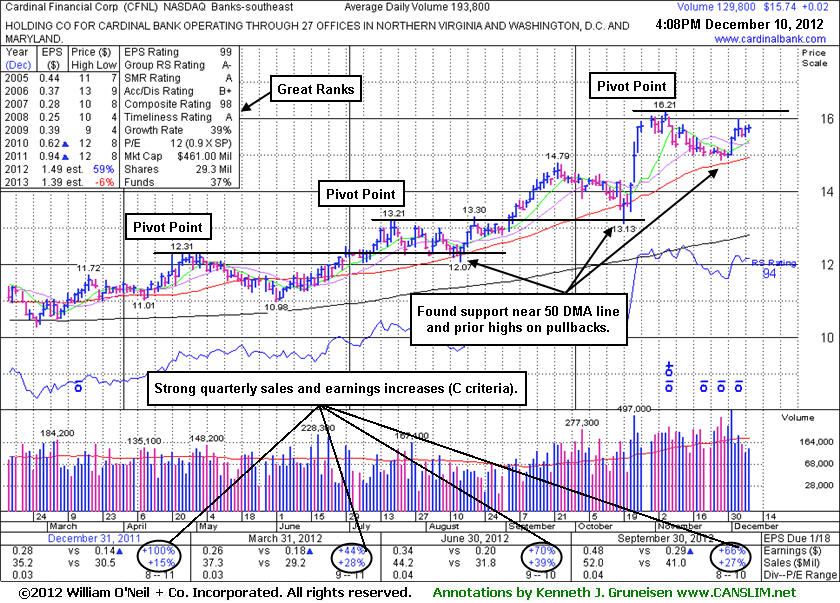
Forming New Orderly Base Above Prior Highs and 50-Day Average - Monday, December 10, 2012
Cardinal Financial Corp's (CFNL (CFNL +$0.02 or +0.07% to $15.74) color code was recently changed to yellow again with a new pivot point cited based on its 11/06/12 high while still building on a new base pattern. Its recent low and its 50-day moving average (DMA) line define near-term chart support where violations may trigger technical sell signals. Subsequent gains above its pivot point backed by at least +40% above average volume may trigger a new (or add-on) technical buy signal. It was last shown in this FSU section on 11/20/12 with an annotated graph under the headline, "Consolidating After Surge of +26% in Just Over 3 Months", when we observed - "Prior high ($14.79 on 9/24/12) defines initial support to watch above its 50 DMA line. Disciplined investors may watch out for worrisome technical sell signals while awaiting a new base or secondary buy point and more favorable market."CFNL rallied as much as +26.15% from $12.85 when first featured in the 7/20/12 mid-day report (read here). The high-ranked leader hailing from the Banks - Southeast industry group reported earnings +66% on +27% sales revenues for the quarter ended September 30, 2012 versus the year ago period, continuing its track record of strong quarterly earnings comparisons underpinned by encouraging sales revenues increases. It has earned high ranks and matches favorably with the C and A criteria. The number of top-rated funds owning its shares rose from 172 in Sep '11 to 185 in Sep '12, a reassuring trend concerning the I criteria. Its small supply (S criteria) of only 29.3 millions shares outstanding is a favorable characteristic, yet it can contribute to greater price volatility in the event of institutional accumulation or distributional pressure.
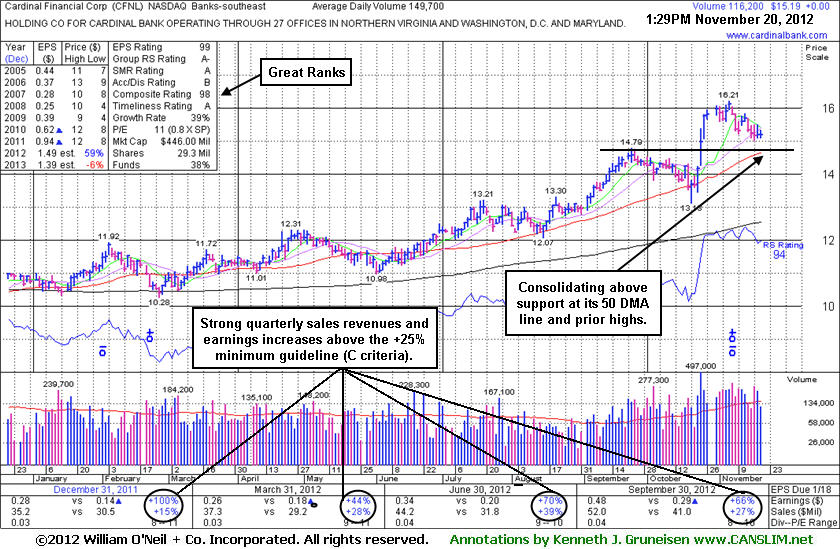
Consolidating After Surge of +26% in Just Over 3 Months - Tuesday, November 20, 2012
Cardinal Financial Corp (CFNL (CFNL -$0.01 or -0.07% to $15.18) has been repeatedly noted while extended from its prior base - "Prior high ($14.79 on 9/24/12) defines initial support to watch above its 50 DMA line. Disciplined investors may watch out for worrisome technical sell signals while awaiting a new base or secondary buy point and more favorable market."
CFNL has rallied +26.15% from $12.85 when first featured in the 7/20/12 mid-day report (read here). It was last shown in this FSU section on 10/25/12 with an annotated graph under the headline, "Cardinal Financial Flies Against Tough Market Headwinds", as it tallied a 3rd consecutive big gain with heavy volume and finished near the session high at a new 52-week high. Prior analysis included a look at a tactic taught in the Certification where a valid secondary buy point exists from when a stock successfully tests its 10-week moving average (WMA) line up to +5% above its latest highs following an earlier technical breakout. That approach is good for the first test of the 10 WMA only following a valid breakout, however, as subsequent tests of the 10 WMA have historically proven to be more failure prone unless it builds anew base of sufficient length.
The prior FSU analysis also reminded members - "It may go on to produce bigger gains, but keep in mind that the fact-based investment system argues for locking in gains when you have a solid +20% gain. Sometimes it is not worth it to stick around wait for sell signals and technical damage to mount, especially when the market direction is negative and the M criteria is arguing that 3 out of 4 stocks may be expected to decline."
The high-ranked leader hailing from the Banks - Southeast industry group reported earnings +66% on +27% sales revenues for the quarter ended September 30, 2012 versus the year ago period, continuing its track record of strong quarterly earnings comparisons underpinned by encouraging sales revenues increases. It has earned high ranks and matches favorably with the C and A criteria. The number of top-rated funds owning its shares rose from 172 in Sep '11 to 184 in Sep '12, a slightly reassuring sign concerning the I criteria. Its small supply (S criteria) of only 29.3 millions shares outstanding is a favorable characteristic, yet it can contribute to greater price volatility in the event of institutional accumulation or distributional pressure.
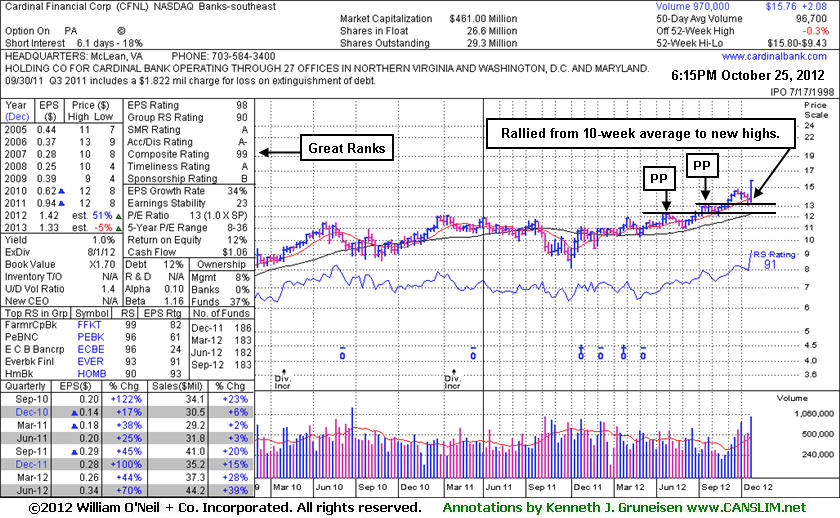
Cardinal Financial Flies Against Tough Market Headwinds - Thursday, October 25, 2012
Cardinal Financial Corp (CFNL +$0.78 or +5.21% to $15.76) tallied a 3rd consecutive big gain with heavy volume and finished near the session high at a new 52-week high. Its color code was changed to green after rallying more than +5% above its latest highs (9/24/12 high of $14.79). Market conditions (M criteria) argue against any new buying efforts until a new confirmed rally in the broader market, however this outlier has rallied impressively against a mostly negative backdrop.It was last shown in this FSU section on 9/25/12 with an annotated graph under the headline, "Extended From Prior Base Following Volume-Driven Gains". As we have explained before, in the Certification they teach that a valid secondary buy point exists from when a stock successfully tests its 10-week moving average (WMA) line up to +5% above its latest highs following an earlier technical breakout. In the mid-day report on Wednesday 10/24/12 (read here) it was noted - "CFNL is tallying another considerable gain with heavy volume today, spiking to a new 52-week high. Color code is changed to yellow however no new pivot point is cited, yet a valid secondary buy point otherwise exists from its recently successful test of support at its 10-week moving average (WMA) line up to +5% above its latest highs (9/24/12 high of $14.79 plus another +5%)."
Now it is extended from its prior base and outside of the proper range for its secondary buy point noted. The annotated weekly graph below illustrates 2 prior pivot points cited in ongoing analysis while it has rallied +22.8% from $12.85 when first featured in the 7/20/12 mid-day report (read here). It may go on to produce bigger gains, but keep in mind that the fact-based investment system argues for locking in gains when you have a solid +20% gain. Sometimes it is not worth it to stick around wait for sell signals and technical damage to mount, especially when the market direction is negative and the M criteria is arguing that 3 out of 4 stocks may be expected to decline.
The high-ranked leader hailing from the Banks - Southeast industry group reported earnings +70% on +39% sales revenues for the quarter ended June 30, 2012 versus the year ago period. Sequentially, its recent quarterly comparisons show encouraging sales revenues acceleration. It has earned high ranks and matches favorably with the C and A criteria. The number of top-rated funds owning its shares rose from 172 in Sep '11 to 183 in Sep '12, a slightly reassuring sign concerning the I criteria. Its current Up/Down Volume Ratio of 1.4 is an unbiased indication its shares have been under accumulation over the past 50 days. Its small supply (S criteria) of only 29.3 millions shares outstanding is a favorable characteristic, yet it can contribute to greater price volatility in the event of institutional accumulation or distributional pressure.
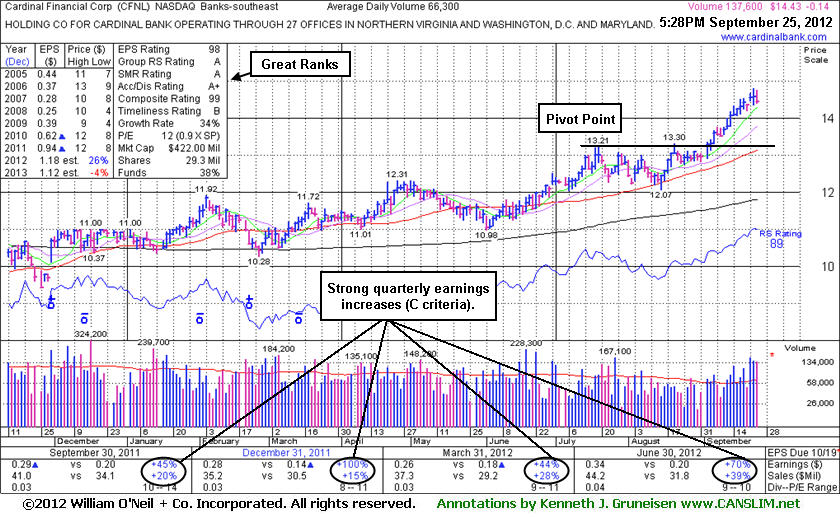
Extended From Prior Base Following Volume-Driven Gains - Tuesday, September 25, 2012
Cardinal Financial Corp (CFNL -$0.15 or -0.99% to $14.43) is perched at its 52-week high today. After its spurt of volume-driven gains it is extended from its prior base. Prior highs and its 50-day moving average (DMA) line define support to watch on pullbacks near the $13 level. It was last shown in this FSU section on 8/21/12 with an annotated graph under the headline, "High-Ranked Bank's Shares Quietly Challenge New Pivot Point ". Subsequent volume-driven gains above its pivot point confirmed a new (or add-on) technical buy signal.
The high-ranked leader hailing from the Banks - Southeast industry group reported earnings +70% on +39% sales revenues for the quarter ended June 30, 2012 versus the year ago period. Sequentially, its recent quarterly comparisons show encouraging sales revenues acceleration. It has earned high ranks and matches favorably with the C and A criteria. The number of top-rated funds owning its shares rose from 172 in Sep '11 to 183 in Jun '12, a reassuring sign concerning the I criteria. Its current Up/Down Volume Ratio of 2.1 is an unbiased indication its shares have been under accumulation over the past 50 days. Its small supply (S criteria) of only 29.2 millions shares outstanding is a favorable characteristic, yet it can contribute to greater price volatility in the event of institutional accumulation or distributional pressure.
High-Ranked Bank's Shares Quietly Challenge New Pivot Point - Tuesday, August 21, 2012
Cardinal Financial Corp (CFNL +$0.01 or +0.08% to $13.05) has tallied 5 consecutive gains with below average volume, and it challenged its pivot point today. No resistance remains due to overhead supply. A new pivot point was recently cited based on its 7/19/12 high after a short yet orderly base pattern. Subsequent volume-driven gains above its pivot point may trigger a new (or add-on) technical buy signal. It was last shown in this FSU section on 7/26/12 with an annotated graph under the headline, "Posted Volume-Driven Gain Following Strong Earnings." The high-ranked leader hailing from the Banks - Southeast industry group encountered some distributional pressure after first featured in the 7/20/12 mid-day report (read here). It found support near its prior highs and near its 50-day moving average (DMA) line last week, a reassuring sign.It reported earnings +70% on +39% sales revenues for the quarter ended June 30, 2012 versus the year ago period. Sequentially, its recent quarterly comparisons show encouraging sales revenues acceleration. It has earned high ranks and matches favorably with the C and A criteria. The number of top-rated funds owning its shares rose from 172 in Sep '11 to 185 in Jun '12, a reassuring sign concerning the I criteria. Its current Up/Down Volume Ratio of 2.0 is an unbiased indication its shares have been under accumulation over the past 50 days. Its small supply (S criteria) of only 29.2 millions shares outstanding is a favorable characteristic, yet it can contribute to greater price volatility in the event of institutional accumulation or distributional pressure.

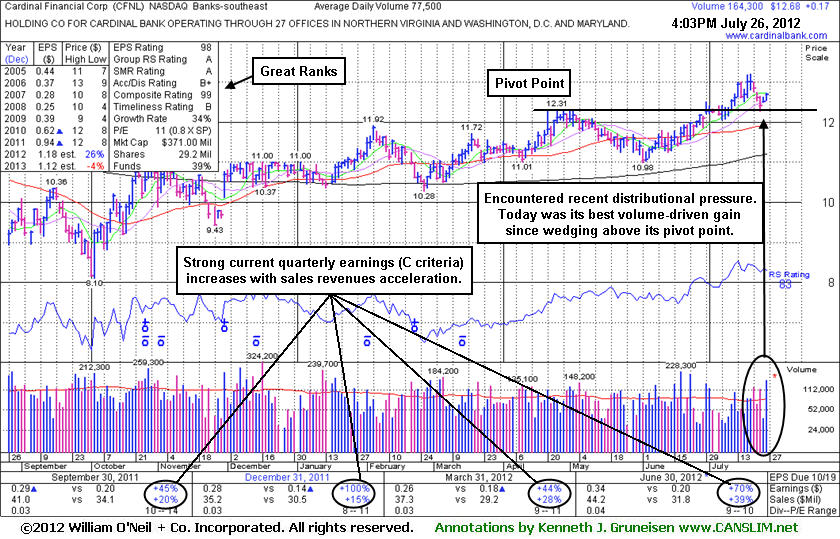
Posted Volume-Driven Gain Following Strong Earnings - Thursday, July 26, 2012
Cardinal Financial Corp (CFNL +$0.17 or +1.36% to $12.68) had encountered some distributional pressure since featured in the 7/20/12 mid-day report (read here). Today was its best volume-driven gain above its pivot point thus far, and no resistance remains due to overhead supply. It reported earnings +70% on +39% sales revenues for the quarter ended June 30, 2012 versus the year ago period. Sequentially, its recent quarterly comparisons show encouraging sales revenues acceleration. It has earned high ranks and matches favorably with the C and A criteria. The number of top-rated funds owning its shares rose from 172 in Sep '11 to 184 in Jun '12, a reassuring sign concerning the I criteria. Its current Up/Down Volume Ratio of 2.0 is an unbiased indication its shares have been under accumulation over the past 50 days. Its small supply (S criteria) of only 29.2 millions shares outstanding is a favorable characteristic, yet it can contribute to greater price volatility in the event of institutional accumulation or distributional pressure.
Careful investors may consider a tactic they teach in the Certification called "pyramiding" to let market action dictate buying efforts. One overriding concern, however, is that the M criteria now argues against any new buying efforts until the major averages confirm a new rally with another follow-through day.