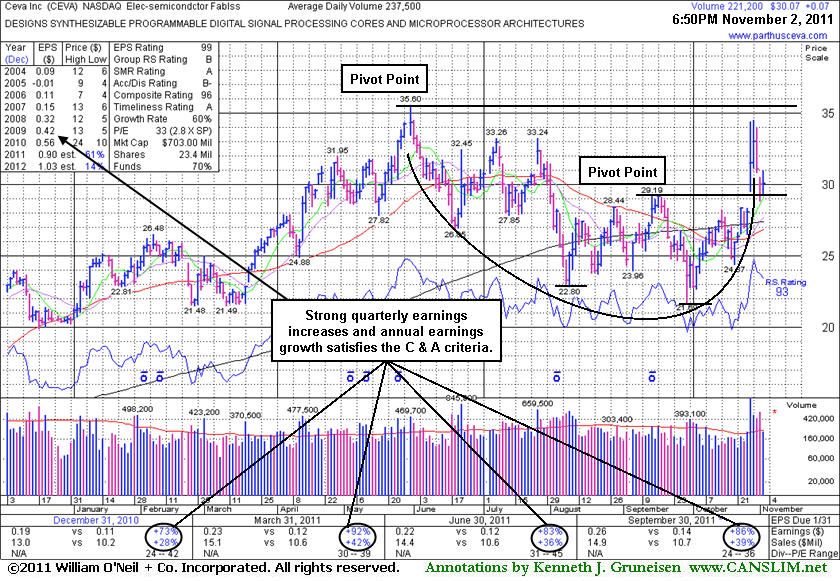
Following Double Bottom Perched Within Range of New Highs - Wednesday, November 02, 2011
Ceva Inc (CEVA +$0.07 or +0.23% to $30.07) quietly held its ground today after 2 consecutive losses on above average volume following 2 consecutive volume-driven gains. In the 10/28/11 mid-day report (read here) it was featured again in yellow with a pivot point based on its 52-week high plus 10 cents while rallying "straight up from the bottom" of a 22-week cup shaped base. Little overhead supply remains to act as resistance, but it has encountered distributional pressure since. Volume-driven gains above its pivot point are still needed to trigger a new (or add-on) technical buy signal. Disciplined investors always limit losses if any stock falls more than -7% from their purchase price.
Its last appearance in this FSU section was on 5/25/11 with an annotated graph under the headline, "Twice Average Volume Behind Technical Breakout." However it made only limited progress and was dropped from the Featured Stocks list on 6/17/11. Afterward it slumped below its 200-day moving average (DMA) line during its deep consolidation before recently rebounding impressively. It gapped up on 10/27/11 and broke out of a "double bottom" base pattern after reporting earnings +86% on +39% sales revenues for the quarter ended September 30, 2011 versus the year ago period. It has a good annual earnings (A criteria) history, and strong quarterly sales revenues and earnings increases satisfy the C criteria. However, Return On Equity is reported at 8%, below the 17% guideline. The number of top-rated funds owning its shares rose from 223 in Dec '10 to 292 in Sep '11, a very reassuring sign concerning the investment system's I criteria. Its current Up/Down Volume Ratio of 1.4 is also an unbiased indication of recent accumulation.
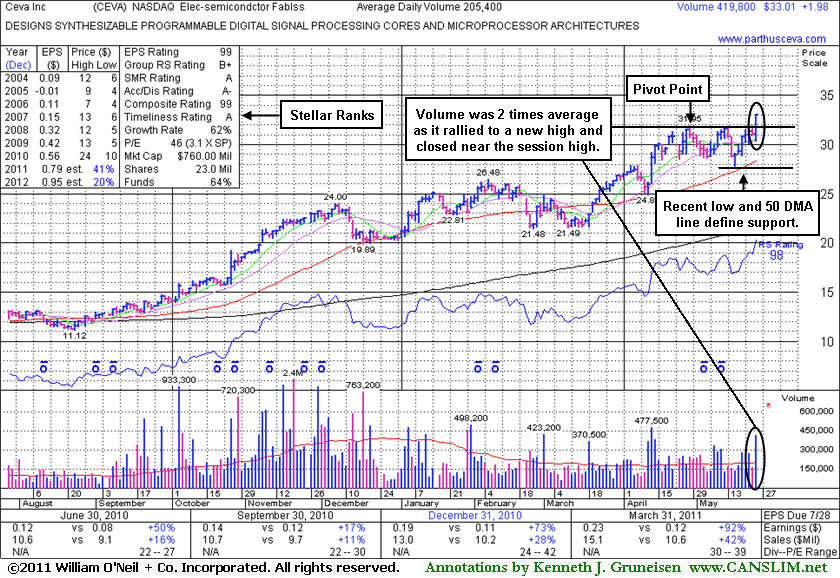
Twice Average Volume Behind Technical Breakout - Wednesday, May 25, 2011
As noted previously, the M criteria is an overriding concern arguing against new buying efforts until a follow-through day (FTD) from at least one of the major averages confirms a new rally. Disciplined investors may watch for an opportunity to accumulate shares in worthy buy candidates with the reassurance of a FTD or solid confirming gain from at least one of the major averages with heavier volume, and that gain should be coupled with an expansion in leadership (increase in the number of stocks hitting new 52-week highs).
Ceva Inc (CEVA +$1.98 or +6.38% to $33.01) hit a new 52-week high today with above average volume triggering a technical buy signal while rising clear of all resistance due to overhead supply. Its strong +92% earnings increase on +42% sales revenues for the March 31, 2011 ended quarter shows more impressive acceleration. Its color code was changed to yellow as it was featured in the mid-day report today (5/25/11 mid-day report - read here) with a pivot point of $32.05 based on a short "square box" type base pattern. It found support above its 50-day moving average (DMA) line when recently testing support near prior chart highs. It has a good annual earnings (A criteria) history. However, Return On Equity is reported at 8%, below the 17% guideline. The number of top-rated funds owning its shares rose from 203 in Sep '10 to 248 in Mar '11, a very reassuring sign concerning the investment system's I criteria. Its current Up/Down Volume Ratio of 2.5 is also an unbiased indication of recent accumulation.