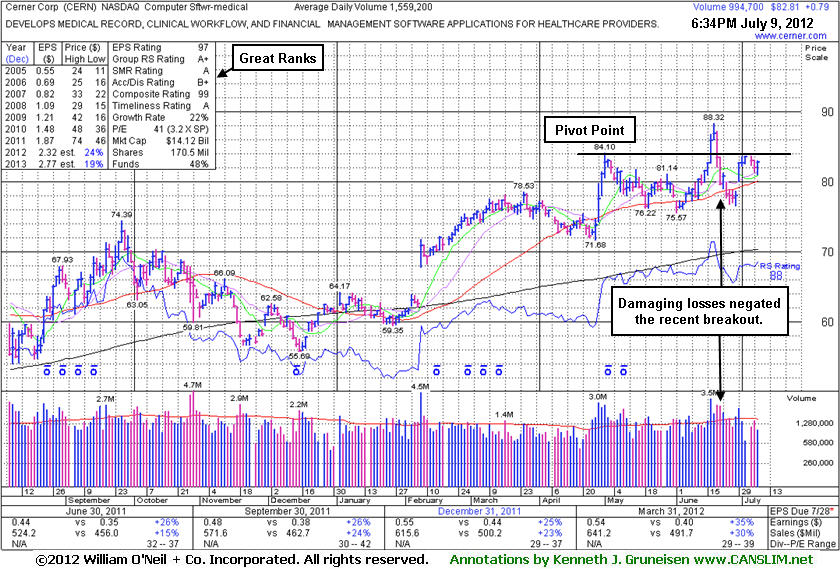
Its last appearance in this FSU section was on 6/07/12 with an annotated weekly graph under the headline, "Resilient Leader Forming New Base During Market Correction". Afterward, a volume-driven gain on 6/18/12 triggered a new (or add-on) technical buy signal. But subsequent losses negated the breakout and also undercut its 50 DMA line, likely triggering selling by disciplined investors who always limit losses by selling if any stock ever falls more than -7% from their purchase price.
The Computer Software - Medical firm has earned high ranks. Its quarterly sales revenues and earnings per share track record and its annual earnings history (C and A criteria) satisfy the investment system's fundamental guidelines. Sequentially, the recent quarterly comparisons show acceleration in its sales revenues growth rate, a reassuring sign of greater demand for its products and services. The number of top-rated funds owning its shares rose from 882 in Jun '11 to 1,034 in Mar '12, a reassuring sign concerning the I criteria. It is already heavily owned by the institutional crowd, yet its current Up/Down Volume Ratio of 1.7 is an unbiased indication that its shares have been under accumulation in the past 50 days.
When a leading stock which is already included on the Featured Stocks page is setting up with a new base, or when it is trading near a secondary buy point following an earlier breakout, the stock may be highlighted in yellow again as a "noteworthy" and potentially action-worthy buy candidate. The most relevant factors are noted in the report which alerts prudent CANSLIM oriented investors to place the issue in their watch list. After doing any necessary backup research, the investor is prepared to act after the stock triggers a technical buy signal (breaks above its pivot point on more than +50% average turnover) but before it gets too extended from a sound base. In the event the stock fails to trigger a technical buy signal and its price declines then it will simply be removed from the watch list.
Disciplined investors know that the M criteria can override all other favorable characteristics, as 3 out of 4 stocks tend to move in the direction of the major averages. During confirmed rallies only, investors know to buy fresh breakouts as near as possible to the pivot point and avoid chasing stocks after they have rallied more than +5% above their pivot point. It is crucial to always limit losses whenever any stock heads the wrong direction, and disciplined investors always sell if a struggling stock ever falls more than -7% from their purchase price.
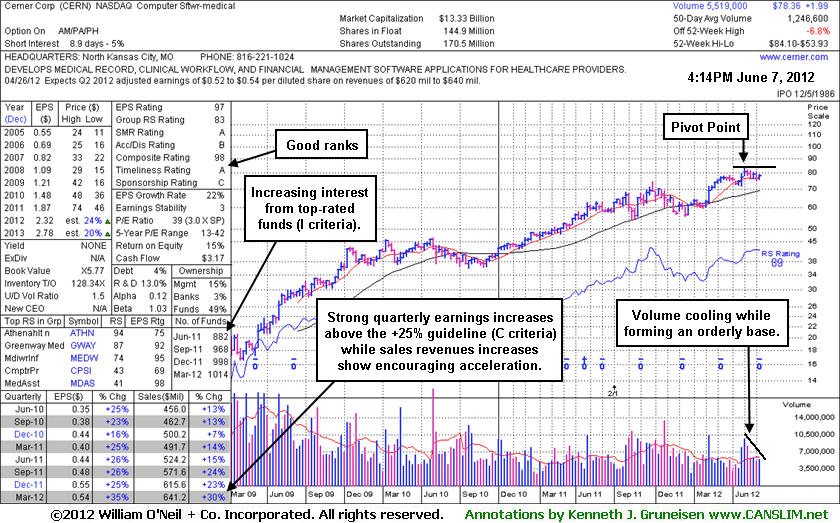
Cerner Corp (CERN +$0.14 or +0.18% to $78.36) finished near the session low today while posting a 4th consecutive gain. Gains backed by above average volume helped it rebound back above its 50-day moving average (DMA) line recently. A new pivot point has been cited based on its 5/01/12 high plus 10 cents. That day marked its last appearance in this FSU section under the headline, "Streak of Volume-Driven Gains Rallying Above "Max Buy" Level". Volume-driven gains are needed to trigger a new (or add-on) technical buy signal. Meanwhile, any damaging losses below its recent low ($75.57 on 6/01/12) would raise more serious concerns and trigger more worrisome technical sell signals. It has been encountering some distributional pressure recently, and the M criteria requires a FTD before any new buying efforts may be considered under the investment system's guidelines. Disciplined investors know there is no advantage to getting in "early" before a convincing buy signal has confirmed proof of fresh institutional accumulation driving share prices higher.
Little overhead supply remains to act as resistance while it is now -6.8% off its 52-week high and building on a 6-week flat base pattern (shown on its annotated weekly graph below) . The Computer Software - Medical firm's quarterly sales revenues and earnings per share track record and its annual earnings history (C and A criteria) satisfy the investment system's fundamental guidelines. Sequentially, the recent quarterly comparisons show acceleration in its sales revenues growth rate, a reassuring sign of greater demand for its products and services. The number of top-rated funds owning its shares rose from 882 in Jun '11 to 1,014 in Mar '12, a reassuring sign concerning the I criteria. It is already heavily owned by the institutional crowd, yet its current Up/Down Volume Ratio of 1.5 is an unbiased indication that its shares have been under accumulation in the past 50 days.
Often, when a leading stock is setting up to breakout of a solid base it is highlighted in CANSLIM.net's Mid-Day Breakouts Report. The most relevant factors are noted in the report which alerts prudent CANSLIM oriented investors to place the issue in their watch list. After doing any necessary backup research, the investor is prepared to act after the stock triggers a technical buy signal (breaks above its pivot point on more than +50% average turnover) but before it gets too extended from a sound base. In the event the stock fails to trigger a technical buy signal and its price declines then it will simply be removed from the watch list. Disciplined investors know to buy as near as possible to the pivot point and avoid chasing stocks after they have rallied more than +5% above their pivot point. It is crucial to always limit losses whenever any stock heads the wrong direction, and disciplined investors sell if a struggling stock ever falls more than -7% from their purchase price.
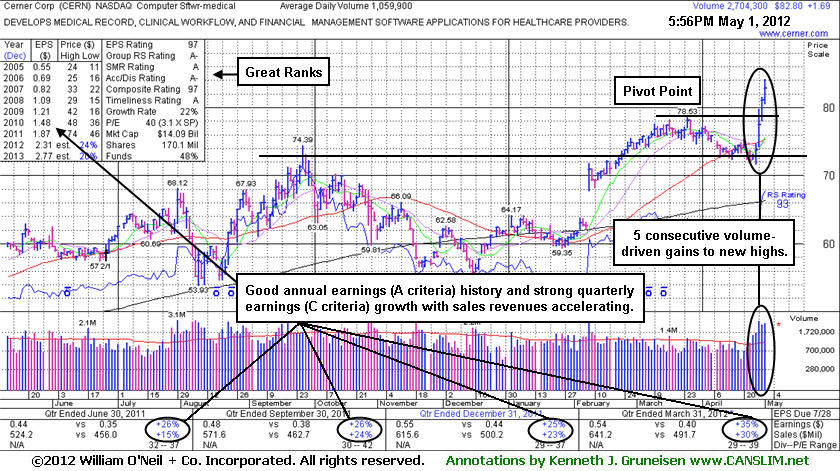
Cerner Corp (CERN +$1.69 or +2.08% to $82.80) rallied above its "max buy" level with today's 5th consecutive volume-driven gain and its color code was changed to green. No overhead supply remains to act as resistance. The Computer Software - Medical firm surged above the pivot point cited in the 4/27/12 mid-day breakouts report (read here) based on its 3/26/12 high plus 10 cents. Its quarterly sales revenues and earnings per share track record and its annual earnings history (C and A criteria) satisfy the investment system's fundamental guidelines. Sequentially, the recent quarterly comparisons show acceleration in its sales revenues growth rate, a reassuring sign of greater demand for its products and services. The number of top-rated funds owning its shares rose from 885 in Jun '11 to 997 in Mar '12, a reassuring sign concerning the I criteria. It is already heavily owned by the institutional crowd, yet its current Up/Down Volume Ratio of 1.9 is an unbiased indication that its shares have been under accumulation in the past 50 days. .
Cerner Corp. (CERN -$2.13 or -2.52% to $82.43) experienced a negative reversal on Wednesday after starting the day with gains. Negative reversals are bearish and are usually indicative of further negative action. Of course, there were a couple of earlier losses on heavy volume that had raised red flags right after the latest chart highs. Following Wednesday's weak close, more negative action occurred on Thursday as the price broke below its well defined upward trend line (connectingn at least three prior chart lows) on above average volume. It also violated and closed below its 50-day moving average (DMA) line. This combination of technical sell signals paints an extremely ominous picture.
CERN was most recently featured in yellow at $81.12 in CANSLIM.net's Mid-Day BreakOuts Report on September 6th, 2005 with an annotated DailyGraph(R) (see here). Concern definitely increases whenever a stock negatively reverses on above average volume and breaks its upward trend line and 50 DMA on higher trade. Only a prompt repair of the violations and gains on heavier volume would improve the outlook. Meanwhile, with respect to the stock's negative action, and the negative action in the broader market, investors should be very watchful and protective of their investment capital.
Charts courtesy www.stockcharts.com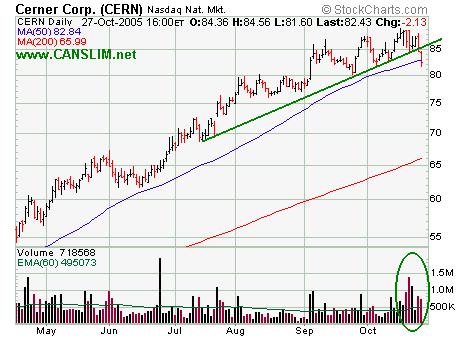
C A N S L I M, StockTalk, News, Chart, SEC, Zacks Reports
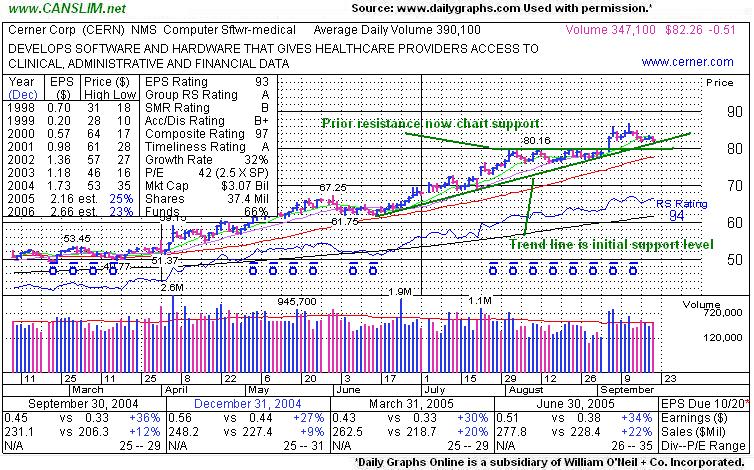
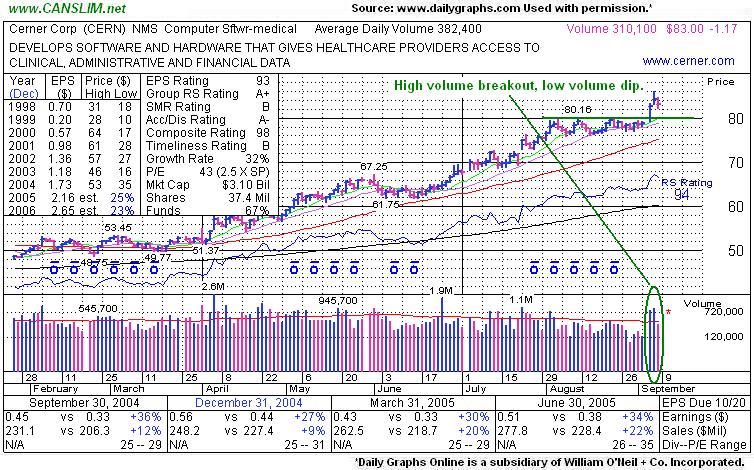
Cerner Corp (CERN -$1.17, or -1.39%, to $83.00) was featured earlier this week, on Tuesday, September 6th, as it broke out on above average volume and closed at a new 52-week high (see here). It quickly rose beyond the prior chart highs and above its pivot point by greater than 5%+, thus the stock's price was getting extended beyond proper buy guidelines. That said, the pullback on below average volume may be offering investors a second chance to enter new long positions without chasing the stock up in price. An overwhelming majority of stocks fall back toward their pivot points after breaking out, before many of them ultimately end up moving much higher.
CERN has been in a well-defined upward trend since its early-April breakout. It blasted out of a long flat base on April 6th with volume more than 8+ times average, immediately following through after posting a new high close on heavier than average volume the day prior. After August 2nd it leveled off and formed a tight flat 5-week base, consolidating on below average volume. It is very healthy to see a stock pause and consolidate on below average volume before reasserting itself and moving higher.