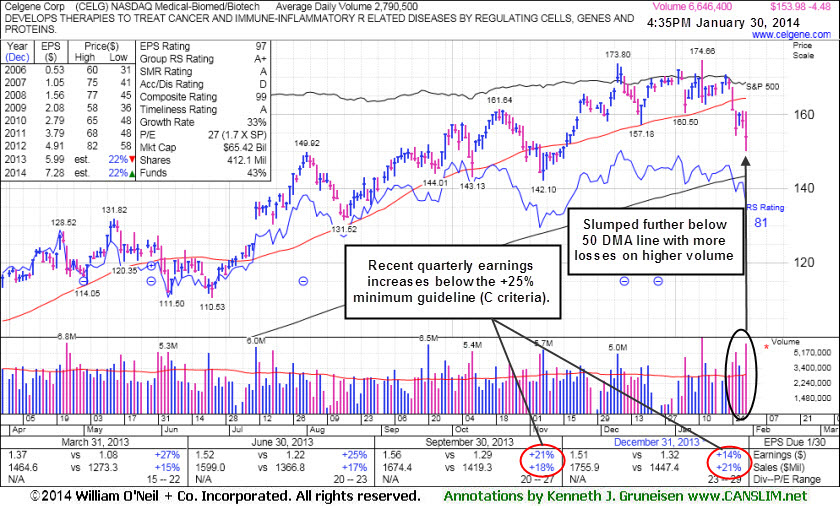
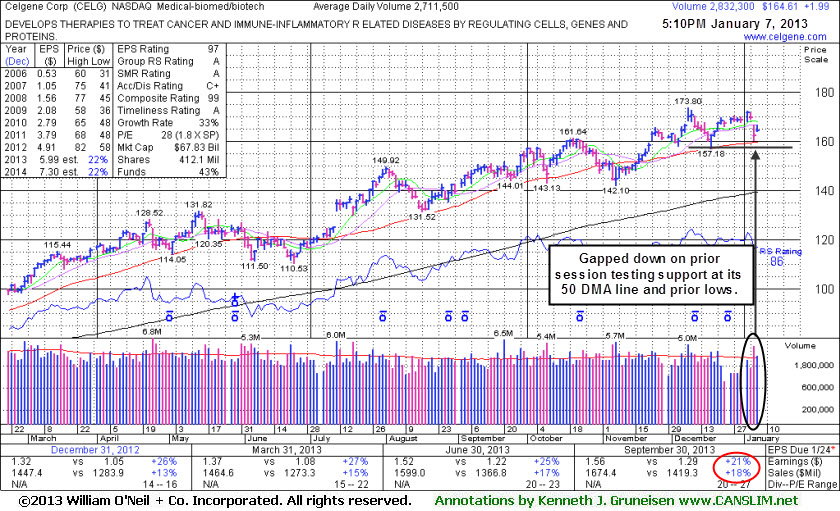
CELG's last appearance in this FSU section was on 1/07/14 with annotated graphs under the headline, "Found Support Above 50-Day Average After Gapping Down on Prior Session". At that time members were cautioned - "Fundamental flaws may be considered an over-riding concern arguing against new buying efforts. It reported earnings +21% on +18% sales revenues for the Sep '13 quarter. below the +25% minimum guideline (C criteria) - (see red circle on daily graph). Its C+ rating for Accumulation/Distribution is also cause for some concern."
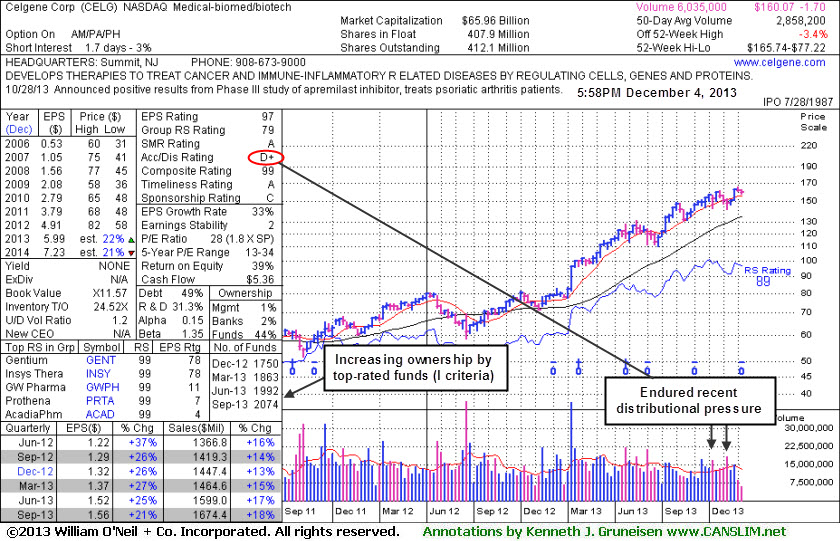
The number of top-rated funds owning its shares rose from 1,856 in Mar '13 to 2,037 in Dec '13, a reassuring trend concerning the I criteria. However, the company is already well-known by the institutional crowd, and that means that very few are likely to just be discovering it.
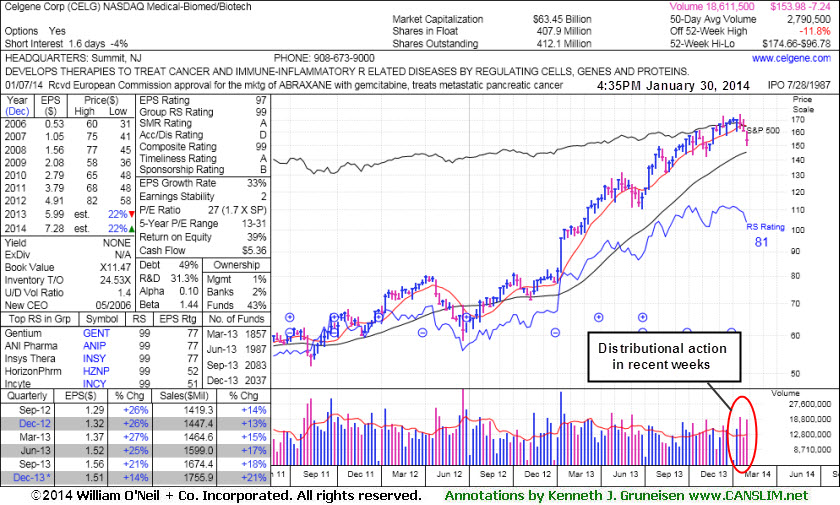
Celgene Corp (CELG +$1.99 or +1.22% to $164.61) is consolidating -5.3% off its 52-week high. On the prior session it gapped down for a loss on higher volume slumping near its 50-day moving average (DMA) line and prior lows which define important near-term support to watch. Subsequent violations would raise greater concerns and trigger technical sell signals.
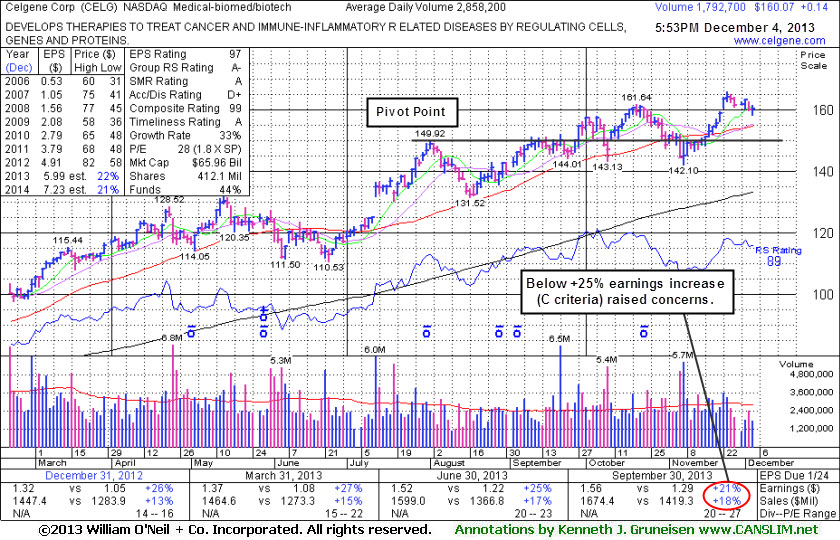
It blasted higher with heavy volume behind gains to new 52-week and all-time highs after its last appearance in this FSU section on 12/04/13 with an annotated graph under the headline, "Cooling Volume Totals While Hovering Near Highs". Fundamental flaws may be considered an over-riding concern arguing against new buying efforts. It reported earnings +21% on +18% sales revenues for the Sep '13 quarter. below the +25% minimum guideline (C criteria) - (see red circle on daily graph). Its C+ rating for Accumulation/Distribution is also cause for some concern.
The number of top-rated funds owning its shares rose from 1,856 in Mar '13 to 2,035 in Dec '13, a reassuring trend concerning the I criteria. However, the company is already well-known by the institutional crowd, and that means that very few are likely to just be discovering it.
CELG has made limited progress above the pivot point long ago cited based on its 8/01/13 high. It technically broke out of another short flat base that formed but no new pivot point was cited. Fundamental flaws may be considered an over-riding concern arguing against new buying efforts. It reported earnings +21% on +18% sales revenues for the Sep '13 quarter. below the +25% minimum guideline (C criteria) - (see red circle on daily graph).
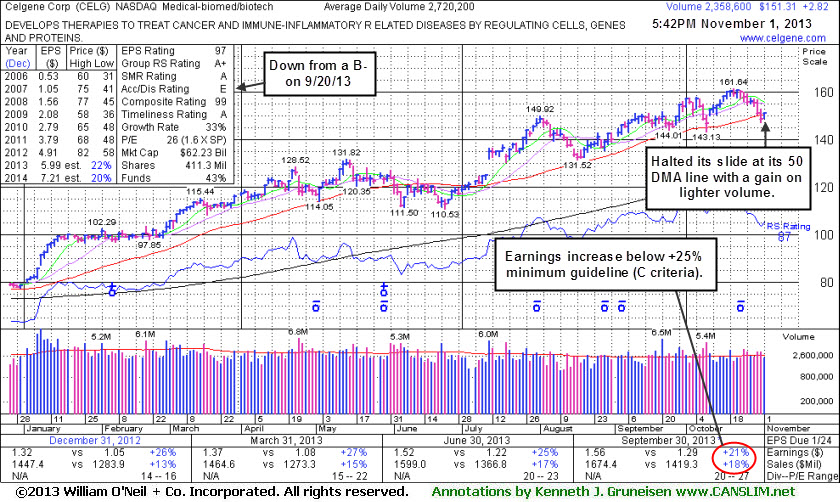
After its last appearance in this FSU section on 11/01/13 with an annotated graph under the headline, "Testing 50-Day Average Following Sub Par Earnings Increase", subsequent technical sell signals were noted. However, it halted its slide with a gain on 11/07/13 backed by heavier volume (5.7 million shares traded) and after it rebounded above its 50-day moving average its outlook continued improving. While any stock that is sold can always be bought back later if strength returns, investors owning it now may continue give it the benefit of the doubt while being on the watch for any weakness or noted technical sell signals.
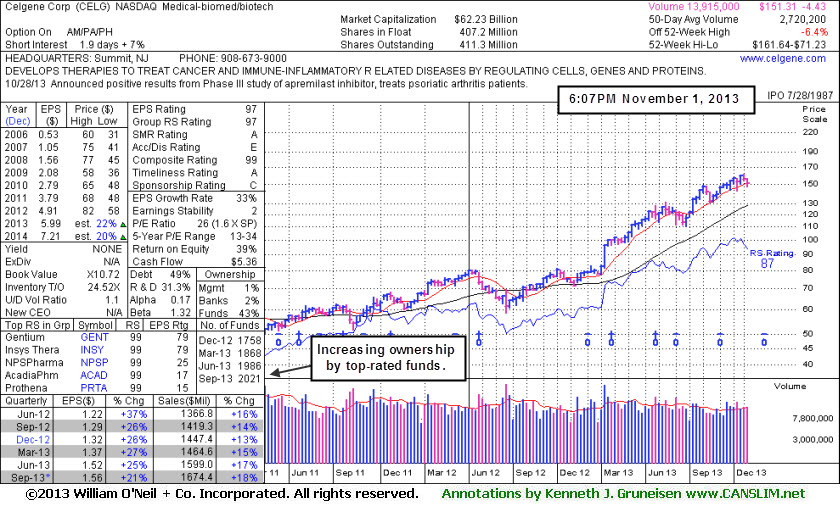
The number of top-rated funds owning its shares rose from 1,623 in Dec '11 to 2,074 in Sep '13, a reassuring trend concerning the I criteria. However, the company is already well-known by the institutional crowd, and that means that very few are likely to just be discovering it. The concern is only great if it shows any sign of technical weakness
CELG was last shown in this FSU section on 9/20/13 with an annotated graph under the headline, "Volume-Driven Gain Challenging New Pivot Point", tallying a gain with volume more than 2 times average. After additional volume-driven gains for new highs it encountered distributional pressure, however, and the stock's Accumulation/ Distribution Rating has slumped to an E from a B-
The number of top-rated funds owning its shares rose from 1,623 in Dec '11 to 2,021 in Sep '13, a reassuring trend concerning the I criteria. However, the company is already well-known by the institutional crowd, and that means that very few are likely to just be discovering it.
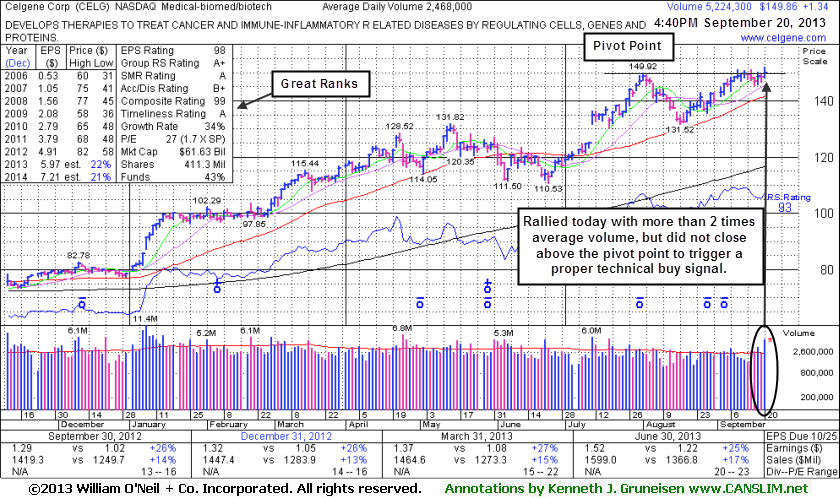
Celgene Corp (CELG +$1.27 or +0.86% to $149.79) hit a new 52-week high today with volume more than 2 times average. It traded above the new pivot point cited based on its 8/01/13 high plus 10 cents, but it encountered some distributional pressure and ended the session below is pivot point. Additional volume-driven gains and a strong finish above the pivot point may help to clinch a proper new (or add-on) technical buy signal. It formed an orderly base-on-base type pattern. Its 50-day-moving average (DMA) line defines important chart support. CELG was last shown in this FSU section on 8/21/13 with an annotated graph under the headline, "Consolidating Above Prior Highs and 50-Day Moving Average". The high-ranked Medical - Biomed/Biotech firm reported earnings +25% on +17% sales revenues for the Jun '13 quarter versus the year ago period, maintaining its strong earnings history (C and A criteria).
The stock's Accumulation/ Distribution Rating is a B+. Its current Up/Down Volume Ratio of 1.5 is an unbiased bullish indication its shares have been under accumulation over the past 50 days. The number of top-rated funds owning its shares rose from 1,623 in Dec '11 to 1,983 in Jun '13, a reassuring trend concerning the I criteria. However, the company is already well-known by the institutional crowd, and that means that very few are likely to just be discovering it.
Pay close attention to stocks that hold up well during corrections and watch for those that are the first ones breaking into new high ground upon any new confirmed rally. Meanwhile, if holding onto current gains, investors should stand ready to reduce exposure before too much damage starts to mount. Disciplined investors always limit losses by selling any stock that falls more than -7% from their purchase price, but sometimes weak technical action may hint that it is a smart time to sell even before losses reach that important maximum loss threshold.
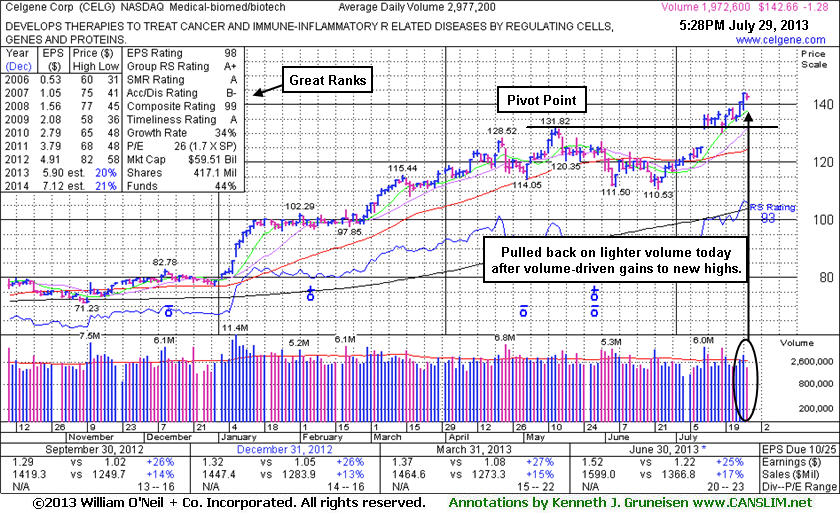
CELG was last shown in this FSU section on 7/29/13 with an annotated graph under the headline, "Extended from Prior Base Following Volume-Driven Gains". CELG reported earnings +25% on +17% sales revenues for the Jun '13 quarter versus the year ago period, maintaining its strong earnings history (C and A criteria). The stock's Accumulation/ Distribution Rating is a B- and it has earned high ranks. The number of top-rated funds owning its shares rose from 1,623 in Dec '11 to 1,963 in Jun '13, a reassuring trend concerning the I criteria. However, the company is already well-known by the institutional crowd, and that means that very few are likely to just be discovering it.
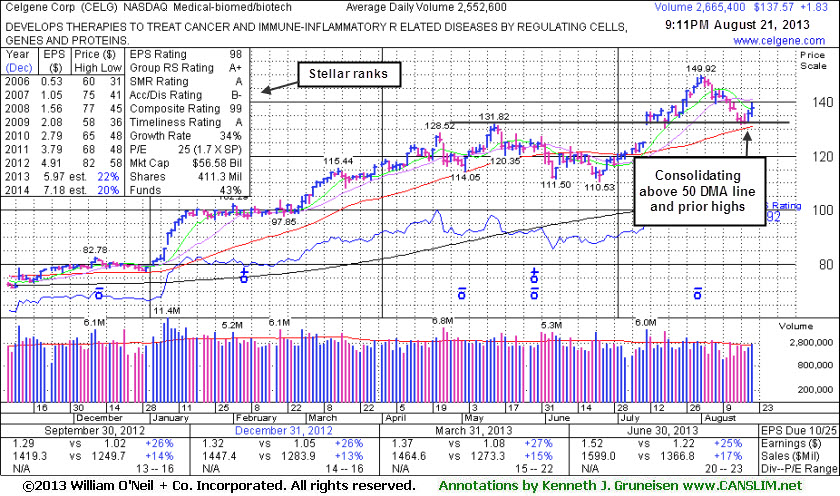
Celgene Corp (CELG -$1.28 or -0.89% to $142.66) ended with a small loss on light volume today following solid gains and a best-ever close with above average volume last week. Prior highs define initial support to watch in the $131 area. It has tallied 5 consecutive weekly gains and it found support when consolidating above prior highs following its "breakaway gap" when last shown in this FSU section on 7/11/13 with an annotated graph under the headline, "Finished Strong After Breakaway Gap to a New 52-Week High". Members were reminded - "Today's technical buy signal was coupled with strong action in the broader market (M criteria) which encourages investors to increase their buying efforts in worthy looking candidates." It had convincingly cleared the pivot point based on its 5/14/13 high plus 10 cents which was cited in the 7/11/13 mid-day report (read here) after it gapped up. A technical buy signal was triggered by its considerable gain backed by twice its average daily trading volume.
CELG reported earnings +25% on +17% sales revenues for the Jun '13 quarter versus the year ago period, maintaining its strong earnings history (C and A criteria). The stock's Accumulation/ Distribution Rating has been improving and it has earned high ranks. The number of top-rated funds owning its shares rose from 1,623 in Dec '11 to 1,903 in Jun '13, a reassuring trend concerning the I criteria. However, the company is already well-known by the institutional crowd, and that means that very few are likely to just be discovering it. Disciplined investors avoid chasing extended stocks and they always limit losses by selling is any stock falls more than -7% from their purchase price.
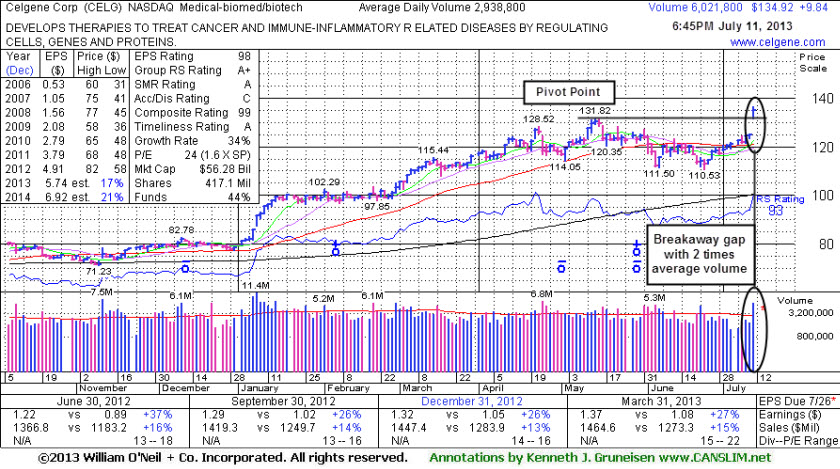
Celgene Corp (CELG +$9.84 or +7.87% to $134.92) was highlighted in yellow with new pivot point based on its 5/14/13 high plus 10 cent in the earlier mid-day report (read here). It gapped up today and triggered a technical buy signal with a strong finish after hitting a new 52-week high as its considerable gain was backed by twice its average daily trading volume. It rebounded above its 50-day moving average (DMA) line with recent gains lacking great volume conviction but nonetheless helping its technical stance improve. The high-ranked Medical - Biomed/Biotech firm had been sputtering since dropped from the Featured Stocks list on 6/05/13 when last shown in this FSU section under the headline, "Following 50-Day Moving Average Violation More Damage Mounts". At the time, members were reminded - "Any stock that is sold can always be bought back later if strength returns."
The stock's Accumulation/ Distribution Rating has improved to a C from a D+ rating in the interim. Today's technical buy signal was coupled with strong action in the broader market (M criteria) which encourages investors to increase their buying efforts in worthy looking candidates. CELG has maintained a strong earnings history (C and A criteria), and it recently reported earnings +27% on +15% sales revenues for the Mar '13 quarter. The number of top-rated funds owning its shares rose from 1,623 in Dec '11 to 1,850 in Jun '13, a reassuring trend concerning the I criteria. However, the company is already well-known by the institutional crowd, and that means that very few are likely to just be discovering it.
The bullish action today also came on the heels of encouraging headlines (read here) concerning one of its cancer treatments, Revlimid, which met its goal in stopping the spread of multiple myeloma when used with the steroid dexamethasone.
While CELG may go on to consolidate and form a new base, a rebound above its 50 DMA line is obviously needed for its outlook to improve. CELG has maintained a strong earnings history (C and A criteria), and it recently reported earnings +27% on +15% sales revenues for the Mar '13 quarter. The number of top-rated funds owning its shares rose from 1,623 in Dec '11 to 1,834 in Mar '13, a reassuring trend concerning the I criteria. However, the company is already well-known by the institutional crowd, and that means that very few are likely to just be discovering it. Some have clearly decided to lock in profits from what this chart is telling us this week, whether it is due to concerns with respect to the broader market or the individual company. Since 3 out of 4 stocks follow the direction of the broader market averages (M criteria), chances may not be good for most stocks to make progress if the market falls into a more serious correction.
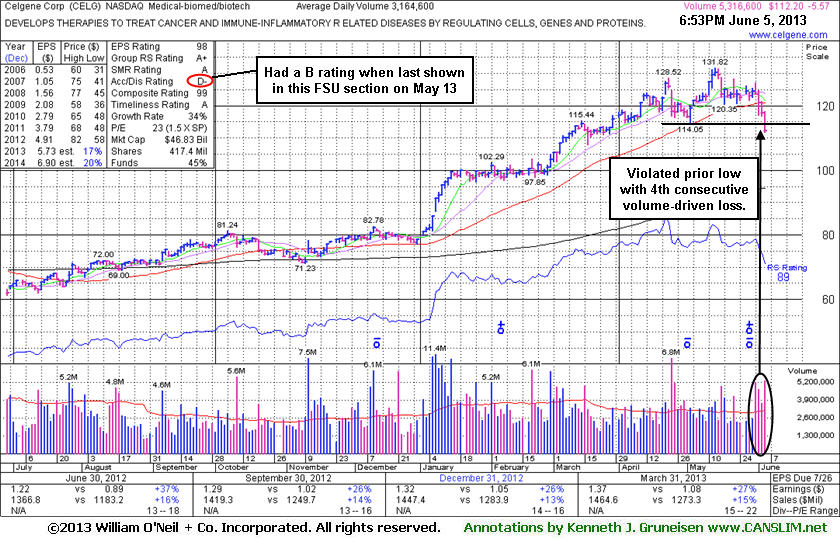
Celgene Corp (CELG +$2.20 or +1.73% to $129.66) rallied to another new high close with its 2nd consecutive big gain with volume slightly above average, getting more extended from any sound base pattern. It found support near its short-term average as it endured some distributional pressure recently. The recent low ($114.05 on 5/02/13) defines important chart support just below its 50-day moving average (DMA) line where subsequent violations may trigger technical sell signals.
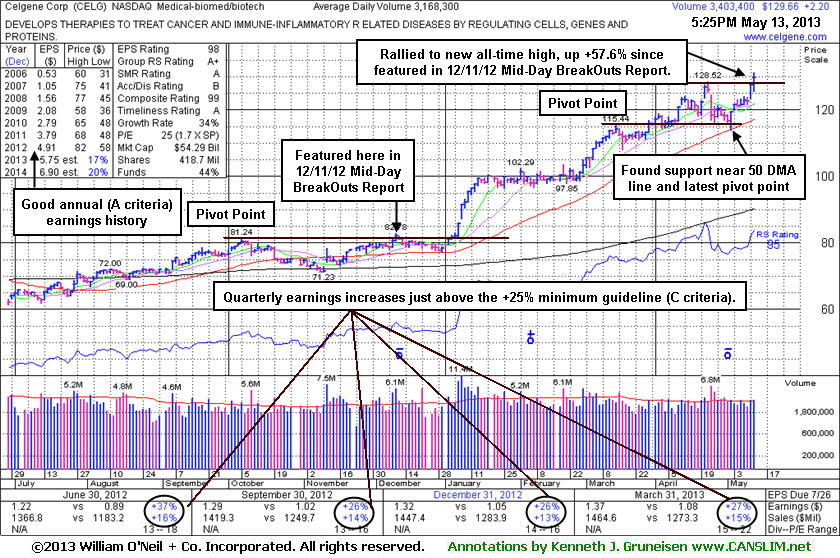
It rallied to new highs following its last appearance in this FSU section on 4/19/13 with an annotated graph under the headline, "Perched Near All-Time High After Recent Gains Lacked Great Volume", eventually distancing itself from an advanced "3-weeks tight" base noted earlier. It has traded up as much as +57.6% since it was highlighted in yellow long ago in the 12/11/12 Mid-day BreakOuts Report. While it may go on to produce more climactic gains, keep in mind that after its considerable rally in prior months, its latest rally came from what was considered to be a riskier "late-stage" base. CELG has maintained a strong earnings history (C and A criteria), and it recently reported earnings +27% on +15% sales revenues for the Mar '13 quarter. The number of top-rated funds owning its shares rose from 1,623 in Dec '11 to 1,804 in Mar '13, a reassuring trend concerning the I criteria. However, the company is already well-known by the institutional crowd.
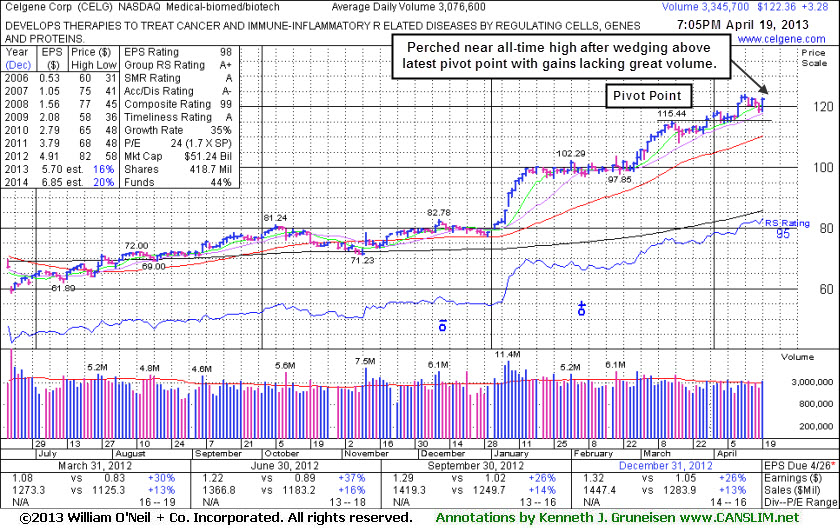
Celgene Corp (CELG +$3.28 or +2.75% to $122.36) is consolidating above its "max buy" level, holding its ground after wedging to new highs from an advanced "3-weeks tight" base with only average volume behind its recent gains. Its 50-day moving average (DMA) line defines important near-term support to watch. Its last appearance in this FSU section on 3/28/13 with an annotated graph under the headline, "Gains Lacked Volume While Wedging From Advanced "3-Weeks Tight" Pattern". Disciplined investors know that volume-driven gains above the pivot point are necessary to trigger a proper technical buy signal, and the minimum volume required behind a gain is +40% above average. The volume requirement is important because the market's best winners really had the look of institutional accumulation, the kind of heavy buying demand that can lead to a sustained and meaningful advance in share prices. While it may go on to produce more climactic gains, keep in mind that after its considerable rally in prior months, it may also be fair to consider it a riskier "late-stage" base.
CELG has maintained a strong earnings history (C and A criteria), and it recently reported earnings +26% on +13% sales revenues for the Dec '12 quarter. The number of top-rated funds owning its shares rose from 1,623 in Dec '11 to 1,791 in Mar '13, a reassuring trend concerning the I criteria. However, the company is already well-known by the institutional crowd. Its 50-day moving average (DMA) line defines important support to watch on pullbacks. It has not tested that short-term averages since finding support there in late December before embarking on a considerable winning streak.
Bullish action has continued since its last appearance in this FSU section on 2/28/13 with an annotated graph under the headline, "Extending Gains After Holding Firm Ground". The Medical -Biomed/Biotech firm has rewarded patient investors since they were reminded on 1/17/13 with an annotated graph under the headline, "Rule Suggests Letting Explosive Winners Have Time For Greater Gains", as it was noted - "Having quickly rallied more than +20% in the first 2-3 weeks after its technical breakout, the investment system rules suggest holding such explosive winners for a minimum of 8 weeks to allow for potentially greater gains. Disciplined investors never hold any stock if it fails badly however, or if it falls more than -7% from their purchase price."
CELG has maintained a strong earnings history (C and A criteria), and it recently reported earnings +26% on +13% sales revenues for the Dec '12 quarter. The number of top-rated funds owning its shares rose from 1,623 in Dec '11 to 1,742 in Dec '12, a reassuring trend concerning the I criteria. However, the company is already well-known by the institutional crowd. Its 50-day moving average (DMA) line defines important support to watch on pullbacks. It has not tested that short-term averages since finding support there in late December before embarking on a considerable winning streak.
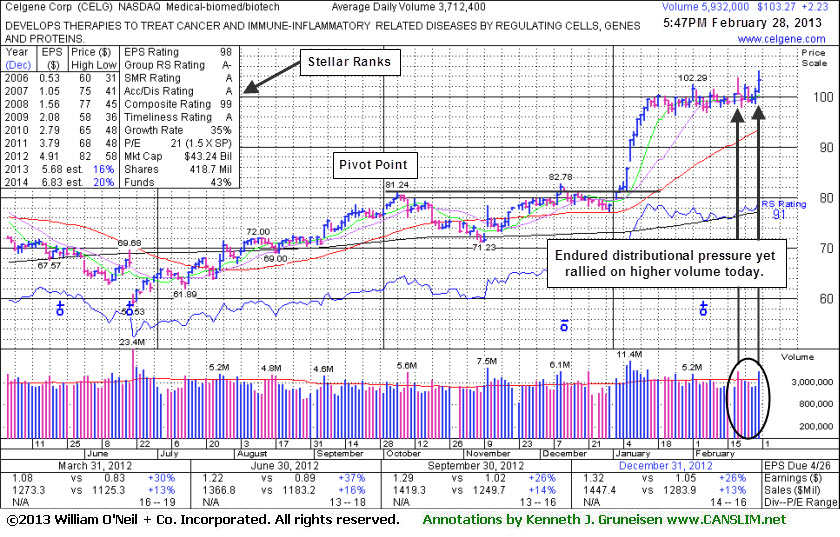
Celgene Corp (CELG +$2.23 or +2.21% to $103.27) held its ground in a tight range in recent weeks but did not form a sound base pattern before spiking to a new all-time high with today's volume-driven gain. Recent lows in the $96 area define near-term support above its 50-day moving average (DMA) line. The Medical -Biomed/Biotech firm's last appearance in this FSU section was on 2/04/13 with an annotated graph under the headline, "Extended From Prior Base Following Bullish Action."
Technically, it is very extended from its prior base. It has rewarded patient investors since they were reminded on 1/17/13 with an annotated graph under the headline, "Rule Suggests Letting Explosive Winners Have Time For Greater Gains", as it was noted - "Having quickly rallied more than +20% in the first 2-3 weeks after its technical breakout, the investment system rules suggest holding such explosive winners for a minimum of 8 weeks to allow for potentially greater gains. Disciplined investors never hold any stock if it fails badly however, or if it falls more than -7% from their purchase price."
CELG has maintained a strong earnings history (C and A criteria), and it recently reported earnings +26% on +13% sales revenues for the Dec '12 quarter. The number of top-rated funds owning its shares rose from 1,623 in Dec '11 to 1,733 in Dec '12, a reassuring trend concerning the I criteria. Its current Up/Down Volume Ratio of 1.4 also still offers an unbiased indication its shares have been under accumulation over the past 50 days. However, the company is already well-known by the institutional crowd.
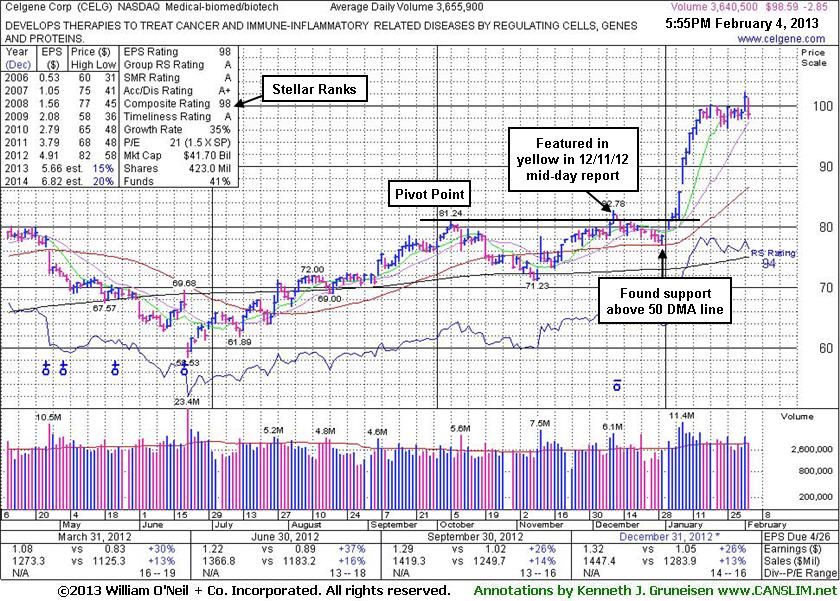
Celgene Corp (CELG -$2.85 or -2.81% to $98.59) pulled back today from new 52-week and all-time highs hit on the prior session with a volume-driven gain. It recently hovered in a tight range near its all-time high, but did not form a base of sufficient length. Technically, it is very extended from its prior base, as shown on the annotated weekly graph below.
The Medical -Biomed/Biotech firm's last appearance in this FSU section was on 1/17/13 with an annotated graph under the headline, "Rule Suggests Letting Explosive Winners Have Time For Greater Gains". It was then holding its ground near its 52-week high following a streak of 11 consecutive gains marked by above average volume. It has been 5 weeks since it technically broke out with confirming gains on heavy volume on 1/07/13. The prior analysis noted - "Having quickly rallied more than +20% in the first 2-3 weeks after its technical breakout, the investment system rules suggest holding such explosive winners for a minimum of 8 weeks to allow for potentially greater gains. Disciplined investors never hold any stock if it fails badly however, or if it falls more than -7% from their purchase price."
CELG has maintained a strong earnings history (C and A criteria), and it recently reported earnings +26% on +13% sales revenues for the Dec '12 quarter. The number of top-rated funds owning its shares rose from 1,623 in Dec '11 to 1,692 in Dec '12, a reassuring trend concerning the I criteria. Its current Up/Down Volume Ratio of 1.8 also offers an unbiased indication its shares have been under accumulation over the past 50 days. However, the company is already well-known by the institutional crowd.
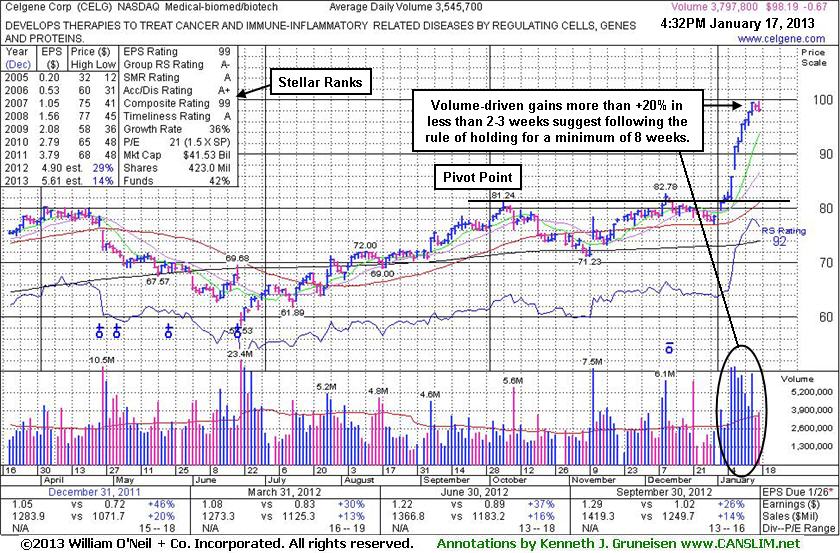
Celgene Corp (CELG -$0.67 or +0.68% to $98.19) is holding its ground near its 52-week high following a streak of 11 consecutive gains marked by above average volume. It is very extended from its prior base. Having quickly rallied more than +20% in the first 2-3 weeks after its technical breakout, the investment system rules suggest holding such explosive winners for a minimum of 8 weeks to allow for potentially greater gains. Disciplined investors never hold any stock if it fails badly however, or if it falls more than -7% from their purchase price.
CELG has maintained a strong earnings history (C and A criteria). Watch for the company to make its latest quarterly earnings report before the open on January 24, 2013, and note that volume and volatility often increase near earnings news.
The Medical -Biomed/Biotech firm's last appearance in this FSU section was on 1/03/13 with an annotated graph under the headline, "RS Rating Waning While Perched Near High". Buy candidates should have a RS rank of 80+, so it was noted that the sub par rank then argued against new buying efforts, however the bullish action in the days that followed helped its RS rank quickly ratchet higher and it is currently sporting a 92 RS rank.
The number of top-rated funds owning its shares rose from 1,623 in Dec '11 to 1,681 in Sep '12, a reassuring trend concerning the I criteria. Its current Up/Down Volume Ratio of 2.3 also offers an unbiased indication its shares have been under accumulation over the past 50 days. However, the company is already well-known by the institutional crowd.
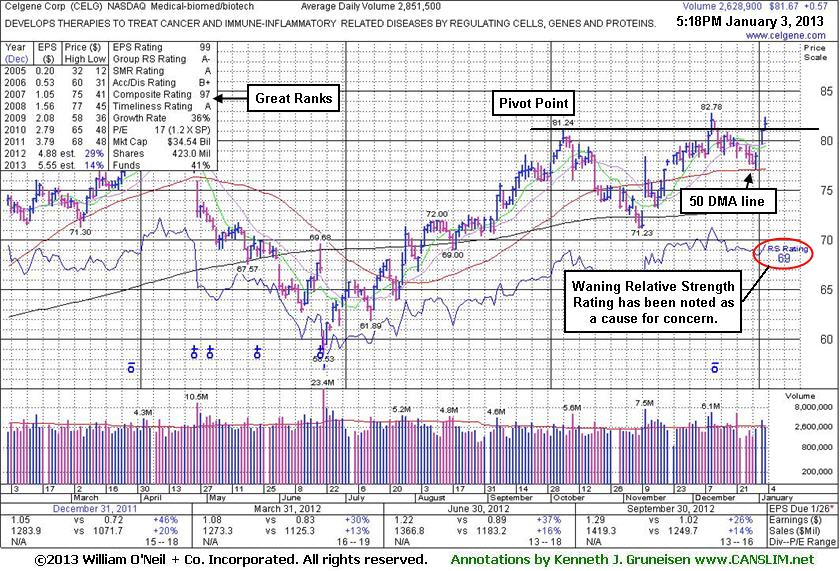
Celgene Corp (CELG +$0.57 or +0.70% to $81.67) posted a gain today on near average volume. On the prior session it gapped up and tallied a solid gain with slightly above average volume, rallying back near its pivot point. Its 50-day moving average (DMA) line acted as support during the recent consolidation following its earlier breakout. However, its waning Relative Strength Rating (see red circle) has been noted as cause for some concern. The graph below shows that its RS line was plotted higher a couple of weeks ago, and it was plotted even higher still back in April. Based on historic studies it is preferred that the RS line provide confirmation, so it is usually best to see a stock's RS line lead the way by moving into new high territory prior to the share price also rising into new high territory. Buy candidates should have a RS rank of 80+, so the sub par rank actually argues against new buying efforts.
Its last appearance in this FSU section was on 12/12/12 with an annotated graph under the headline, "Pulled Back Following Technical Breakout". On the prior session it had been highlighted in yellow with pivot point cited based on its 10/05/12 high plus 10 cents in the mid-day report (read here). It finished that session above its pivot point with a gain backed by +128% above average volume as it rallied for a new 52-week high and clinched a technical buy signal. As always, disciplined investors limit losses if any stock ever falls more that -7% from their buy point. Healthy stocks do not normally retreat more than -7% below their pivot point, and during its consolidation that sell rule would not have been triggered because it avoided a deeper pullback.
The number of top-rated funds owning its shares rose from 1,623 in Dec '11 to 1,654 in Sep '12, a somewhat reassuring trend concerning the I criteria. However, the company is already well-known by the institutional crowd. CELG maintained a strong earnings history (C and A criteria).
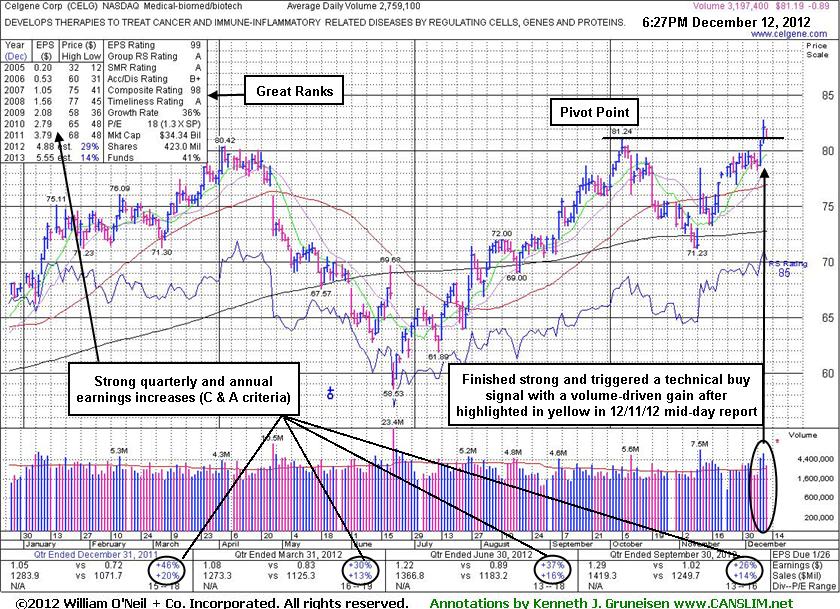
Celgene Corp (CELG -$0.89 or -1.08% to $81.19) ended the session just below its pivot point with a loss with +16% above average volume. On the prior session it was highlighted in yellow with pivot point cited based on its 10/05/12 high plus 10 cents in the mid-day report (read here). It finished that session above its pivot point with a gain backed by +128% above average volume as it rallied for a new 52-week high and clinched a technical buy signal. As always, disciplined investors limit losses if any stock ever falls more that -7% from their buy point.
Investors are often wise to use the tactical approach called "pyramiding" to accumulate shares and avoid chasing a stock too far above its pivot point while waiting for the volume to help clinch the technical buy signal. Heavy volume behind a breakout gain is still no guarantee that a stock with produce great gains, but it is a convincing and very reassuring sign of the truly great institutional demand necessary for a sustainable and meaningful price advance. Bullish market environments often offer multiple opportunities to accumulate the same high-ranked company's shares within the fact-based system's guidelines.
The number of top-rated funds owning its shares rose from 1,623 in Dec '11 to 1,686 in Sep '12, a somewhat reassuring trend concerning the I criteria. However, the company is already well-known by the institutional crowd. CELG maintained a strong earnings history (C and A criteria) after its last appearance in this FSU section on 3/26/12 with an annotated graph under the headline, "Volume Near Average While Rallying to New Highs". It was later noted when technical damage started to mount and it was dropped from the Featured Stocks list on 5/04/12, then went through a deeper consolidation below its 200-day moving average (DMA) line before rebounding impressively. However, it stalled near prior resistance in the $80 and tested its 200 DMA line again before the latest rally to new high territory.
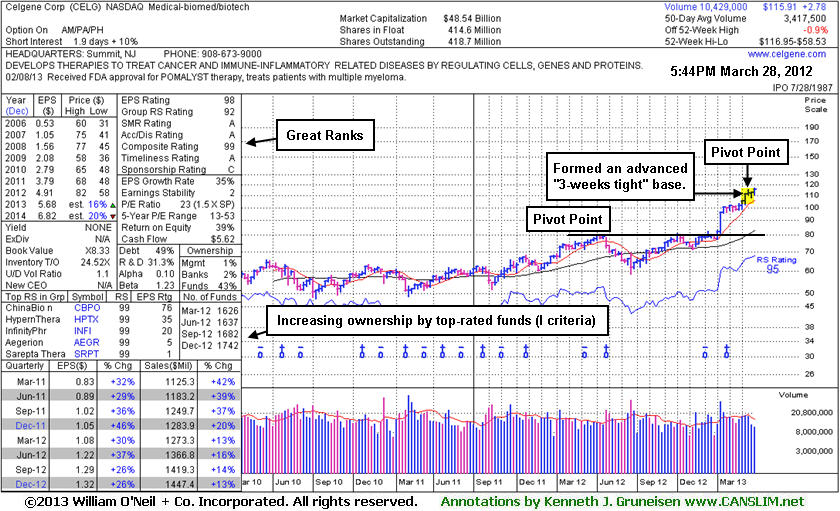
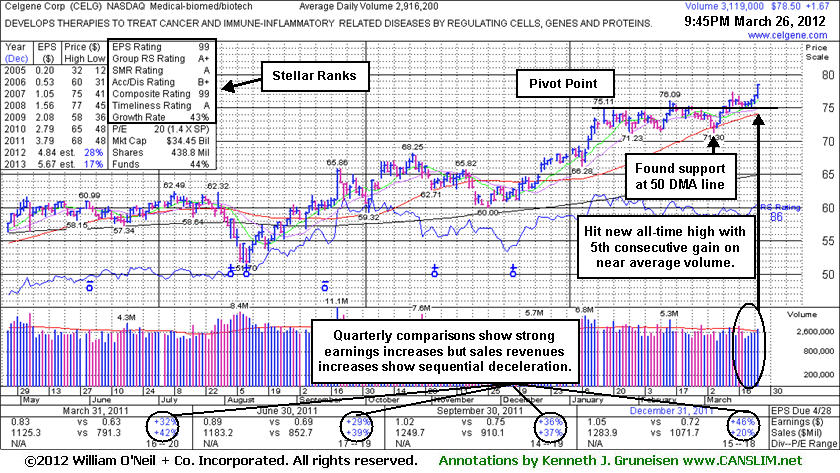
Celgene Corp (CELG +$1.67 +2.17% to $78.50) hit a new 52-week high today with a 5th consecutive gain. It also rallied above its all-time high ($77.39 in Aug '08). We illustrated that old high in the stock's last appearance in this FSU section on 2/02/12 which included an annotated weekly graph under the headline, "Stubbornly Holding Ground Forming 3-Weeks Tight Base."
The winning streak into new high territory is impressive, however to trigger a proper technical buy signal the volume behind a gain must be at least +40-50% above average, preferably greater. Investors are often wise to use the tactical approach called "pyramiding" to accumulate shares and avoid chasing a stock too far above its pivot point while waiting for the volume to help clinch the technical buy signal. Heavy volume behind a breakout gain is still no guarantee that a stock with produce great gains, but it is a convincing and very reassuring sign of the truly great institutional demand necessary for a sustainable and meaningful price advance. Bullish market environments often offer multiple opportunities to accumulate the same high-ranked company's shares within the fact-based system's guidelines. As always, disciplined investors limit losses if any stock ever falls more that -7% from their buy point.
CELG found support at its 50-day moving average (DMA) line on the last pullback. Any subsequent violation would raise concerns and trigger technical sell signals. Often institutional owners re-evaluate a stock when it tests that short-term average. They may choose to accumulate additional shares and support their current investment in the company if they are still optimistic about its future prospects. However, when any stock fails to find support near the 50 DMA line and instead slices below it with a damaging loss, often that weak action is a sign that institutional owners are losing confidence and reducing their ownership interest in the company.
Earnings increases have been strong, but the latest quarter ended Dec 31, 2011 had the smallest % gain in sales revenues in the past 2 years of comparisons. It has earned stellar ranks, however any subsequent slow down may raise additional concerns.
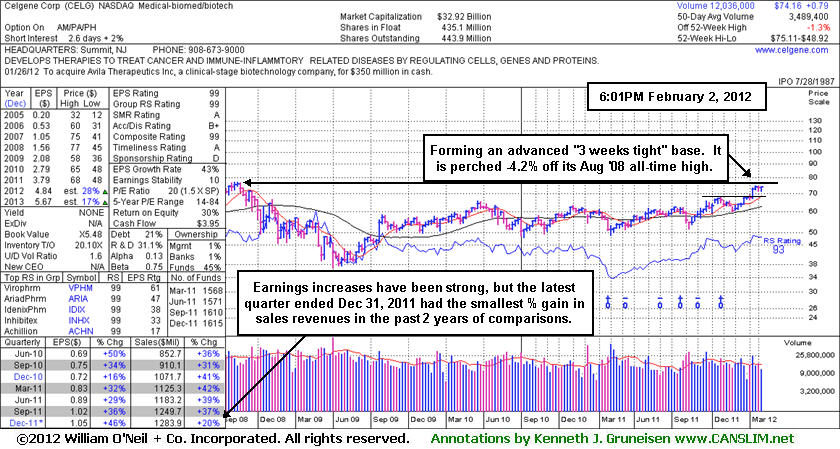
Celgene Corp (CELG +$0.24 or +0.32% to $74.16) posted a quiet gain today and finished at a new high close for the year. Recently it has been noted while also trading within close striking distance of its all-time high ($77.39 in Aug '08). It is forming an advanced "3-weeks tight" type base well above its 50-day moving average (DMA) line and its prior highs in the $68 area which define chart support to watch on pullbacks. Its color code is changed to yellow with a new pivot point cited based on its 1/17/12 high plus 10 cents. Subsequent volume-driven gains above the pivot point cited may trigger a new (or add-on) technical buy signal.
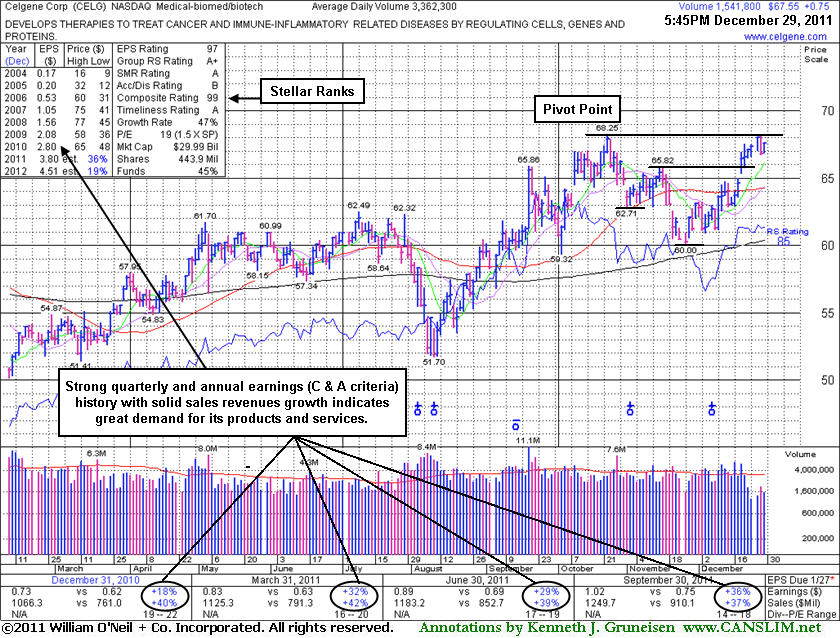
This high-ranked Medical -Biomed/ Biotech firm's last appearance in this FSU section was on 12/29/11 with an annotated graph under the headline, "High-Ranked Biomed/Biotech Firm Perched Near High - Thursday, December 29, 2011", and its ability to subsequently power into new high territory with additional volume-driven gains (4 consecutive gains January 9-12) provided a most reassuring sign that it may be capable of a meaningful and sustained advance. Earnings increases have been strong, but the latest quarter ended Dec 31, 2011 had the smallest % gain in sales revenues in the past 2 years of comparisons.
Bullish market environments often offer multiple opportunities to accumulate the same high-ranked company's shares within the fact-based system's guidelines. As we have reminded members before, patience and discipline are required, and the fact-based system's buying tactic called pyramiding can be especially helpful to investors who may have struggled to make progress with their portfolios. As always, disciplined investors limit losses if any stock ever falls more that -7% from their buy point.
Celgene Corp (CELG +$0.75 or +1.12% to $67.55) posted a small gain today on below average volume. A recent streak of 8 consecutive small gains helped it rally within close striking distance of its 52-week high and the new pivot point that was cited on 12/20/11 based on its prior high plus 10 cents. Some may consider its strong finish on 12/20/11 to have already cleared a "double bottom" base, however, its ability to power into new high territory with additional volume-driven gains would be viewed as most reassuring sign that it may be capable of a meaningful and sustained advance. Subsequent volume-driven gains above the pivot point cited may trigger a new (or add-on) technical buy signal.
Its last appearance in this FSU section was on 12/01/11 with an annotated graph under the headline, "Rebound Above 50-Day Moving Average Needed For Outlook To Improve", while consolidating below its 50-day moving average (DMA) line. That important short-term average acted as resistance briefly, but it eventually repaired the technical damage with volume-driven gains. The stock's choppy action, coupled with tough market action (M criteria) in prior weeks, may likely have prompted investors to sell this high-ranked Medical -Biomed/ Biotech firm's shares and reduce market exposure. Additional opportunities to accumulate the same company's shares within the fact-based system's guidelines can eventually come along, so patience and discipline are required. New buying efforts may be justified under the fact-based system's guidelines using a tactic called pyramiding. As always, disciplined investors limit losses if any stock ever falls more that -7% from their buy point.
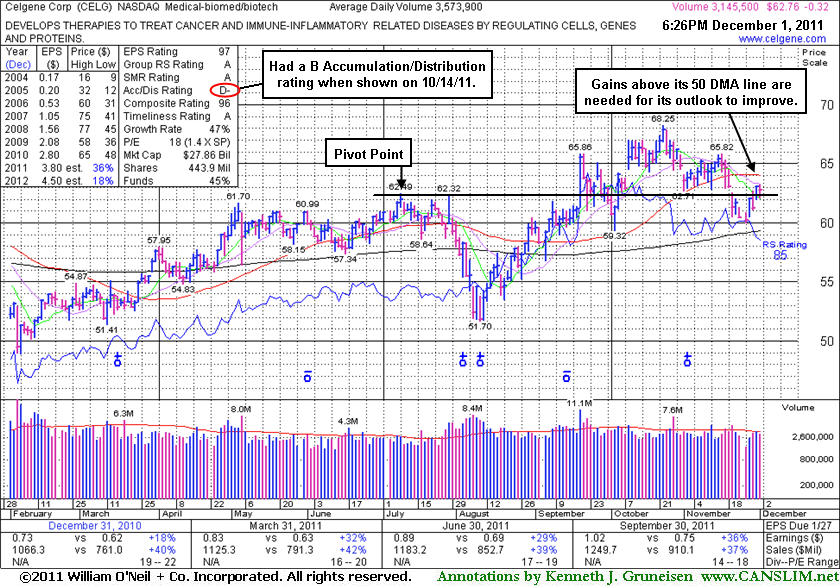
Celgene Corp (CELG -$0.32 or -0.51% to $62.76) is consolidating below its 50-day moving average (DMA) line which may now act as resistance, meanwhile gains above that important short-term average are needed for its outlook to improve. Following its last appearance in this FSU section on 11/07/11 with an annotated graph under the headline, "Consolidation May Be Considered a Secondary Buy Point", it continued consolidating below its "max buy" level and just above its 50-day moving average (DMA) line. Prior highs were noted as important near-term chart support to watch where - "any subsequent violations would raise concerns and trigger technical sell signals." On 11/18/11 it was noted - "Today's 3rd consecutive loss led to a violation of its 50 DMA line raising concerns. A damaging violation of its recent chart low ($62.71 on 11/01/11) would raise greater concerns and trigger a worrisome technical sell signals." It gapped down the next day, and it has been unable to repair the technical damage thus far. As always, disciplined investors limit losses if any stock ever falls more that -7% from their buy point.
When an investor misses a proper technical buy point they often will get additional opportunities to accumulate that same company's shares within the fact-based system's guidelines. New buying efforts may be justified under the fact-based system's guidelines with an ideal "secondary buy point" between the first successful test of support near a stock's 50 DMA line, on up to as much as +5% above its latest high. However, historic studies have shown that investors' odds are most favorable when buying fresh breakouts while the stock is rising above its pivot point, rather than buying when a stock is pulling back into the ideal buying range.
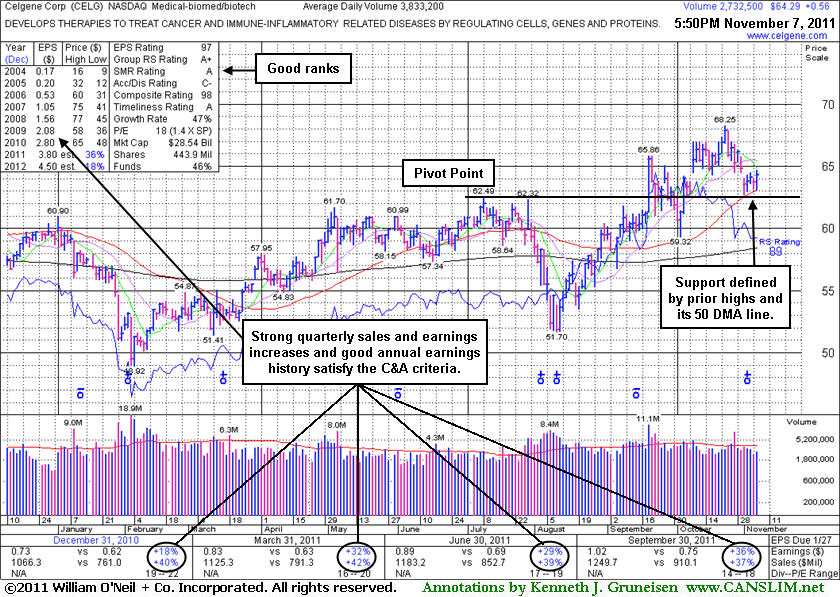
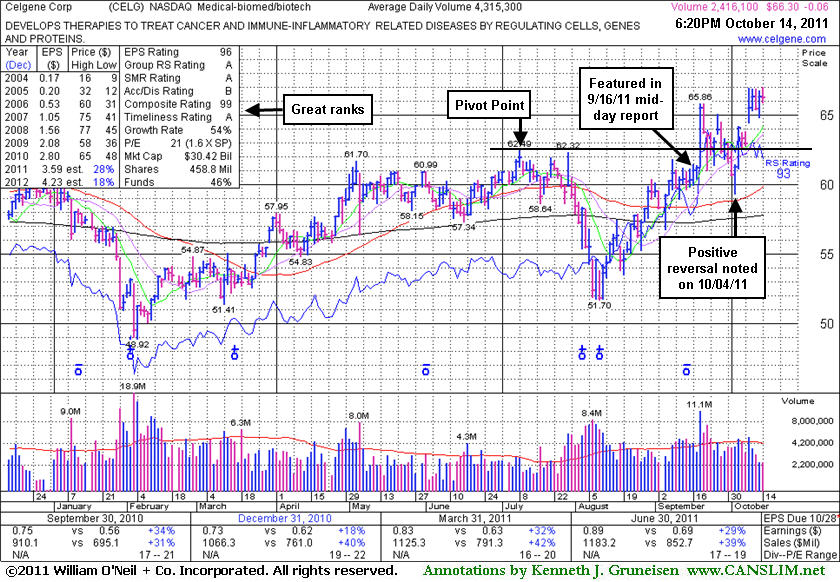
Celgene Corp (CELG +$0.56 or +0.88% to $64.29) is quietly consolidating below its "max buy" level and just above its 50-day moving average (DMA) line and prior chart highs which define important near-term chart support to watch. Any subsequent violations would raise concerns and trigger technical sell signals. Following its last appearance in this FSU section on 10/14/11 with an annotated graph under the headline, "Leader is Slightly Extended Following Latest Gap Up - Friday, October 14, 2011 ", it wedged up to another new high without great volume conviction then encountered some distributional pressure.
New buying efforts may be justified under the fact-based system's guidelines while now consolidating near its 50 DMA line, on up to as much as +5% above the latest peak. However, historic studies have shown that investors' odds are most favorable when buying fresh breakouts while the stock is rising above its pivot point, rather than buying when a stock is pulling back into the ideal buying range. As always, disciplined investors limit losses if any stock ever falls more that -7% from their buy point.
A hearty bull market produces many high-ranked leaders that break out from sound bases, and there are many valid opportunities where disciplined buying efforts are justified within the guidelines of the fact-based system. Early leaders in a new leg up like this one can be kept on a watchlist of worthy buy candidates if they appear to be getting away, and they may possibly be noted again when new bases or secondary buy points present themselves.
After a 10/10/11 gap up, CELG's color code was changed to green and it was noted because it had rallied beyond the previously cited "max buy" level. Keep in mind that a new confirmed rally has also now been acknowledged and the market (M criteria) is again considered to be in a confirmed uptrend. That means that new buying efforts may be justified under the fact-based system's guidelines. It is not a huge stretch to look at it now, but a new rally is not an excuse to make sloppy buys. In a confirmed rally investors' odds are most favorable when buying fresh breakouts rather than chasing a stock too far above the most ideal buying range. A hearty bull market produces many high-ranked leaders that break out from sound bases, producing valid opportunities where disciplined buying efforts are justified within the guidelines of the fact-based system. Early leaders in a new leg up like this one can be kept on a watchlist of worthy buy candidates if they appear to be getting away, and they may possibly be noted again when new bases or secondary buy points present themselves.
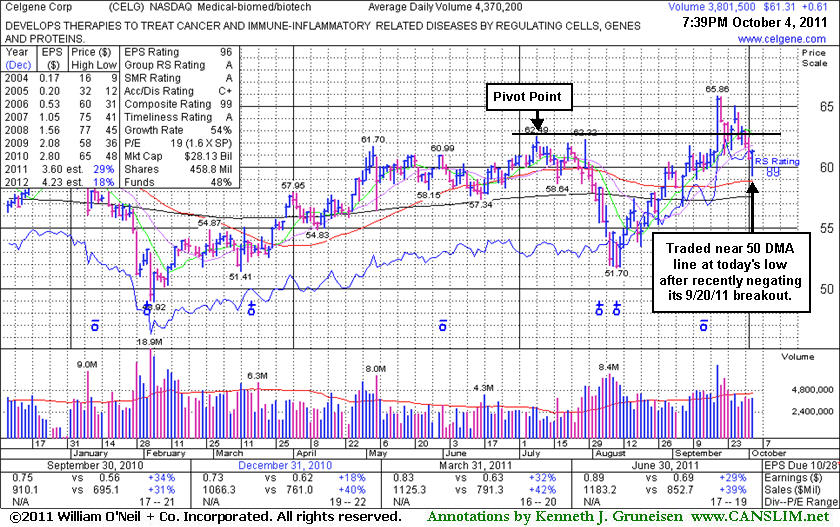
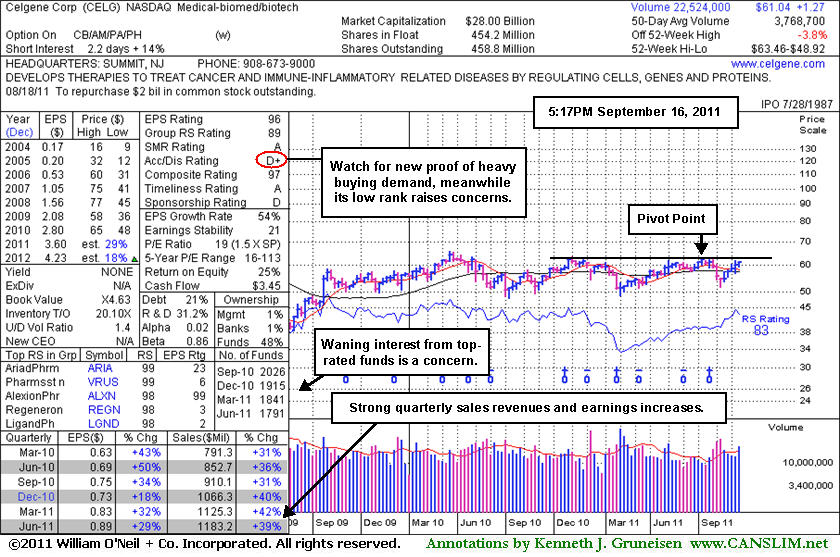
Celgene Corp (CELG +$0.61 or +1.00% to $61.31) managed a positive reversal today for a small gain on below average volume after initially slumping further below its pivot point to trade near its 50-day moving average (DMA) line. Disciplined investors may likely have been prompted to sell after a pullback of more than -7% at the lows today. Its Accumulation/Distribution Rating of C+ is actually up from a D+ at the time of its last appearance in this FSU section on 9/16/11 with an annotated graph under the headline, "Fundamentals Are Strong While Technical Action Has Yet To Confirm". Then it was perched within close striking distance of previously stubborn resistance in the $62 area. Fresh proof of institutional buying demand triggered a technical buy signal on 9/20/11, but it abruptly pulled back near previously stubborn resistance in the $62 area and then later slumped back into its prior base by closing under prior highs.
Keep in mind that a new confirmed rally with a follow-through day is needed to confirm that the market (M criteria) is again in a confirmed uptrend before any new buying efforts may be justified under the fact-based system's guidelines. In a confirmed rally investors' odds are more favorable, meanwhile, it is a good time to study up and keep high-ranked leaders like this one on a watchlist of most worthy buy candidates. CELG was featured in the August 2008 CANSLIM.net News (read here).
Often, when a leading stock is setting up to breakout of a solid base, it is highlighted in CANSLIM.net's Mid-Day Breakouts Report. The most relevant factors are noted in the report which allows prudent CANSLIM oriented investors to place the issue in their watch list. After doing any necessary backup research, the investor is prepared to act if and when the stock triggers a technical buy signal (breaks above its pivot point on more than +50% average turnover). In the event the stock fails to trigger a technical buy signal and its price declines then it will simply be removed from the watch list.
Celgene Corp (CELG +$0.85 or +1.40% to $61.18) was highlighted in yellow in today's mid-day report with a pivot point cited based on its 52-week high plus 10 cents. It is perched within close striking distance of previously stubborn resistance in the $62 area. Quarterly and annual earnings history has remained strong while it survived but failed to impress since it was dropped from the Featured Stocks list on 10/06/08. Its Accumulation/Distribution Rating of D+ is a concern, as is waning ownership by top-rated funds as indicated on the annotated weekly graph below. This stock's past serves as a reminder again now that fresh proof of institutional buying demand is worth waiting for, and there is not an advantage to be gained by getting in "early" before a proper technical buy signal occurs.
Disciplined investors may note that CELG did not confirm a proper technical buy signal after it was featured in the August 2008 CANSLIM.net News, whereas the detailed report's "Technical Analysis" area included the note - "Confirming gains to all-time highs with great volume conviction would be a nice reassurance that it is capable of a meaningful advance" (read here).
Often, when a leading stock is setting up to breakout of a solid base, it is highlighted in CANSLIM.net's monthly newsletter, CANSLIM.net News. The most relevant factors are noted in the report which allows prudent CANSLIM oriented investors to place the issue in their watch list. After doing any necessary backup research, the investor is prepared to act if and when the stock triggers a technical buy signal (breaks above its pivot point on more than +50% average turnover). In the event the stock fails to trigger a technical buy signal and its price declines then it will simply be removed from the watch list.
Celgene Corp (CELG -$0.77 or -1.2% to $63.24) was featured in the August 2008 issue of CANSLIM.net News under the headline, "Medical Firm Rises Clear of All Overhead Supply". However, disciplined investors may note that CELG did not confirm a proper technical buy signal after that appearance, whereas the detailed report's "Technical Analysis" area included the note - "Confirming gains to all-time highs with great volume conviction would be a nice reassurance that it is capable of a meaningful advance". Instead of producing a strong breakout, subsequent deterioration raised concerns and triggered technical sell signals.
CELG would need to rally above its 50 DMA line for its outlook to improve, so for now it might be best to keep it on an active watchlist. It was first featured on Friday, October 27, 2006 in the CANSLIM.net Mid Day Breakouts Report (read here) but later it was dropped from the Featured Stocks list based on technical weakness.
C A N S L I M | StockTalk | News | Chart | SEC | Zacks Reports | ![]()
![]()
![]()

View all notes | Alert me of new notes | CANSLIM.net Company Profile
|
Celgene Corp (CELG) |
| |
|
Ticker Symbol: CELG (NASDAQ) |
Industry Group: Medical- Biomed/Biotech |
Shares Outstanding: 435,900,000 |
|
Price: $75.49 |
Day's Volume: 5,226,900 7/31/2008 |
Shares in Float: 427,100,000 |
|
52 Week High: $75.44 10/11/2007 |
50-Day Average Volume: 5,080,900 |
Up/Down Volume Ratio: 1.5 |
|
Pivot Point: $75.54 10/11/07 high plus $0.10 |
Pivot Point +5% = Max Buy Price: $79.32 |
Web Address: http://www.celgene.com/ |
C A N S L I M | StockTalk | News | Chart | SEC | Zacks Reports

CANSLIM.net Profile: Celgene Corporation, a biopharmaceutical company, engages in the discovery, development, and commercialization of innovative therapies to treat cancer and immune-inflammatory related diseases in Europe and the United States. The company was founded in 1980 and is headquartered in Summit, New Jersey. The stock's Composite Rating, which is a combination of all the other readings, stands at a very healthy 99. Meanwhile, the Relative Strength (RS) rating is an 93 and the company's Earnings Per Share (EPS) rating is 99. Earnings per share and sales revenues have grown at a very healthy clip over the past four quarters, in both cases (sales and earnings) showing increases above the +25% guidelines. CELG resides in the Leisure- toys/games/hobby group which is currently ranked 12th out of the 197 Industry Groups covered in the paper, helping satisfy the "L" criteria. Return on Equity stands at 19%, which is above the 17% guideline.
What to Look For and What to Look Out For: Look for the stock to confirm a new technical buy signal by breaking out to new all-time highs and closing above its $75.54 pivot point (meets the N criteria) with gains on at least the minimum +50% above average volume or heavier volume in the coming days and weeks. As always, it is of the utmost importance to sell a stock if it drops 7-8% below your purchase price. This high-ranked leader should remain on an active watch list and could be considered as a new buy candidate in the event it closes above its pivot point on the necessary volume needed to trigger a technical buy signal.
Technical Analysis: CELG is currently trading just below its $75.54 pivot point and is in the process of forming the right side of a long 10 month base. The stock has managed to stay near its highs even as the broader market got whacked in recent weeks. This great relative strength is considered a positive divergence, which is a great way for investors to isolate strength. Confirming gains to all-time highs with great volume conviction would be a nice reassurance that it is capable of a meaningful advance. Its considerable gain on 7/24/08 may be viewed as an earlier technical breakout which followed a volume dry up as it built a handle. Now it is imperative to see volume surpass the necessary threshold needed to trigger a technical buy signal as the stock trades and closes above its pivot point. Until then, this high ranked stock should remain on an active watch list.
A very important technical tool that savvy investors have learned to incorporate in their technical analysis is the 200-day moving average (DMA) line. The 200 DMA line plays a pivotal role relative to a stock's price. If the price of a stock is above its 200 DMA then odds are that its 200 DMA will act as longer term support. Conversely, if the price is below its 200 DMA then the moving average acts as resistance. Obviously, if a technical breakdown or violation takes place on heavy volume it is a more serious concern. Sometimes quiet violations are repaired quickly, without a lot of additional losses. However, the key moving averages are always an important line to watch.
Celgene Corporation (CELG +$0.13 or +0.22% to $59.89) has been steadily consolidating over the past few months and is currently trading between its 50 & 200 DMA lines and below the lower boundary of its 3-month downward trendline. This stock was first featured on Friday, October 27, 2006 in the CANSLIM.net Mid Day Breakouts Report (read here) with a $49.51 pivot point. In the months that followed this stock rallied a respectable +21%. After that impressive run the stock leveled out, then gapped down on January 9th, which marked the beginning of a longer and deeper consolidation period. It started showing stronger action again in April of 2007, with gains on heavy volume as it rallied to new all-time highs. More recently, CELG was highlighted in the June 4, 2007 CANSLIM.net After Market Report's "Featured Stock Update" section (read here) when it was last testing its 50 DMA line. It triggered a technical sell signal as it gapped down under its 50 DMA on June 7th, 2007, then it consolidated for several weeks above support at its 200 DMA line. A break below the 200 DMA or recent chart lows in the $56 range would raise more serious concerns. Investors would need to see this stock rally above its downward trendline on heavy volume before having cause to get very optimistic.
What the future holds for CELG will largely be dictated by the broader market (the "M" criteria) action, since 3 out of 4 stocks follow the general market direction. In the event CELG faces more serious selling pressure in the days ahead, it would be very important to see key levels of chart support defended. Any damaging losses could lead to violations that trigger technical sell signals.
C A N S L I M | StockTalk | News | Chart | SEC | Zacks Reports

View all notes | Alert me of new notes | CANSLIM.net Company Profile
Celgene Corporation (CELG -$0.09 or -0.15% to $61.71) continued pulling back towards its 50 DMA line. It was previously highlighted in the April 18, 2007 CANSLIM.net After Market Report's "Featured Stock Update" section (read here) discussing the fact that this previously featured favorite was setting up to potentially breakout from a 6 month base-on-base pattern. That report pointed out, "This candidate serves as a great example of how a stock can re-appear months after its first technical breakout is triggered." That write-up was followed by four consecutive gains on above average volume, and in the process the stock triggered a new technical buy signal when it traded above its latest $60.22 pivot point! In fact, CELG was highlighted (in yellow) in the April 20, 2007 edition of the CANSLIM.net Mid Day Breakouts Report (read here) as it was triggering a technical buy signal. In the weeks that followed it rallied +11%. It is typically considered encouraging to see volume dry up as a stock pulls back towards its 50 DMA line. Technically, it is now important to see CELG defend its 50 DMA line (now $60.33) and avoid closing back under support at its December '06 high that coincides near the $60 level. If the bears overpower the bulls and these important levels are violated with high volume losses, sell signals would be triggered and then the odds of it producing bigger gains would be greatly reduced.
CELG was first featured on Friday, October 27, 2006 in the CANSLIM.net Mid Day Breakouts Report (read here) with a $49.51 pivot point. In the months that followed this stock rallied a respectable +21%. After that impressive run the stock leveled out, then gapped down on January 9th, which marked the beginning of a longer and deeper consolidation period. It ultimately found support above its July '06 chart highs and above its longer term 200-day moving average (DMA) line. It steadily rallied back to complete the right side of a cup-shaped pattern, then broke out.
C A N S L I M | StockTalk | News | Chart | ![]() DGO | SEC | Zacks Reports
DGO | SEC | Zacks Reports

View all notes | Alert me of new notes | CANSLIM.net Company Profile
Often, when a leading stock is setting up to breakout of a solid base it is highlighted in CANSLIM.net's Mid-Day Breakouts Report. The most relevant factors are noted in the report which allows prudent CANSLIM oriented investors to place the issue in their watch list. After doing any necessary backup research, the investor is prepared to act if and when the stock triggers a technical buy signal (breaks above its pivot point on more than +50% average turnover). In the event the stock fails to trigger a technical buy signal and its price declines then it will simply be removed from the watch list.
Celgene Corporation (CELG +$0.25 or +0.44% to $57.43) closed slightly higher on above average volume, yet it is still trading -4.5% below its 52-week high. This stock was first featured on Friday, October 27, 2006 in the CANSLIM.net Mid Day Breakouts Report (read here) with a $49.51 pivot point. In the months that followed this stock rallied a respectable +21%. After that impressive run, the stock pulled back and ultimately found support near its prior chart highs and above its longer term 200-day moving average (DMA) line. During that pullback, CELG sliced through its 50 DMA and was highlighted in the January 9, 2007 CANSLIM.net After Market Report (read here) discussing that violation.
Since finding support, CELG has steadily rallied and it is currently perched near chart resistance at the high end of its long 6-month base-on-base pattern. The company has managed to increase its earnings by +400%, and +500% in the past two quarters, helping earn this stock a best possible Earnings Per Share (EPS) rating of 99. Furthermore, the company has managed to increase its earnings by above the +25% guideline in each of the past four quarterly comparisons versus the year earlier, satisfying the "C" criteria. However, CELG's Relative Strength (RS) rating has slipped to a 78, which is just below the 80+ guideline. The stock's relative strength line is also lagging, whereas it would be more encouraging to see the relative strength line (the jagged blue line) rise into new high territory as this stock advances.
CELG resides in the Medical - biomedical/biotech group which is currently ranked 52nd out the 197 Industry Groups covered in the paper, placing it barely outside of the preferred top quartile of industry groups. This candidate serves as a great example of how a stock can re-appear months after its first technical breakout is triggered. Before adding shares or making any initial purchases, it is of the utmost importance to see the stock breakout above its new pivot point of $60.22 on at least +50% above average volume sufficient to trigger a new technical buy signal. Without such a reassurance that the stock is being accumulated aggressively by institutional investors (the "I" criteria) its chances of making a sustained advance are looked at as questionable. As always, stocks should be sold if they ever drop 7-8% below your purchase price to prevent the possibility of greater losses which can be damaging both psychologically and financially.
C A N S L I M | StockTalk | News | Chart | ![]() DGO | SEC | Zacks Reports
DGO | SEC | Zacks Reports

View all notes | Alert me of new notes | CANSLIM.net Company Profile
Celgene Corporation (CELG +$1.96 or +3.62% to $52.15) positively reversed as it bounced nicely off its 200 DMA line and fought to stay above prior chart highs from the latter half of last year. This stock was first featured on Friday, October 27, 2006 in the CANSLIM.net Mid Day Breakouts Report (read here) with a $49.51 pivot point. Within a few weeks, the stock rallied over +20% before it began pulling back. Since then the stock failed to find support at its 50 DMA line, and the action was covered in further detail in the January 09, 2007 edition of the CANSLIM.net After Market Update (read here). In the past two months, the stock has steadily drifted lower. Now it faces resistance due to overhead supply all the way up to the $60 level, which may hinder its near-term progress. Its chances of quickly repairing the technical damage are not great unless the market environment ("M" criteria) shapes up.
Today CELG found support above its longer-term 200 DMA line which also corresponds nicely with support at its old chart highs. Its fundamentals remain solid and it maintains a best-possible 99 Earnings Per Share (EPS) rating, showing very strong earnings growth in the past two quarterly comparisons. However, its Relative Strength (RS) rating has slipped to 69. As a precautionary measure, many careful CANSLIM(R) investment system practitioners unload stocks if their RS rank ever falls under 70. Now that CELG has positively reversed after finding support near its 200 DMA line and old highs, odds favor that it may bounce towards its 50 DMA line, but it has a lot of work to do before one can expect it to appear on the new-highs list again.
C A N S L I M | StockTalk | News | Chart | ![]() DGO | SEC | Zacks Reports
DGO | SEC | Zacks Reports

View all notes | Alert me of new notes | CANSLIM.net Company Profile
It is very important to isolate the noise and pay attention to price and volume as we make our way through yet another earnings season. There are a slew of analysts that come out and set "targets" and who constantly engage in publishing upgrades or downgrades on various securities. An important element in profitably navigating through a busy earnings season is to see how your individual holdings react to their latest earnings news and guidance. While it is a common occurrence to see stocks sell off after a new earnings report, it is healthy to see investors promptly bid the stocks higher after a company reports their quarterly results. Investors that objectively analyze price and volume will likely do better than blindly following a plethora of analysts' upgrades and downgrades.
Celgene Corporation (CELG -$2.45 or -4.28% to $54.85) gapped down on nearly three times normal volume after the company lowered its 2007 earnings forecast below Wall Street's estimates. This stock was featured on Friday, October 27, 2006 in the CANSLIM.net Mid Day Breakouts Report (read here) with a $49.51 pivot point. In the months that followed this stock rallied a respectable +21%. Two important events have occurred during its recent consolidation that warrant discussion. First, the 50 DMA line managed to catch up to the stock, which is perfectly healthy. Second, CELG has found support in the $53.50-$53.84 range in recent months. However, today the stock gapped lower and sliced through support at its 50 DMA line, technically a sell signal. It was only encouraging to see CELG avoid deteriorating to levels any worse than an intra-day low of $53.80 before turning around and ending in the upper half of the day's range. Knowing when to sell is a critical component to achieving above average results. A more definitive sign of technical deterioration to watch out for would be if CELG drops below support at its recent chart lows ($53.50-$53.84) on a closing basis.
C A N S L I M | StockTalk | News | Chart | ![]() DGO | SEC | Zacks Reports
DGO | SEC | Zacks Reports

View all notes | Alert me of new notes | CANSLIM.net Company Profile
A classic example of the success enjoyed by many CANSLIM.net readers usually starts when an investor reads a CANSLIM.net report and buys a featured stock before it has risen above the pivot point by greater than 5%. After a stock breaks out above its pivot point, there is only a +5% window that investors have to purchase the stock under the proper guidelines. Once a stock rises above the "maximum buy price" the risk of a shake out balloons, meaning that even a normal retracement in the stock might force you to employ the 7-8% loss cutting rule. Much can be told by the stock's daily action in the weeks and months that follow a breakout. Typically, a light volume and orderly pullback suggests that the bulls remain in control. However, high volume pullbacks that violate support paint a totally different picture.
Celgene Corporation (CELG +$0.89 or +1.58% to $57.24) continued consolidating within only 3.2% of its all-time highs with a gain on average volume today. This stock was first featured on Friday, October 27, 2006 in the CANSLIM.net Mid Day Breakouts Report (read here) with a $49.51 pivot point. Within a few weeks this stock soared nearly +20%, which is exactly the type of healthy action one would like to see after a stock triggers a technical buy signal. The stock sports a very high Earnings Per Share (EPS) rating of 98 and a Relative Strength (RS) rating of 93. It is healthy for a stock to spend a few weeks building a new base after a decent advance. Support would be expected to step up and keep it trading above its recent chart lows ($53.84 on 11/28 and $53.50 on 12/13) and its 50-day moving average (DMA) line, and it deserves the benefit of the doubt unless there are any violations and damaging losses on heavier than normal volume totals.
C A N S L I M | StockTalk | News | Chart | ![]() DGO | SEC | Zacks Reports
DGO | SEC | Zacks Reports

View all notes | Alert me of new notes | CANSLIM.net Company Profile
A classic example of the success enjoyed by many CANSLIM.net readers usually starts when an investor reads a CANSLIM.net report and buys a featured stock before it has risen above the pivot point by greater than 5%. After a stock breaks out above its pivot point, there is only a +5% window that investors have to purchase the stock under the proper guidelines. Once a stock rises above the "maximum buy price" the risk of a shake out balloons, meaning that even a normal retracement in the stock might force you to employ the 7-8% loss cutting rule. Much can be told by the stock's daily action in the weeks and months that follow a breakout. Typically, a light volume and orderly pullback suggests that the bulls remain in control. However, high volume pullbacks that violate support paint a totally different picture.
Celgene Corporation (CELG $0.69 or +1.35% to $50.33) followed through with additional gains on heavy volume as it continued into new high territory after Thursday's impressive gap higher. This stock was first featured today in the CANSLIM.net Mid Day Breakouts Report (read here) with a $49.51 pivot point. On Thursday, this stock gapped out of a three month base and surged +12% on more than three times normal volume after reporting solid third quarter results. Celgene earned +$0.15 a share last quarter compared to +$0.03 in the same period last year. Revenue also surged +89% from $129.5 million to +$244.8 million.
Analyzing the market's reaction to the stocks financial report (and guidance) is just as important, or more important, than the actual numbers. It was encouraging to see CELG follow through on Friday as it leaped to a fresh all time high while the major averages pulled back, an impressive indication of its strong relative strength. This stock is currently trading below its maximum buy price of $51.99, and as a result it still may be considered buyable. However, some caution is raised by its 12% Return on Equity (ROE), which is under the +17% guideline. Bending the system's fact-based rules can hinder your ability to achieve above average results in the marketplace.
C A N S L I M | StockTalk | News | Chart | SEC | Zacks Reports

View all notes | Alert me of new notes | CANSLIM.net Company Profile