Big Loss Testing Support at 50-Day Moving Average - Monday, December 5, 2022
Consolidating Above Prior Highs and Above 50-Day Moving Average - Tuesday, November 8, 2022
Healthcare Staffing Firm Hovering Near All-Time High - Monday, October 17, 2022
Powerful Breakout While Market Rally Still Needs Confirmation - Monday, October 3, 2022
Positive Reversal While Consolidating Above 50-Day Moving Average - Monday, September 12, 2022
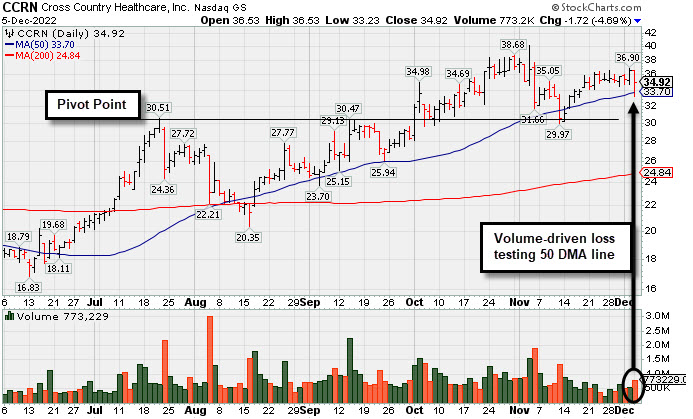
Big Loss Testing Support at 50-Day Moving Average - Monday, December 5, 2022
Cross Country Healthcare (CCRN -$1.72 or -4.69% to $34.92) suffered a loss today with higher (near average) volume while testing support at its 50-day moving average (DMA) line ($33.54). More damaging losses would raise concerns and trigger a technical sell signal.
CCRN has a 99 Earnings Per Share Rating, the highest possible. Recently it reported Sep '22 quarterly earnings +75% on +70% sales revenues versus the year ago period. Prior quarterly comparisons showed strong sales revenues and earnings increases. Annual earnings growth (A criteria) has been strong since a downturn in FY '17 and '18.
The company has only 37.3 million shares outstanding (S criteria), which can contribute to greater price volatility in the event of institutional buying or selling. The number of top-rated funds owning its shares rose from 326 in Sep '21 to 408 in Sep '22, a reassuring sign concerning the I criteria. Its current Up/Down Volume Ratio of 1.7 is an unbiased indication its shares have been under accumulation over the past 50 days. It has a Timeliness Rating of A and Sponsorship Rating of B.
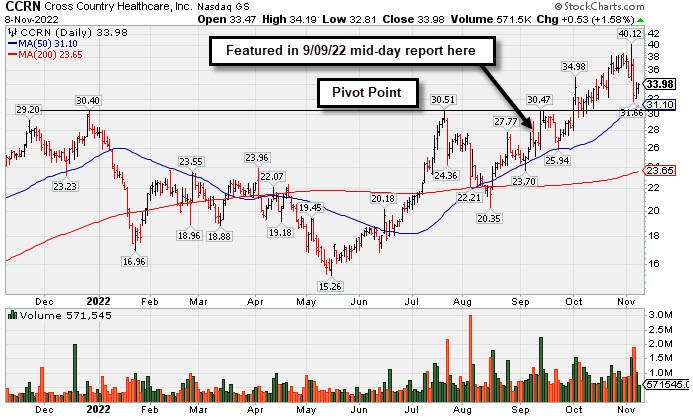
Consolidating Above Prior Highs and Above 50-Day Moving Average - Tuesday, November 8, 2022
Cross Country Healthcare (CCRN +$0.53 or +1.58% to $33.98) has posted 2 gains with lighter volume after halting its slide since suffering a damaging volume-driven loss on Friday, 11/04/22, It briefly undercut its "max buy" level. Prior highs in the $30.50 area define important near-term support to watch along with its 50-day moving average (DMA) line ($31.10).
CCRN was highlighted yellow with pivot point cited based on its 7/21/22 high plus 10 cents in the 9/09/22 mid-day report (read here). It was last shown in greater detail on 10/03/22 with an annotated graph under the headline, "".
CCRN has a 99 Earnings Per Share Rating, the highest possible. It recently reported Sep '22 quarterly earnings +75% on +70% sales revenues versus the year ago period. Prior quarterly comparisons showed strong sales revenues and earnings increases. Annual earnings growth (A criteria) has been strong since a downturn in FY '17 and '18.
The company has only 38.2 million shares outstanding (S criteria), which can contribute to greater price volatility in the event of institutional buying or selling. The number of top-rated funds owning its shares rose from 326 in Sep '21 to 402 in Sep '22, a reassuring sign concerning the I criteria. Its current Up/Down Volume Ratio of 1.6 is an unbiased indication its shares have been under accumulation over the past 50 days. It has a Timeliness Rating of A and Sponsorship Rating of B.
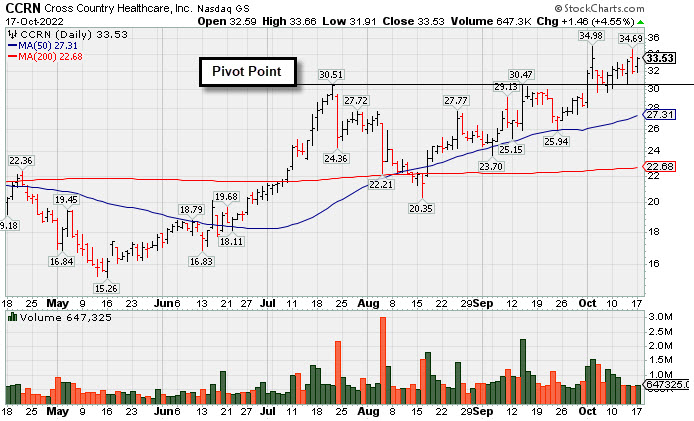
Healthcare Staffing Firm Hovering Near All-Time High - Monday, October 17, 2022
Cross Country Healthcare (CCRN +$1.46 or +4.55% to $33.53) hit a new 52-week high as it rallied above its pivot point with today's big gain backed by +48% above average volume triggering a technical buy signal. Its 50-day moving average (DMA) line ($26.08) defines important near-term support where a violation would raise concerns and trigger a technical sell signal. Members have been repeatedly reminded in the daily Market Commentaries - "The market is in a correction (M criteria) and disciplined investors know to avoid new buying efforts until a new rally confirmed with a follow-through day."
CCRN has a 99 Earnings Per Share Rating, the highest possible. It reported Jun '22 quarterly earnings +198% on +127% sales revenues versus the year ago period. Prior quarterly comparisons showed strong sales revenues and earnings increases. Annual earnings growth (A criteria) has been strong since a downturn in FY '17 and '18.
The company has only 38.2 million shares outstanding (S criteria). The number of top-rated funds owning its shares rose from 326 in Sep '21 to 401 in Jun '22, a reassuring sign concerning the I criteria. Its current Up/Down Volume Ratio of 1.6 is an unbiased indication its shares have been under accumulation over the past 50 days. It has a Timeliness Rating of A and Sponsorship Rating of B.
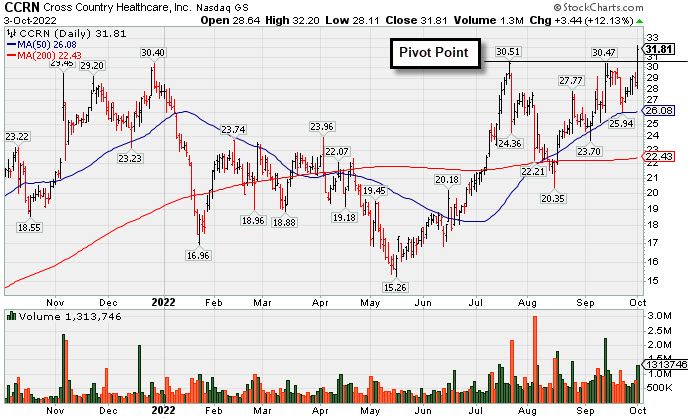
Powerful Breakout While Market Rally Still Needs Confirmation - Monday, October 3, 2022
Cross Country Healthcare (CCRN +$3.44 or +12.13% to $31.81) hit a new 52-week high as it rallied above its pivot point with today's big gain backed by +48% above average volume triggering a technical buy signal. Its 50-day moving average (DMA) line ($26.08) defines important near-term support where a violation would raise concerns and trigger a technical sell signal. Members have been repeatedly reminded in the daily Market Commentaries - "The market is in a correction (M criteria) and disciplined investors know to avoid new buying efforts until a new rally confirmed with a follow-through day."
CCRN has a 99 Earnings Per Share Rating, the highest possible. It reported Jun '22 quarterly earnings +198% on +127% sales revenues versus the year ago period. Prior quarterly comparisons showed strong sales revenues and earnings increases. Annual earnings growth (A criteria) has been strong since a downturn in FY '17 and '18.
The company has only 38.2 million shares outstanding (S criteria). The number of top-rated funds owning its shares rose from 326 in Sep '21 to 399 in Jun '22, a reassuring sign concerning the I criteria. Its current Up/Down Volume Ratio of 1.2 is an unbiased indication its shares have been under accumulation over the past 50 days. It has a Timeliness Rating of A and Sponsorship Rating of B.
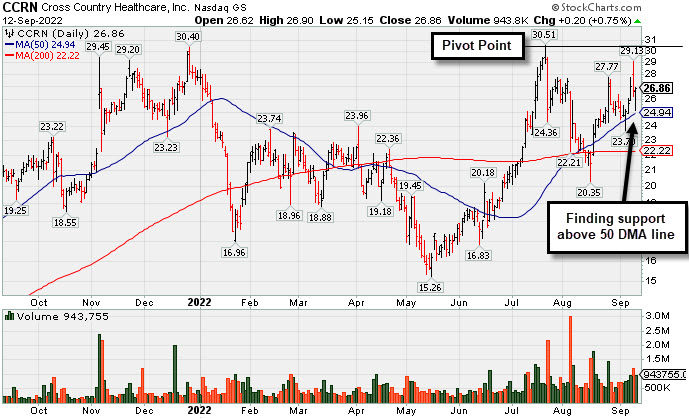
Positive Reversal While Consolidating Above 50-Day Moving Average - Monday, September 12, 2022
Cross Country Healthcare (CCRN +$0.20 or +0.75% to $26.86) managed a "positive reversal" today and closed near the session high. It was highlighted yellow with pivot point cited based on its 7/21/22 high plus 10 cents in the 9/09/22 mid-day report (read here). There was a "negative reversal" on that session after challenging its 52-week high with 4 consecutive gains. Subsequent gains above the pivot point backed by at least +40% above average volume may trigger a technical buy signal. It faces little resistance due to overhead supply. In recent weeks it rebounded from support near its 200 DMA line with volume-driven gains, then found support at its 50 DMA line while consolidating.
CCRN has a 99 Earnings Per Share Rating, the highest possible. It reported Jun '22 quarterly earnings +198% on +127% sales revenues versus the year ago period. Prior quarterly comparisons showed strong sales revenues and earnings increases. Annual earnings growth (A criteria) has been strong since a downturn in FY '17 and '18.
The company has only 38.2 million shares outstanding (S criteria). The number of top-rated funds owning its shares rose from 326 in Sep '21 to 400 in Jun '22, a reassuring sign concerning the I criteria. Its current Up/Down Volume Ratio of 1.6 is an unbiased indication its shares have been under accumulation over the past 50 days. It has a Timeliness Rating of A and Sponsorship Rating of B.