Perched Near 52-Week High After Forming an Orderly Base - Thursday, January 2, 2020
Found Support at 50-Day Moving Average - Tuesday, December 10, 2019
Consolidating After Volume-Driven Gains for New Highs - Tuesday, November 19, 2019
Noted "Positive Reversal" on Volatile Session After Earnings - Thursday, October 31, 2019
Perched Near High With Earnings News Due Next Week - Monday, October 14, 2019
Stalled After Recent Rally for New High - Friday, September 27, 2019
Thinly Traded Bank Rallied To Multi-Year Highs - Friday, September 13, 2019
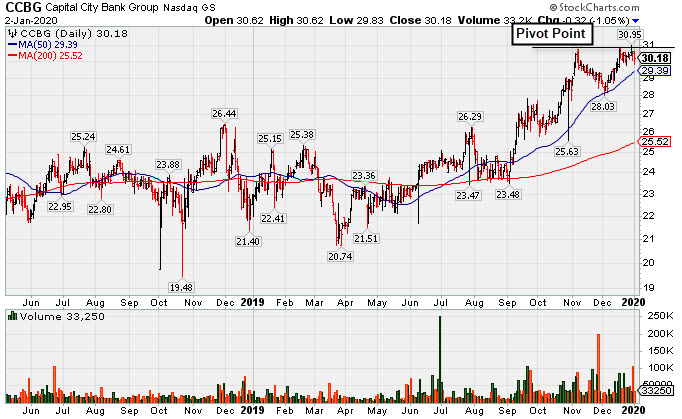
Perched Near 52-Week High After Forming an Orderly Base - Thursday, January 2, 2020
Capital City Bk Gp (CCBG -$0.32 or -1.05% to $30.18) is hovering within close striking distance of its 52-week high, recently meeting resistance. Subsequent gains and a strong close above the new pivot point cited based on its 11/06/19 high plus 10 cents may trigger a new (or add-on) technical buy signal. It found support at its 50-day moving average (DMA) line ($29.47) during its orderly consolidation. Below that important near-term average the prior highs which define important support to watch. More damaging losses would raise concerns and trigger a technical sell signal.
CCBG was highlighted in yellow with pivot point cited based on its 12/03/18 high plus 10 cents in the 9/13/19 mid-day report (read here). It was last shown in this FSU section on 12/10/19 with an annotated graph under the headline, "Found Support at 50-Day Moving Average".
Earnings increases in the 4 latest quarterly comparisons through Sep '19 were above the +25% minimum guideline (C criteria) as its sales revenues growth rate was in the 9-13% range versus the year ago periods. It has a Timeliness Rating of A, but a Sponsorship Rating of D.
Its small supply of only 16.7 million shares outstanding (S criteria) can contribute to greater price volatility in the event of institutional buying or selling. The number of top-rated funds owning its shares rose from 159 on Sep '18 to 184 in Sep '19, a reassuring sign concerning the I criteria. Its current Up/Down Volume Ratio of 1.2 is an unbiased indication its shares have been under slight accumulation over the past 50 days.
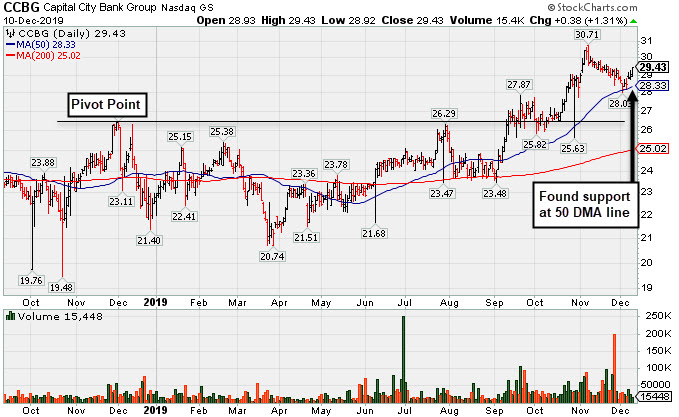
Found Support at 50-Day Moving Average - Tuesday, December 10, 2019
Capital City Bk Gp (CCBG +$0.38 or +1.31% to $29.43) found support as it tested its 50-day moving average (DMA) line ($28.45). Below that important near-term average the prior highs which define important support to watch. More damaging losses would raise concerns and trigger a technical sell signal.
CCBG was highlighted in yellow with pivot point cited based on its 12/03/18 high plus 10 cents in the 9/13/19 mid-day report (read here). It rallied for new 52-week highs with 3 consecutive solid volume-driven gains after it was last shown in this FSU section on 11/19/19 with an annotated graph under the headline, "Consolidating After Volume-Driven Gains for New Highs".
Earnings increases in the 4 latest quarterly comparisons through Sep '19 were above the +25% minimum guideline (C criteria) as its sales revenues growth rate was in the 9-13% range versus the year ago periods. It has a Timeliness Rating of A, but a Sponsorship Rating of D.
Its small supply of only 16.7 million shares outstanding (S criteria) can contribute to greater price volatility in the event of institutional buying or selling. The number of top-rated funds owning its shares rose from 159 on Sep '18 to 185 in Sep '19, a reassuring sign concerning the I criteria. Its current Up/Down Volume Ratio of 1.1 is an unbiased indication its shares have been under slight accumulation over the past 50 days.
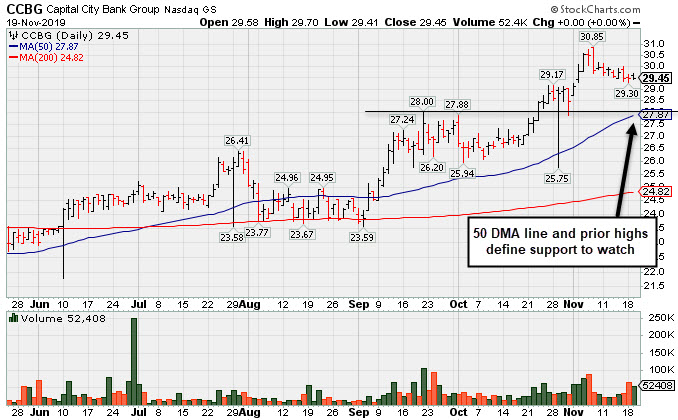
Consolidating After Volume-Driven Gains for New Highs - Tuesday, November 19, 2019
Capital City Bk Gp (CCBG $29.45) is still hovering near its 52-week high. Its 50-day moving average (DMA) line ($27.87) defines important support to watch along with prior highs.
CCBG was highlighted in yellow with pivot point cited based on its 12/03/18 high plus 10 cents in the 9/13/19 mid-day report (read here). It rallied for new 52-week highs with 3 consecutive solid volume-driven gains after it was last shown in this FSU section on 10/31/19 with an annotated graph under the headline, "Noted 'Positive Reversal' on Volatile Session After Earnings".
Earnings increases in the 4 latest quarterly comparisons through Sep '19 were above the +25% minimum guideline (C criteria) as its sales revenues growth rate was in the 9-13% range versus the year ago periods. It has a Timeliness Rating of A, but a Sponsorship Rating of E.
Its small supply of only 16.7 million shares outstanding (S criteria) can contribute to greater price volatility in the event of institutional buying or selling. The number of top-rated funds owning its shares rose from 159 on Sep '18 to 185 in Sep '19, a reassuring sign concerning the I criteria. Its current Up/Down Volume Ratio of 1.4 is an unbiased indication its shares have been under accumulation over the past 50 days.
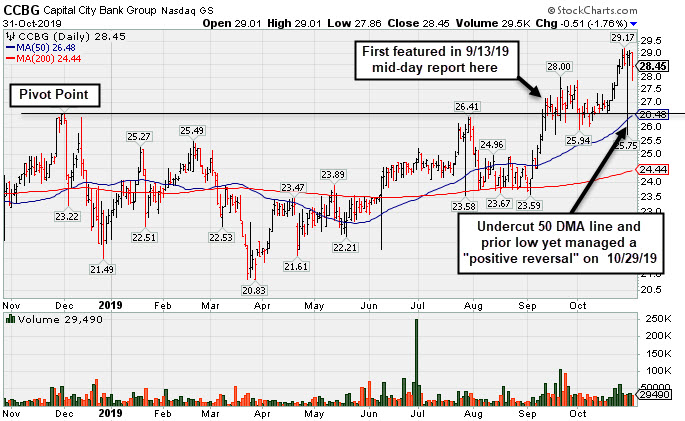
Noted "Positive Reversal" on Volatile Session After Earnings - Thursday, October 31, 2019
Capital City Bk Gp (CCBG -$0.51 or -1.76% to $28.45) is still hovering near its 52-week high. Prior highs define important support to watch along with its 50-day moving average (DMA) line ($25.45). It managed a "positive reversal" on 10/29/19 following another solid earnings report.
CCBG was highlighted in yellow with pivot point cited based on its 12/03/18 high plus 10 cents in the 9/13/19 mid-day report (read here). It hit a new 52-week high on 9/20/19 with a solid gain above the pivot point backed by +339% above average volume triggering a technical buy signal. It was last shown in this FSU section on 10/14/19 with an annotated graph under the headline, "Perched Near High With Earnings News Due Next Week".
Earnings increases in the 4 latest quarterly comparisons through Sep '19 were above the +25% minimum guideline (C criteria) as its sales revenues growth rate was in the 9-13% range versus the year ago periods. It has a Timeliness Rating of A, but a Sponsorship Rating of E.
Its small supply of only 16.7 million shares outstanding (S criteria) can contribute to greater price volatility in the event of institutional buying or selling. The number of top-rated funds owning its shares rose from 159 on Sep '18 to 188 in Sep '19, a reassuring sign concerning the I criteria. Its current Up/Down Volume Ratio of 1.7 is an unbiased indication its shares have been under accumulation over the past 50 days.
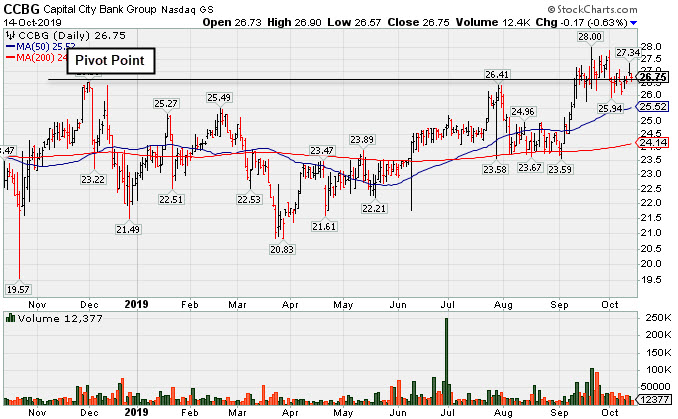
Perched Near High With Earnings News Due Next Week - Monday, October 14, 2019
Capital City Bk Gp (CCBG -$0.17 or -0.63% to $26.75) is still hovering near its 52-week high. Prior highs define initial support to watch above its 50-day moving average (DMA) line ($25.58).
CCBG was highlighted in yellow with pivot point cited based on its 12/03/18 high plus 10 cents in the 9/13/19 mid-day report (read here). It hit a new 52-week high on 9/20/19 with a solid gain above the pivot point backed by +339% above average volume triggering a technical buy signal. It was last shown in this FSU section on 9/27/19 with an annotated graph under the headline, "Stalled After Recent Rally for New High".
Keep in mind it is due to report earnings news on 10/21/19. Volume and volatility often increase near earnings news. Earnings increases in the 3 latest quarterly comparisons through Jun '19 were above the +25% minimum guideline (C criteria) as its sales revenues growth rate was in the 12-13% range in the Dec '18, Mar and Jun '19 quarters versus the year ago periods. It has a Timeliness Rating of A, but a Sponsorship Rating of E.
Its small supply of only 16.7 million shares outstanding (S criteria) can contribute to greater price volatility in the event of institutional buying or selling. The number of top-rated funds owning its shares rose from 159 on Sep '18 to 188 in Sep '19, a reassuring sign concerning the I criteria. Its current Up/Down Volume Ratio of 1.3 is an unbiased indication its shares have been under accumulation over the past 50 days.
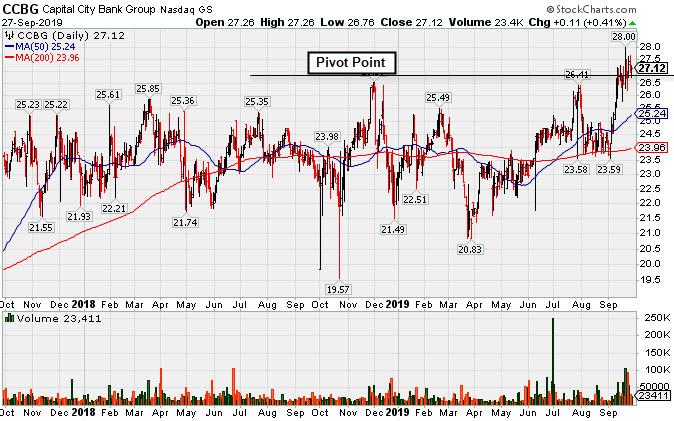
Stalled After Recent Rally for New High - Friday, September 27, 2019
Capital City Bk Gp (CCBG +$0.11 or +0.41% to $27.12) was highlighted in yellow with pivot point cited based on its 12/03/18 high plus 10 cents in the 9/13/19 mid-day report (read here). it stalled after hitting a new 52-week high on 9/20/19 with a solid gain above the pivot point backed by +339% above average volume triggering a technical buy signal. Prior highs in the $26 area define initial support to watch above its 50-day moving average (DMA) line ($25.33). It was last shown in this FSU section on 9/13/19 with an annotated graph under the headline, "Thinly Traded Bank Rallied To Multi-Year Highs".
Earnings increases in the 3 latest quarterly comparisons through Jun '19 were above the +25% minimum guideline (C criteria) as its sales revenues growth rate was in the 12-13% range in the Dec '18, Mar and Jun '19 quarters versus the year ago periods. It has a Timeliness Rating of A, but a Sponsorship Rating of D.
Its small supply of only 16.7 million shares outstanding (S criteria) can contribute to greater price volatility in the event of institutional buying or selling. The number of top-rated funds owning its shares rose from 159 on Sep '18 to 186 in Jun '19, a reassuring sign concerning the I criteria. Its current Up/Down Volume Ratio of 1.6 is an unbiased indication its shares have been under accumulation over the past 50 days.
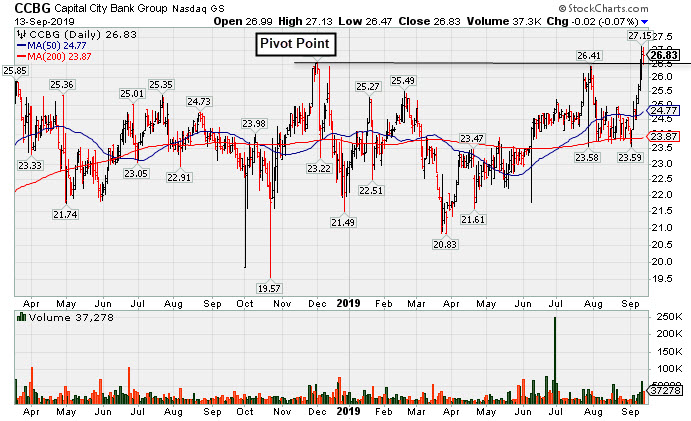
Thinly Traded Bank Rallied To Multi-Year Highs - Friday, September 13, 2019
Capital City Bk Gp (CCBG -0.02 or -0.07% to $26.83 ) was highlighted in yellow with pivot point cited based on its 12/03/18 high plus 10 cents in the earlier mid-day report (read here). This thinly traded Bank is perched at a new multi-year high after a streak of volume-driven gains this week. Subsequent confirming gains above the pivot point backed by at least +40% above average volume are needed to trigger a convincing technical buy signal.
Earnings increases in the 3 latest quarterly comparisons through Jun '19 were above the +25% minimum guideline (C criteria) as its sales revenues growth rate was in the 12-13% range in the Dec '18, Mar and Jun '19 quarters versus the year ago periods. It has a Timeliness Rating of A, but a Sponsorship Rating of D
Its small supply of only 16.7 million shares outstanding (S criteria) can contribute to greater price volatility in the event of institutional buying or selling. The number of top-rated funds owning its shares rose from 159 on Sep '18 to 187 in Jun '19, a reassuring sign concerning the I criteria. Its current Up/Down Volume Ratio of 2.1 is an unbiased indication its shares have been under accumulation over the past 50 days.