Negative Reversal Last Week; 200 DMA Test Now - Friday, July 27, 2007
A very important technical tool that savvy investors have learned to incorporate in their technical analysis is the 200-day moving average (DMA) line. The 200 DMA line plays a pivotal role relative to a stock's price. If the price of a stock is above its 200 DMA then odds are that its 200 DMA will act as longer term support. Conversely, if the price is below its 200 DMA then the moving average acts as resistance. Obviously, if a technical breakdown or violation takes place on heavy volume it is a more serious concern. Sometimes quiet violations are repaired quickly, without a lot of additional losses. However, the key moving averages are always an important line to watch.
CB Richard Ellis Group Inc. (CBG -$0.72 or -2.04% to $34.50) found support at its 200 DMA line on Friday. The stock is in the Real Estate Operations group which has been smacked from the recent woes in the housing market. Earlier this month, on July 13, 2007, CBG broke out to a new high, but volume failed to meet the minimum threshold needed to trigger a proper technical buy signal. The very next day the stock opened higher but closed lower which is also known as a "negative reversal" - an ominous chart pattern. Within a few days the stock negated its breakout and then sliced through its 50 DMA line with a considerable loss on heavy volume, a classic technical sell signal. Friday the stock traded under and closed six cents under its 200 DMA line, where it may find some support leading to its being dropped from the Featured Stocks List today.
CBG was first featured on Monday, June 20, 2005 in the CANSLIM.net Mid Day Breakouts Report (read here) with a $13.40 pivot point (split adjusted). The stock has rallied nearly three-fold since that first appearance. It spent most of 2006 consolidating. In mid-May of 2006, when sell signals were starting to add up, CANSLIM.net's May 16th, 2006 After Market Update's "Featured Stock Update" section included a detailed analysis of significant deterioration on heavy volume prompting greater concern (read here). This exemplifies the explosive and volatile potential in stocks, and also demonstrates how CANSLIM.net's services help investors to interpret the day-to-day action in leading stocks as it relates to making proper buy and sell decisions.
C A N S L I M | StockTalk | News | Chart | ![]() DGO | SEC | Zacks Reports
DGO | SEC | Zacks Reports

View all notes | Alert me of new notes | CANSLIM.net Company Profile
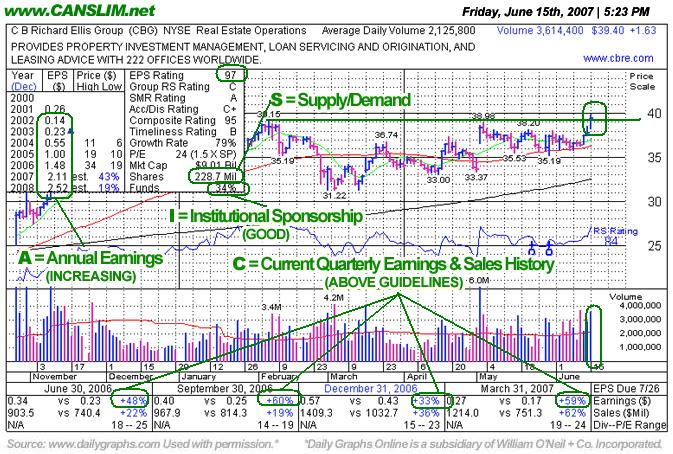
Fresh Breakout After Old Leader's Lengthy Consolidation - Friday, June 15, 2007
Volume is a vital component of technical analysis. Prudent investors that incorporate volume into their stock analysis have often benefited several fold. Ideally, healthy stocks will more often tend to rise on higher volume and pullback on lighter volume. Volume is a great proxy for institutional sponsorship. Conversely, high volume declines can be an ominous, as this usually signals distribution and further price deterioration are more likely to follow.
CB Richard Ellis Group Inc. (CBG +$1.63 or +3.97% to $39.40) rose from a 6 month base, vaulting above its latest pivot point of $39.98 with a gain backed by nearly two times its average daily trading volume. That's a very reassuring sign of institutional buying demand (the "I" criteria) and well above the "minimum +50% above average volume" guideline to trigger a technical buy signal. CB Richard Ellis sports a very healthy Earnings Per Share (EPS) rating of 97 and a Relative Strength (RS) rating of 84. The company has managed to increase its earnings by above the +25% guideline in each of the past four quarterly comparisons versus the year earlier, satisfying the "C" criteria. It should be noted that CBG resides in the Real Estate Operations group which is currently ranked 119th out the 197 Industry Groups covered in the paper, which places it out of the preferred top quartile of industry groups. It would be very encouraging to see CBG follow through next week with further gains on higher volume. Recently, the stock appeared in the May 18, 2007 edition of the CANSLIM.net After Market Update (read here) as it was setting up to breakout of its latest base. Its "maximum buy" price of $41.98 or higher is where it would be too extended from the latest base to be buyable under the proper guidelines. It is best to buy fresh breakouts very close to their pivot points. As always, it is of the utmost importance to sell a stock if it drops 7-8% below your purchase price.
CBG was first featured on Monday, June 20, 2005 in the CANSLIM.net Mid Day Breakouts Report (read here) with a $13.40 pivot point (split adjusted). The stock has rallied nearly three-fold since that first appearance. It spent most of 2006 consolidating. In mid-May of 2006, when sell signals were starting to add up, CANSLIM.net's May 16th, 2006 After Market Update's "Featured Stock Update" section included a detailed analysis of significant deterioration on heavy volume prompting greater concern (read here). This exemplifies both the explosive potential of CAN SLIM(R) orientated stocks, and also demonstrates how CANSLIM.net's services help investors to interpret the day-to-day action in leading stocks as it relates to making proper buy and sell decisions.
C A N S L I M | StockTalk | News | Chart | ![]() DGO | SEC | Zacks Reports
DGO | SEC | Zacks Reports
View all notes | Alert me of new notes | CANSLIM.net Company Profile
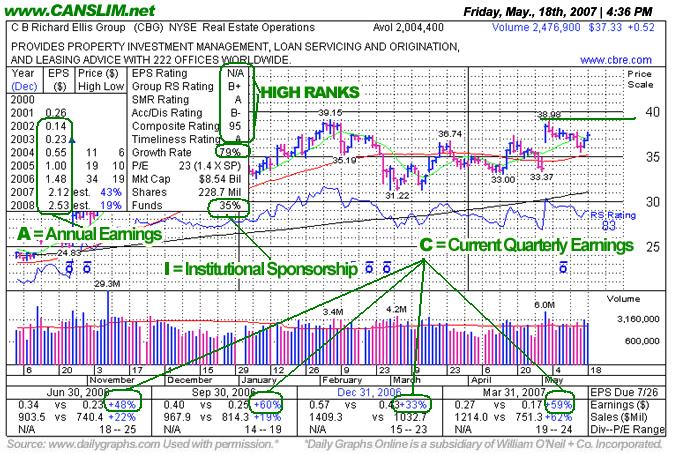
Previous Leader Building New Base - Friday, May 18, 2007
Group action plays a very important role, and experienced investors learn that they can increase their odds of picking a great winner by always focusing their buying efforts in the market's leading groups. The "L" criteria in CAN SLIM(R) tells us to choose leading companies in leading industry groups, thus it is suggested that investors choose from the top quartile of the 197 Industry Groups (listed in the paper most days on page B4). A classic example of the success enjoyed by many CANSLIM.net readers usually starts when an investor reads a CANSLIM.net report and buys a featured stock before it has risen above the pivot point by greater than 5%. After a stock breaks out above its pivot point, there is only a +5% window that investors have to purchase the stock under the proper guidelines. Once a stock rises above the "maximum buy price" the risk of a shake out balloons, meaning that even a normal retracement in the stock might force you to employ the 7-8% loss cutting rule. Much can be told by the stock's daily action in the weeks and months that follow a breakout. Typically, a light volume and orderly pullback suggests that the bulls remain in control. However, high volume pullbacks that violate support paint a totally different picture.CB Richard Ellis Group Inc. (CBG +$0.52 or +1.37% to $37.33) continues basing above its 50-day moving average (DMA) line, and it currently is trading below its pivot point of $38.98. The company sports a very healthy Earnings Per Share (EPS) rating of 98 and a Relative Strength (RS) rating of 83. The company has managed to increase its earnings by well over the +25% guideline in each of the past four quarterly comparisons versus the year earlier, satisfying the "C" criteria. CBG resides in the Real Estate Operations group which is currently ranked 60th of out the 197 Industry Groups covered in the paper, placing it just outside the much preferred top quartile. A new technical buy signal would be triggered if it trades above its pivot point with considerable gains on at least +50% above average volume, but until then patience is paramount. As always, once any stock is bought, it is of the utmost importance to protect you capital, so the CAN SLIM(R) investment system's rule is to sell whenever a stock you own drops 7-8% below your purchase price.
CBG was first featured on Monday, June 20, 2005 in the CANSLIM.net Mid Day Breakouts Report (read here) with a $13.40 pivot point (split adjusted). The stock has rallied nearly three-fold since that first appearance. It spent most of 2006 consolidating, and in mid-May of 2006, when sell signals were starting to add up, CANSLIM.net's May 16th, 2006 After Market Update's "Featured Stock Update" section included a detailed analysis of significant deterioration on heavy volume prompting greater concern (read here). This exemplifies the explosive potential of CAN SLIM(R) orientated stocks, and how CANSLIM.net's services help investors to interpret the day-to-day action in leading stocks.
C A N S L I M | StockTalk | News | Chart | SEC | Zacks Reports
View all notes | Alert me of new notes | CANSLIM.net Company Profile
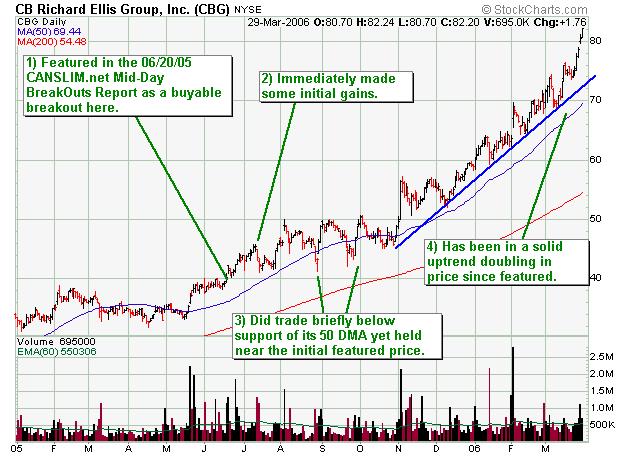
Another Winning Example to Study +100% Gain -
CB Richard Ellis Group Inc. (CBG -NYSE) This high-ranked leader was featured prominently in the June 20th, 2005 CANSLIM.net Mid-Day BreakOuts Report as a buyable breakout under the guidelines. Subscribers received that day's breakout report in their email inbox at about 1PM.
You can start receiving the CANSLIM.net Mid-Day BreakOuts Report, the same report where CBG was first featured as a buyable breakout. Plus, you will get immediate access to the CANSLIM.net Featured Stocks Page. This web page lists a handful of high-ranked, leading stocks that are currently near ideal buy points and have bullish technical chart patterns.
Important Support at 50 DMA and Upward Trendline Tested! - Tuesday, May 16, 2006
CB Richard Ellis Group Inc. (CBG +$3.22 or +3.74% to $82.83) rallied on above average volume on Tuesday. This stock was featured on Monday, June 20, 2005 in the CANSLIM.net Mid Day Breakouts Report (read here) at $41.69. In less than a year this stock has surged an impressive +114%, and during that time this stock has traced out a rather orderly advance while a longer term upward trendline has been established.
On Monday this stock briefly violated its 50 DMA on increasing volume. In fact, volume had been steadily expanding over the past few days as the price fell back toward that important short-term moving average. Typically, one would not want to see volume swell as an issue pulls back. For now, however, the bulls seem to have showed up and quelled the bearish selling. And what better place to find support than exactly at the lower boundary of CBG's longer term upward trendline and near its 50 DMA. As long as this issue trades above that important support level the bulls remain in control. More significant deterioration on heavy volume would prompt greater concern and trigger a technical sell signal.

Important Increases in Institutional Ownership - Monday, November 28, 2005
This high-ranked leader was featured in yellow at $41.78 in the June 24th CANSLIM.net Mid-Day BreakOuts Report and rallied as much as +33.45% since (read here). On August 24, 2005 an annotated DailyGraph(R) was included in follow-up analysis included in the "Featured Stocks Update" section of the CANSLIM.net After Market Report (read here). At that time it was pulling back and testing its multi-month upward trend line.
CB Richard Ellis Group Inc. (CBG -$0.90 or -1.59% to $55.75) closed today's (Monday, November 28th, 2005) session lower on below average volume. A view of its longer term chart suggests that this stock is currently in a well defined upward trend. This stock has shown steady improvement in the number of top-rated funds having an ownership interest. Typically, healthy stocks attract an increasing number of institutional holders as they maintain strong sales revenues and earnings growth.

CBG Testing Its Upward Trendline - Wednesday, August 24, 2005
CB Richard Ellis Group (CBG +0.35%, $0.16 to $46.51) has been a decent performer since it was featured as noteworthy and marked yellow in the June 24th, 2005 CANSLIM.net Mid-Day BreakOuts Report (see here). It is currently resting above its intermediate-term uptrend line, where a technical failure may hint at a possible deterioration in the uptrend. Trend lines are another tool investors can use to determine the actions of the institutional investors. After enjoying an impressive rally, even leading stocks tend to pullback and consolidate their gains and test their uptrend lines. Regular readers should recognize that trend lines are an important part to technical analysis.
The way an upward trend line is drawn is by connecting a string of prior price lows. They are particularly valid when three or more points are connected over at least a two or three month period of time. Once an upward trendline develops it is preferred for a stock to find support there during pullbacks. If a stock fails to find support at its uptrend line and that trend line is breached, such violations can sometimes serve as an early warning signal for investors as to the possibility of more serious declines. In this case, the stock's 50-day moving average is another nearby support level to watch, and a violation there would be another key technical sell signal prompting more serious concern.
