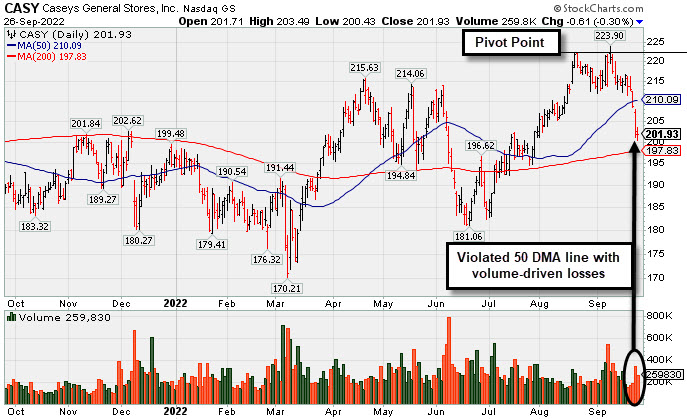
Damaging Slump Below 50-Day Moving Average Hurt Outlook - Monday, September 26, 2022
Casey's General Stores (CASY -$0.61 or -0.30% to $201.93) ended the session lower. It violated its 50-day moving average (DMA) line ($210) decisively last week as above average volume was behind damaging losses triggering a technical sell signal. Only a prompt rebound above the 50 DMA line would help its outlook improve.
CASY was highlighted in yellow in the 9/09/22 mid-day report (read here) with pivot point cited based on its 8/22/22 high. It was perched within close striking distance of its all-time high. Disciplined investors may note that it did not produce subsequent gains above the pivot point backed by at least +40% above average volume, so it failed to trigger a technical buy signal.
CASY reported earnings +28% on +40% sales revenues for the Jul '22 quarter versus the year ago period, its 3rd strong quarterly comparison above the +25% minimum earnings guideline (C criteria). Its annual earnings (A criteria) history has been strong and it has an earnings Per Share Rating of 96. It hails from the RETAIL - Super/Mini Markets group which is currently ranked 6th on the 197 Industry Groups list (L criteria).
There are 37.3 million shares outstanding (S criteria) which can contribute to greater price volatility in the event of institutional buying or selling. The number of top-rated funds owning its shares rose from 565 in Mar '22 to 601 in Jun '22, a reassuring sign concerning the I criteria. Its current Up/Down Volume Ratio of 1.1 is an unbiased indication its shares have been under accumulation over the past 50 days.
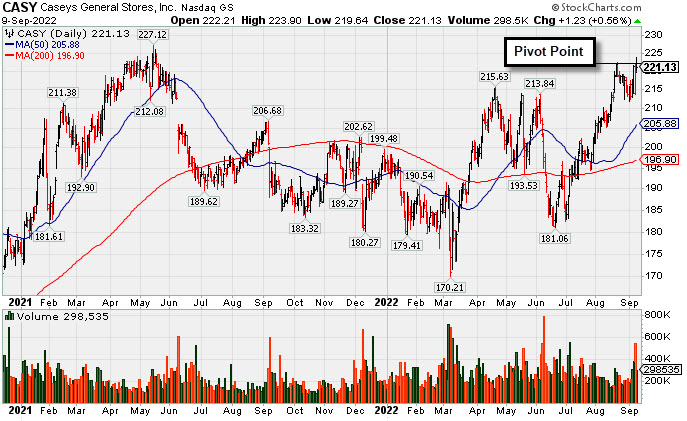
Casey's is Perched Within Close Range of All-Time High - Friday, September 9, 2022
Casey's General Stores (CASY +$1.23 or +0.56% to $221.13) posted a gain but closed in the lower half of its intra-day range on Friday. It churned heavier volume on the prior session and closed with a loss after highlighted in yellow in the mid-day report (read here) with pivot point cited based on its 8/22/22 high. It is perched within close striking distance of its all-time high. Subsequent gains above the pivot point backed by at least +40% above average volume may trigger a technical buy signal. The recent low ($211.95 on 9/01/22) defines near-term support above its 50-day moving average (DMA) line.
CASY reported earnings +28% on +40% sales revenues for the Jul '22 quarter versus the year ago period, its 3rd strong quarterly comparison above the +25% minimum earnings guideline (C criteria). Its annual earnings (A criteria) history has been strong and it has an earnings Per Share Rating of 96. It hails from the RETAIL - Super/Mini Markets group which is currently ranked 6th on the 197 Industry Groups list (L criteria).
There are 37.2 million shares outstanding (S criteria) which can contribute to greater price volatility in the event of institutional buying or selling. The number of top-rated funds owning its shares rose from 565 in Mar '22 to 600 in Jun '22, a reassuring sign concerning the I criteria. Its current Up/Down Volume Ratio of 1.4 is an unbiased indication its shares have been under accumulation over the past 50 days.