Found Support Near Prior Highs and 50 Day Moving Average - Friday, July 6, 2018
Baozun Onc (BZUN +$0.34 or +0.62% to $55.44) found support near prior highs in the $52 area while recently consolidating near its 50-day moving average (DMA) line ($55.44). The recent low ($51.50 on 6/27/18) defines the next important near-term support.BZUN was highlighted in yellow with pivot point cited based on its 3/21/18 high plus 10 cents in the 5/15/18 mid-day report (read here). It was last shown in this FSU section on 5/16/18 with an annotated graph under the headline, "Earnings News Due; Formed a Base-on-Base Pattern". It reported earnings +29% on +25% sales revenues for the Mar '18 quarter versus the year-ago period. Three of the past 4 quarterly reports had earnings above the +25% minimum (C criteria), helping it match the fact-based investment system's fundamental guidelines. Annual earnings growth (A criteria) has been strong since its $10 IPO in May 2015. It has earned a 97 earnings Per Share Rating, well above the 80+ minimum guideline for buy candidates.
The number of top-rated funds owning its shares rose from 115 in Jun '17 to 198 in Jun '18, a reassuring sign concerning the I criteria. Its small supply of only 18.8 million shares in the public float (S criteria) can contribute to greater price volatility n the event of institutional buying or selling. It has a Timeliness Rating of B and Sponsorship Rating of A.
Charts courtesy of www.stockcharts.com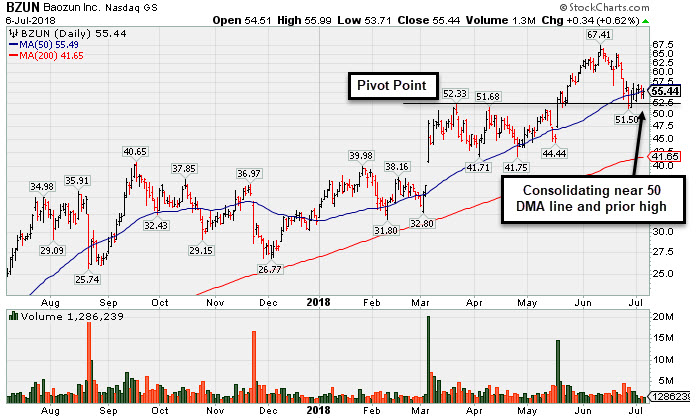
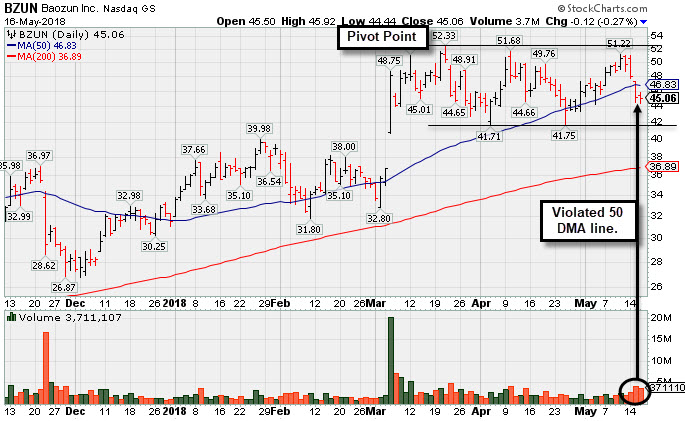
Earnings News Due; Formed a Base-on-Base Pattern - Wednesday, May 16, 2018
Baozun Onc (BZUN -$0.12 or -0.27% to $45.06) was highlighted in yellow with pivot point cited based on its 3/21/18 high plus 10 cents in the 5/15/18 mid-day report (read here). Disciplined investors know that subsequent volume-driven gains above the pivot point are still needed to trigger a proper technical buy signal. This China-based Computer Software - Enterprise firm gapped down on 5/15/18 and undercut its 50-day moving average (DMA) line ($46.84) with a volume-driven loss indicative of distributional pressure. Despite the noted weak action it is still hovering near its all-time high, building a base-on-base pattern following a considerable 'breakaway gap' on 3/06/18.Members were reminded that the company is due to report results for the first quarter ended March 31, 2018, on Thursday, May 17, 2018, before the open. Volume and volatility often increase near earnings news. Three of the past 4 quarterly reports had earnings above the +25% minimum (C criteria), helping it better match the fact-based investment system's fundamental guidelines. Annual earnings growth (A criteria) has been strong since its $10 IPO in May 2015. It has earned a 96 earnings Per Share Rating, well above the 80+ minimum guideline for buy candidates.
The number of top-rated funds owning its shares rose from 115 in Jun '17 to 171 in Mar '18, a reassuring sign concerning the I criteria. Its small supply of only 18.8 million shares in the public float (S criteria) can contribute to greater price volatility n the event of institutional buying or selling. It has a Timeliness Rating of A and Sponsorship Rating of A.
Charts courtesy of www.stockcharts.com