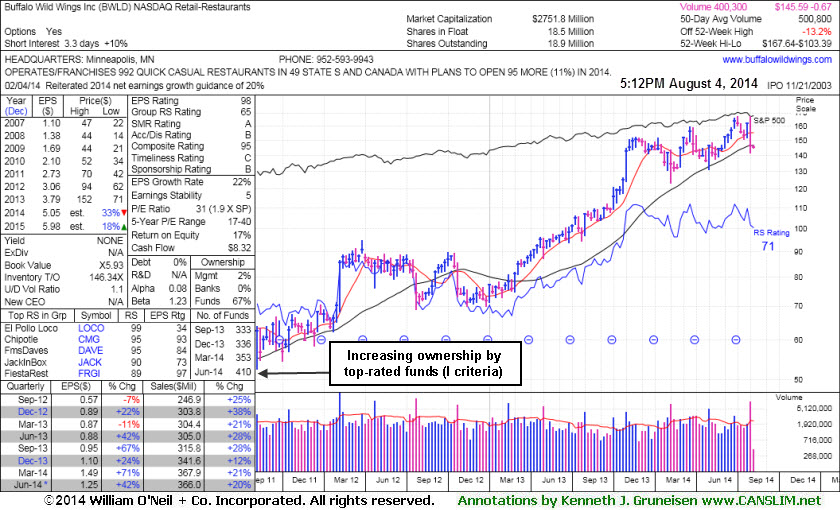
The number of top-rated funds owning its shares rose from 333 in Sep '13 to 410 in Jun '14, a reassuring sign concerning the I criteria. Prior reports cautioned members - "Its small supply of only 18.9 million shares (S criteria) outstanding can contribute to great price volatility in the event of institutional buying or selling."
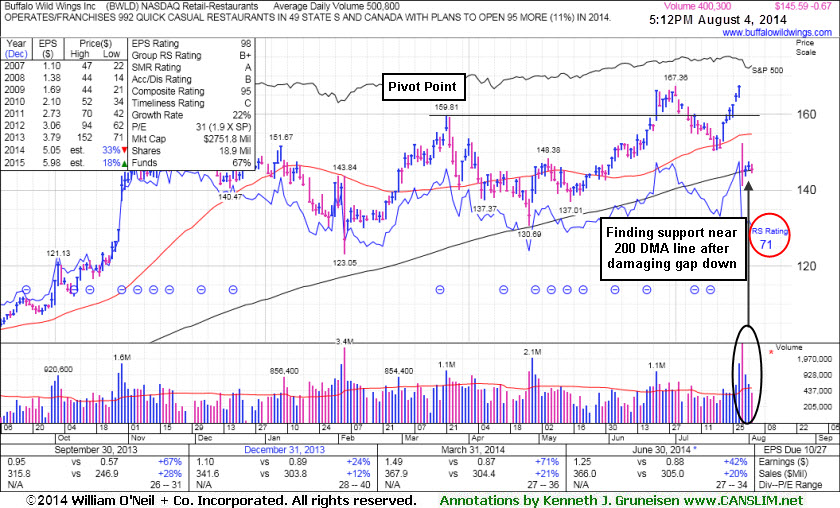
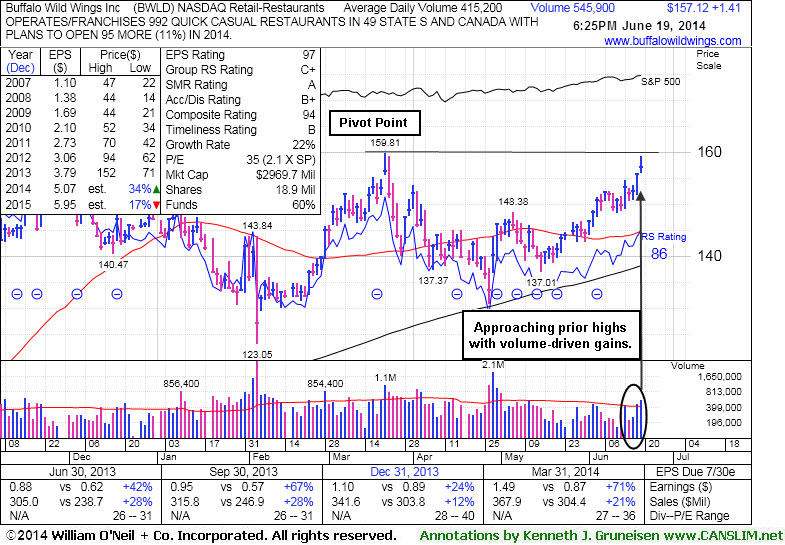
A volume-driven gain on 6/23/14 triggered a technical buy signal shortly after last shown in this FSU section on 6/19/14 with annotated graphs under the headline, "Perched Near Highs With Strong Fundamentals". The pivot point cited was based on its 3/21/14 high plus 10 cents as it was highlighted in yellow in the 6/19/14 mid-day report (read here). It reported earnings +71% on +21% sales revenues for the Mar '14 quarter, well above the +25% minimum earnings (C criteria) guideline, an improvement after a slightly sub par quarter. It found support at its 200-day moving average (DMA) line then rebounded since noted with caution in the 4/03/14 mid-day report - "Reported earnings +24% on +12% sales revenues for the Dec '13 quarter."
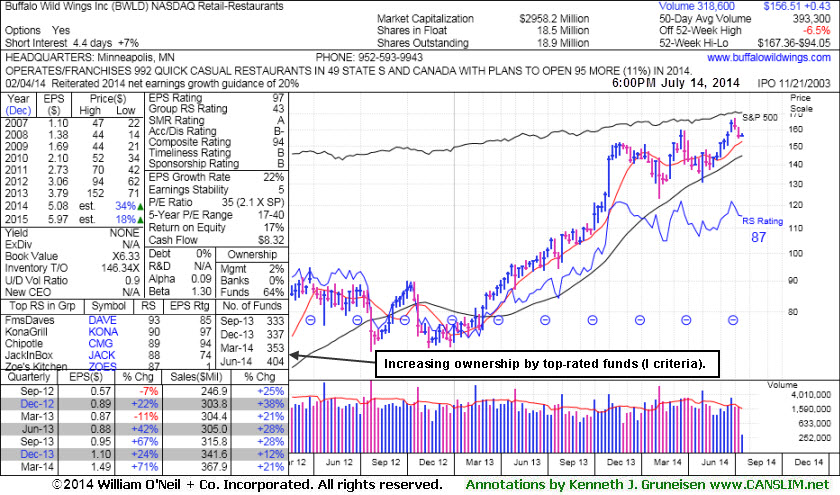
The number of top-rated funds owning its shares rose from 333 in Sep '13 to 404 in Jun '14, a reassuring sign concerning the I criteria. Its small supply of only 18.9 million shares (S criteria) outstanding can contribute to great price volatility in the event of institutional buying or selling.
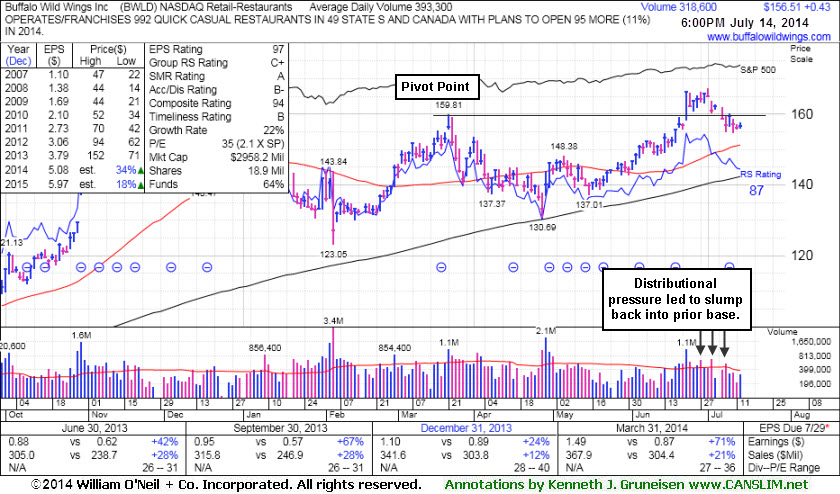
It reported earnings +71% on +21% sales revenues for the Mar '14 quarter, well above the +25% minimum earnings (C criteria) guideline, an improvement after a slightly sub par quarter. It found support at its 200-day moving average (DMA) line then rebounded since last noted with caution in the 4/03/14 mid-day report - "Reported earnings +24% on +12% sales revenues for the Dec '13 quarter."
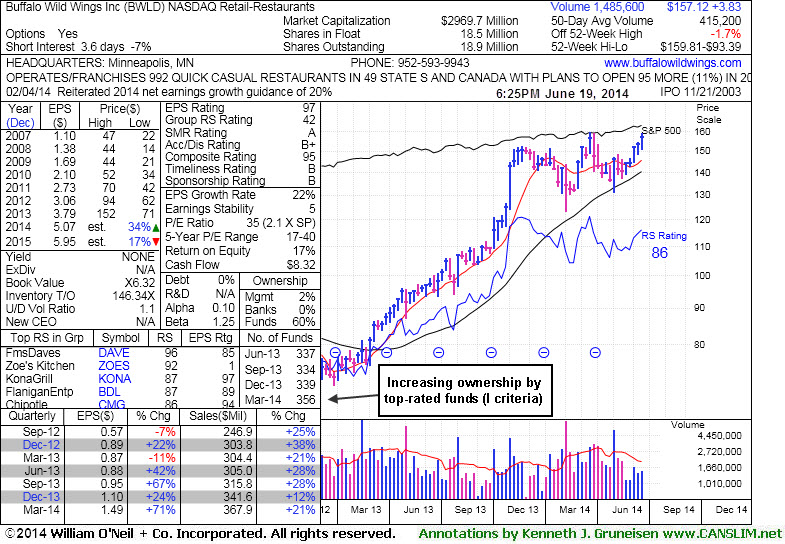
The number of top-rated funds owning its shares rose from 337 in Jun '13 to 356 in Mar '14, a reassuring sign concerning the I criteria. Its small supply of only 18.9 million shares (S criteria) outstanding can contribute to great price volatility in the event of institutional buying or selling.
One of the critical characteristics of successful investing is knowing when to sell. Investors are best served when they buy based on the combination of strong fundamentals and technicals, then sell based on the technicals. The reason is because fundamentals often tend to lag a stock's technical condition and come to light later to help explain the technical chart action after the fact.
Buffalo Wild Wings Inc. (BWLD -$7.6601 or -17.59% to $35.89) gapped down after reporting its second quarter financial results. BWLD had been a very strong leader this year and it nearly doubled after it was first featured. Until a couple of weeks ago, it had stayed well above its 50-day moving average (DMA) line. Above that important short-term average, the bulls technically remain in control. However, concerns started to mount as the stock sank under its 50 DMA line, and then it soon violated its earlier (June) chart lows, which were another important technical support level savvy chart readers saw breached prior to today's disappointment. It demonstrated encouraging strength ahead of its earnings news, rallying above its 50 DMA line on July 31st for a considerable gain backed by almost 3 times average volume. And volume was not particularly high behind any recent losses. However, the volume total behind the gap down and considerable loss today triggered a decisive technical sell signal as volume increased to nearly 5 times its average daily trading total. When the heaviest volume accompanies the largest one-day loss in more than a year, it is a clear indication of institutional selling or distribution.
The market was in the middle of a steep correction when BWLD was first featured on Tuesday, March 13, 2007 in the CANSLIM.net Mid Day Breakouts Report (read here) with a $29.64 pivot point and a $31.12 maximum buy price. CANSLIM.net's experts carefully noted the stock as follows - "Gains today on above average volume as the base has improved and ranks remain high. This company is the leader in its group. Being featured today as a "set-up" meaning that a break above the pivot point of $29.64 (split adjusted) with the required volume of 50% above the 50 DAV would have it triggering a technical buy signal up to the max buy price. This high-ranked leader should be on your watch list as a possible buy candidate, with improvement in the market being necessary before action is justified."
On March 21, 2007 the market's major averages posted a follow-through day, improving things with respect to the "M" criteria considerably. A few days after that follow-through, BWLD also appeared in the March 22nd, 2007 CANSLIM.net Special Report entitled "8 Stocks That Should Now Be On Your Watchlist" (read here). In the report, a $29.64 (split adjusted) pivot point and a $31.12 (split adjusted) maximum buy price were again cited. Two days after that report, on March 27, 2007, BWLD triggered a technical buy signal when it surged above its pivot point with gains on nearly three times average volume. After that powerful breakout the stock edged higher, then it built a short flat base, which is typical action for a healthy stock.
On Wednesday, May 2, 2007, the stock gapped up for an explosive gain to a new all-time high on its highest volume ever! The catalyst for that explosive move was, you guessed it - earnings news! However, BWLD gapped down after its latest earnings report. This example shows how leaders can get into trouble during questionable market conditions, and it also demonstrates how volatile stocks can get near earnings announcements. Hopefully there were many astute investors who decided to lock in profits and reduce exposure when the broader market and stocks like BWLD turned lower last week.
Watchful readers of the CANSLIM.net After market Update saw BWLD noted in the July 26th, 2007 report that evening as follows - "Continued declines today after yesterday's declines that were clearly breaking support." (read here)C A N S L I M | StockTalk | News | Chart | ![]() DGO | SEC | Zacks Reports
DGO | SEC | Zacks Reports

View all notes | Alert me of new notes | CANSLIM.net Company Profile
A very important technical tool that savvy investors have learned to incorporate in their technical analysis is the 50-day moving average (DMA) line. The 50 DMA line plays a pivotal role relative to a stock's price. If the price of a stock is above its 50 DMA then odds are that its 50 DMA will act as formidable support. Conversely, if the price is below its 50 DMA then the moving average acts as resistance. Healthy stocks sometimes trade under their 50 DMA lines briefly, but usually a strong candidate will promptly bounce and repair a 50 DMA violation. When a stock has violated its 50 DMA line and then lingers beneath it, the stock's outlook gets worse and worse as it spends a greater period of time trading under that important short-term average line. Once the 50 DMA line starts sloping downward it should also be acknowledged that the stock has been struggling for a while, and it might be time to reduce exposure and look for places to put that money to work in stronger buy candidates.
Buffalo Wild Wings Inc. (BWLD -1.33 or -3.11% to $41.41) continued pulling back towards its 50 DMA line. The chicken wing chain has surged +40% since it was first featured in the March 13, 2007 CANSLIM.net Mid Day Breakouts Report (read here) with a $29.64 (split adjusted) pivot point. It has stayed well above that important short term average during its very healthy advance, and the bulls technically remain in control as long as this important level is not taken out.
When BWLD was first featured, the market was in the middle of a steep correction, so CANSLIM.net's experts carefully noted the stock as follows - "Gains today on above average volume as the base has improved and ranks remain high. This company is the leader in its group. Being featured today as a "set-up" meaning that a break above the pivot point of $29.64 (split adjusted) with the required volume of 50% above the 50 DAV would have it triggering a technical buy signal up to the max buy price. This high-ranked leader should be on your watch list as a possible buy candidate, with improvement in the market being necessary before action is justified."
On March 21, 2007 the market's major averages posted a follow-through day, improving things with respect to the "M" criteria considerably. A few days after that follow-through, BWLD also appeared in the March 22nd, 2007 CANSLIM.net Special Report entitled "8 Stocks That Should Now Be On Your Watchlist" (read here). In the report a $29.64 (split adjusted) pivot point and a $31.12 (split adjusted) maximum buy price were cited. Two days after that report, on March 27, 2007, BWLD triggered a technical buy signal when it surged above its pivot point with gains on nearly three times average volume. After that powerful breakout the stock edged higher, then it built a short flat base, which is typical action for a healthy stock.
On Wednesday, May 2, 2007, the stock gapped up for an explosive gain to a new all-time high on its highest volume ever! The catalyst for this explosive move was, you guessed it - earnings! The company smashed views with profits that surged +60% in the first quarter while sales swelled +24%. That action was discussed in the May 4, 2007 edition of CANSLIM.net's After Market Update (read here) with the following note, "Today the stock is trading far above its $31.12 "maximum buy" price, and one of two things has to happen before it again might become buyable under the guidelines. First, a new base might develop which will generate a new pivot point and a new maximum buy price. Or second, BWLD will pullback, preferably on light volume, and find support near its prior chart highs just above $67 [that'd be $33.50 split adjusted], where a layer of support comes into play well before it might threaten its 50-day moving average (DMA) line. Buying without a pullback to chart support, or buying without waiting for a proper set-up and breakout, would not be prudent." The latter scenario appears to be unfolding. BWLD may be considered buyable again as it bounces off its 50 DMA line. However, a damaging breakdown would trigger a technical sell signal.
C A N S L I M | StockTalk | News | Chart | ![]() DGO | SEC | Zacks Reports
DGO | SEC | Zacks Reports

View all notes | Alert me of new notes | CANSLIM.net Company Profile
A classic example of the success enjoyed by many CANSLIM.net readers usually starts when an investor reads a CANSLIM.net report and buys a featured stock before it has risen above the pivot point by greater than 5%. After a stock breaks out above its pivot point, there is only a +5% window that investors have to purchase the stock under the proper guidelines. Once a stock rises above the "maximum buy price" the risk of a shake out balloons, meaning that even a normal retracement in the stock might force you to employ the 7-8% loss cutting rule. Much can be told by the stock's daily action in the weeks and months that follow a breakout. Typically, a light volume and orderly pullback suggests that the bulls remain in control. However, high volume pullbacks that violate support paint a totally different picture.
Buffalo Wild Wings Inc. (BWLD +$3.11 or +4.25% to $76.33) jumped to another new all-time high with gains on above average volume after releasing their latest earnings report earlier this week. BWLD has jumped +28.76% since it rose above its pivot point, and the bullish action continued all the way through Friday's strong close near its intra-day high. This stock was first featured in March 13, 2007 CANSLIM.net Mid Day Breakouts Report (read here) with a $59.28 pivot point. At that time the market was in a correction, so CANSLIM.net's experts carefully noted the stock as follows - "Gains today on above average volume as the base has improved and ranks remain high. This company is the leader in its group. Being featured today as a "set-up" meaning that a break above the pivot point of $59.28 (10 cents above the recent 1/16 high) with the required volume of 50% above the 50 DAV would have it triggering a technical buy signal up to the max buy price. This high-ranked leader should be on your watch list as a possible buy candidate, with improvement in the market being necessary before action is justified."
On March 21, 2007 the market's major averages posted a follow-through day. A few days after that follow-through, BWLD appeared in the CANSLIM.net Special Report entitled "8 Stocks That Should Now Be On Your Watchlist" (read here). In the report a $59.28 pivot point and a $62.24 maximum buy price were cited. Two days after that report, on March 27, 2007, BWLD triggered a technical buy signal when it surged above its pivot point with gains on nearly three times average volume. After that powerful breakout the stock edged higher, then it built a short flat base, which is typical action for a healthy stock. On Wednesday, May 2, 2007, the stock gapped up for an explosive gain to a new all-time high on its highest volume ever! The catalyst for this explosive move was, you guessed it - earnings! The company smashed views with profits that surged +57% in the first quarter while sales swelled +24%. Today the stock is trading far above its $62.24 "maximum buy" price, and one of two things has to happen before it again might become buyable under the guidelines. First, a new base might develop which will generate a new pivot point and a new maximum buy price. Or second, BWLD will pullback, preferably on light volume, and find support near its prior chart highs just above $67, where a layer of support comes into play well before it might threaten its 50-day moving average (DMA) line. Buying without a pullback to chart support, or buying without waiting for a proper set-up and breakout, would not be prudent.
C A N S L I M | StockTalk | News | Chart | ![]() DGO | SEC | Zacks Reports
DGO | SEC | Zacks Reports

View all notes | Alert me of new notes | CANSLIM.net Company Profile
Often, when a leading stock is setting up to breakout of a solid base it is highlighted in CANSLIM.net's Mid-Day Breakouts Report. The most relevant factors are noted in the report which allows prudent CANSLIM oriented investors to place the issue in their watch list. After doing any necessary backup research, the investor is prepared to act if and when the stock triggers a technical buy signal (breaks above its pivot point on more than +50% average turnover). In the event the stock fails to trigger a technical buy signal and its price declines then it will simply be removed from the watch list.
Buffalo Wild Wings Inc. (BWLD +$0.28 or +0.49% to $56.29) ended near its session's lows after having better gains earlier. It remains perched near its all-time highs, despite the weak market conditions which are weighing on the majority of issues. This stock was first featured in today's CANSLIM.net Mid Day Breakouts Report (read here) with a $59.28 pivot point. BWLD sports a very healthy Earnings Per Share (EPS) rating of 95. It is also encouraging to see the company earn a healthy Relative Strength (RS) rating of 88. The company has managed to increase its earnings by above the +25% guideline in each of the past four quarterly comparisons versus the year earlier, satisfying the "C" criteria. BWLD resides in the Retail-restaurants group which is currently ranked 72nd of out the 197 Industry Groups covered in the paper, placing it a bit outside of the much preferred top quartile. Despite BWLD's high ranks and decent performance on Tuesday, it has yet to trade above its pivot point. Odds were stacked against it considerably as the major averages continued their recent slide.
Disciplined investors wait for a stock to trade above its pivot point with gains on the necessary volume (at least +50% above average) to trigger a proper technical buy signal. Doing so is crucial to the successful CAN SLIM(R) investment system. Investors who try to get a head start by buying stocks "early", before a proper technical buy signal is triggered, are not following the guidelines. Those who do not follow the guidelines are more prone to failure. Furthermore, when market conditions are hurting investors' odds, the "M" criteria in CANSLIM is considered to be questionable, arguing against making any new buying efforts, no matter how compelling the buy candidate may seem.
C A N S L I M | StockTalk | News | Chart | ![]() DGO | SEC | Zacks Reports
DGO | SEC | Zacks Reports

View all notes | Alert me of new notes | CANSLIM.net Company Profile
-- --