There are no featured stock write-ups on BOFI proir to 2/18/2025
 Upgrade your membership to see all of the expert analysis we have published on BOFI now!
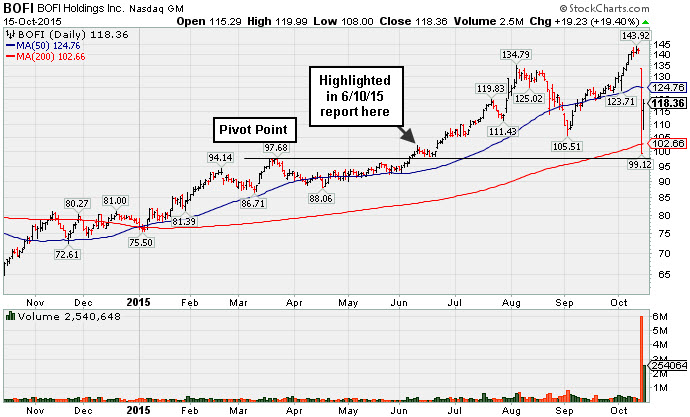
Bounced Back Following Damaging Loss After Wedging From V-Shaped Consolidation - Thursday, October 15, 2015
B O F I Holding Inc (BOFI +$19.23 or +19.40% to $118.36) bounced back impressively today following a violation of its 50-day moving average (DMA) line with a damaging volume-driven loss triggering a technical sell signal on the prior session. The abrupt downdraft came after the stock had wedged higher with gains lacking great volume conviction while repeatedly noted with caution - "The recent 'V' shaped consolidation over 10 weeks was not recognized as a sound base." BOFI was last shown in this FSU section on 10/05/15 with an annotated graph under the headline, "Rebounding Near Prior High After 'V' Shaped Consolidation".
Its move into new high territory may have attracted some investors recently, but disciplined members would note that under the fact-based investment system's guidelines BOFI had not recently flashed reassuring signs arguing in favor of new buying efforts. Shareholder lawsuits and surprise setbacks can come suddenly with any stock. However, historic studies have shown that investors are less likely to suffer bad setbacks after buying fundamentally superior leaders that produced powerful breakouts from technically sound base patterns.
It reported Jun '15 quarterly earnings +41% on +42% sales revenues, above the +25% minimum earnings guideline (C criteria). Earnings rose by +35%, +40%, +41%, +38%, and +35% in the Mar, Jun, Sep, Dec '14, and Mar '15 quarters, respectively, versus the year ago periods. Sales revenues were up +21%, +24%, +39%, +41%, and +41% during that span. Following a downturn in its FY '11 earnings its annual earnings (A criteria) history has been strong.
The number of top-rated funds owning share rose from 261 in Sep '14 to 290 in Jun '15. Leadership from other Finance - Savings & Loan issues has been reassuring concerning the L criteria. It has earned a Timeliness rating of A, and a Sponsorship rating of C. Keep in mind that its small supply of only 13.8 million shares (S criteria) in the public float can contribute to greater price volatility in the event of institutional buying or selling. BOFI was highlighted in yellow at $101.47 with pivot point cited based on its 3/23/15 high plus 10 cents in the 6/10/15 mid-day report (read here) while noted - "It clinched a technical buy signal with a gain backed by +55% above average volume on the prior session."
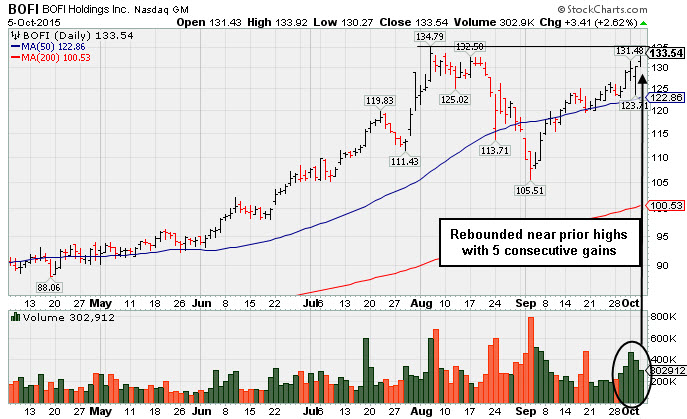
Rebounding Near Prior High After "V" Shaped Consolidation - Monday, October 5, 2015
B O F I Holding Inc (BOFI +$3.41 or +2.62% to $133.54) rebounded to a best ever close today. No resistance remains due to overhead supply, however the "V" shaped consolidation over the past 10 weeks is not recognized as an ideal base pattern. Recent market strength (M criteria) gave a reassuring sign arguing in favor of new buying efforts under the fact-based investment system. BOFI was last shown in this FSU section on 9/18/15 with an annotated graph under the headline, "Slumped Below 50-Day Average With Higher Volume Loss".
It reported Jun '15 quarterly earnings +41% on +42% sales revenues, above the +25% minimum earnings guideline (C criteria). Earnings rose by +35%, +40%, +41%, +38%, and +35% in the Mar, Jun, Sep, Dec '14, and Mar '15 quarters, respectively, versus the year ago periods. Sales revenues were up +21%, +24%, +39%, +41%, and +41% during that span. Following a downturn in its FY '11 earnings its annual earnings (A criteria) history has been strong.
The number of top-rated funds owning share rose from 261 in Sep '14 to 288 in Jun '15. Leadership from other Finance - Savings & Loan issues has been reassuring concerning the L criteria. It has earned a Timeliness rating of A, and a Sponsorship rating of C. Keep in mind that its small supply of only 13.8 million shares (S criteria) in the public float can contribute to greater price volatility in the event of institutional buying or selling. BOFI was highlighted in yellow with pivot point cited based on its 3/23/15 high plus 10 cents in the 6/10/15 mid-day report (read here) while noted - "It clinched a technical buy signal with a gain backed by +55% above average volume on the prior session."
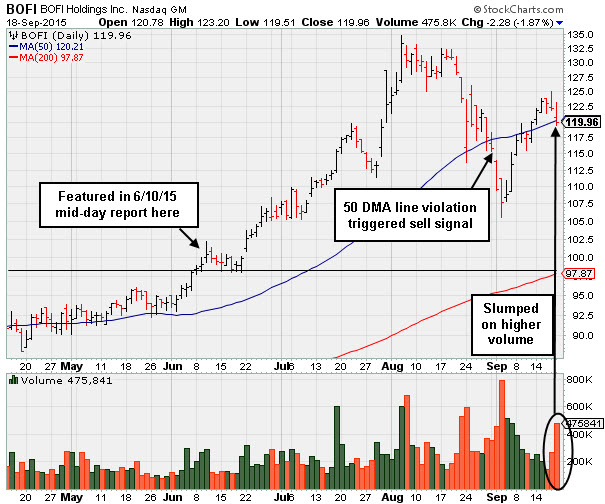
Slumped Below 50-Day Average With Higher Volume Loss - Friday, September 18, 2015
B O F I Holding Inc (BOFI -$2.28 or -1.87% to $119.96) slumped back to close just below its 50-day moving average (DMA) line on Friday. The loss came with above average volume, whereas recent gains above the 50 DMA line had lacked great volume conviction. It has not formed a sound base, and further deterioration below the 50 DMA line would hurt its near-term outlook. It faces resistance due to overhead supply up through the $134 level.
BOFI was last shown in this FSU section on 9/11/15 with an annotated graph under the headline, "Quiet Gain to Finish Above 50 Day Moving Average". It reported Jun '15 quarterly earnings +41% on +42% sales revenues, above the +25% minimum earnings guideline (C criteria). Earnings rose by +35%, +40%, +41%, +38%, and +35% in the Mar, Jun, Sep, Dec '14, and Mar '15 quarters, respectively, versus the year ago periods. Sales revenues were up +21%, +24%, +39%, +41%, and +41% during that span. Following a downturn in its FY '11 earnings its annual earnings (A criteria) history has been strong.
The number of top-rated funds owning share rose from 261 in Sep '14 to 282 in Jun '15. Leadership from other Finance - Savings & Loan issues has been reassuring concerning the L criteria. It has earned a Timeliness rating of A, and a Sponsorship rating of B. Keep in mind that its small supply of only 13.8 million shares (S criteria) in the public float can contribute to greater price volatility in the event of institutional buying or selling. BOFI was highlighted in yellow with pivot point cited based on its 3/23/15 high plus 10 cents in the 6/10/15 mid-day report (read
here) while noted - "It clinched a technical buy signal with a gain backed by +55% above average volume on the prior session."
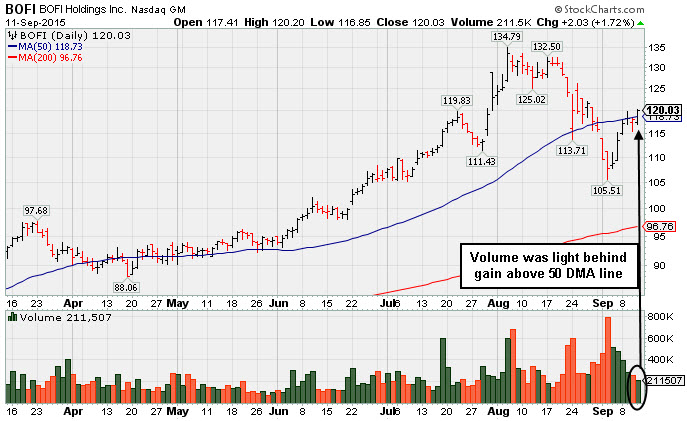
Quiet Gain to Finish Above 50 Day Moving Average - Friday, September 11, 2015
B O F I Holding Inc (BOFI +$2.03 or +1.72% to $120.03) rebounded above its 50-day moving average (DMA) line with a gain on below average volume. The finish above the 50 DMA line helped its outlook to improve, however it has not formed a sound base pattern, and it faces resistance up through the $134 level. It was last shown in this FSU section on 9/02/15 with an annotated graph under the headline, "Damaging Losses Triggered Technical Sell Signal", after violating its 50-day moving average (DMA) line during its streak of damaging volume-driven losses.
It reported Jun '15 quarterly earnings +41% on +42% sales revenues, above the +25% minimum earnings guideline (C criteria) again. Earnings rose by +35%, +40%, +41%, +38%, and +35% in the Mar, Jun, Sep, Dec '14, and Mar '15 quarters, respectively, versus the year ago periods. Sales revenues were up +21%, +24%, +39%, +41%, and +41% during that span. Following a downturn in its FY '11 earnings its annual earnings (A criteria) history has been strong.
The number of top-rated funds owning share rose from 261 in Sep '14 to 279 in Jun '15. Leadership from other Finance - Savings & Loan issues has been reassuring concerning the L criteria. It has earned a Timeliness rating of A, and a Sponsorship rating of B. Keep in mind that its small supply of only 13.8 million shares (S criteria) in the public float can contribute to greater price volatility in the event of institutional buying or selling. BOFI was highlighted in yellow with pivot point cited based on its 3/23/15 high plus 10 cents in the 6/10/15 mid-day report (read
here) while noted - "It clinched a technical buy signal with a gain backed by +55% above average volume on the prior session."
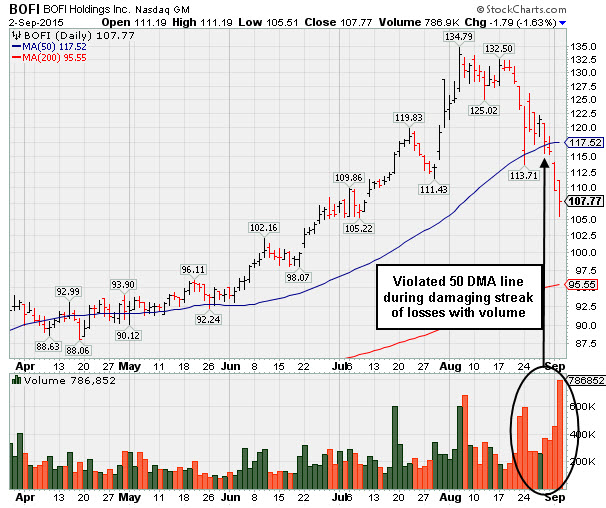
Damaging Losses Triggered Technical Sell Signal - Wednesday, September 2, 2015
B O F I Holding Inc (BOFI -$1.79 or -1.63% to $107.77) violated its 50-day moving average (DMA) line triggering a technical sell signal during its streak of damaging volume-driven losses. It is extended from any sound base. A prompt rebound above the 50 DMA line is needed for its outlook to improve. It was last shown in this FSU section on 8/20/15 with an annotated graph under the headline, "Hovering Near Highs Very Extended From Sound Base". Worrisoe losses came after it was noted with caution - "It may produce more climactic gains, however it is very extended from its prior base. Its recent low ($111.43 on 7/29/15) defines near term support above its 50 DMA line."
It reported Jun '15 quarterly earnings +41% on +42% sales revenues, above the +25% minimum earnings guideline (C criteria) again. Earnings rose by +35%, +40%, +41%, +38%, and +35% in the Mar, Jun, Sep, Dec '14, and Mar '15 quarters, respectively, versus the year ago periods. Sales revenues were up +21%, +24%, +39%, +41%, and +41% during that span. Following a downturn in its FY '11 earnings its annual earnings (A criteria) history has been strong.
Leadership from other Finance - Savings & Loan issues has been reassuring concerning the L criteria. It has earned a Timeliness rating of A, and a Sponsorship rating of B. Keep in mind that its small supply of only 13.6 million shares (S criteria) in the public float can contribute to greater price volatility in the event of institutional buying or selling. BOFI was highlighted in yellow with pivot point cited based on its 3/23/15 high plus 10 cents in the 6/10/15 mid-day report (read here) while noted - "It clinched a technical buy signal with a gain backed by +55% above average volume on the prior session."
The number of top-rated funds owning share rose from 261 in Sep '14 to 279 in Jun '15. However, the current Up/Down Volume Ratio of 0.9 is an unbiased indication its shares have been under distributional pressure (I criteria) over the past 50 days.
Hovering Near Highs Very Extended From Sound Base - Thursday, August 20, 2015
B O F I Holding Inc (BOFI -$2.59 or -1.98% to $128.40) is stubbornly holding its ground near its all-time high following gains marked by above average volume. Disciplined investors avoid chasing stocks more than +5% above their prior high or pivot point. It was previously noted with caution - "It may produce more climactic gains, however it is very extended from its prior base. Its recent low ($111.43 on 7/29/15) defines near term support above its 50 DMA line."
It rallied further into new high territory (N criteria) with no resistance remaining due to overhead supply after last shown in this FSU section on 7/27/15 with an annotated graph under the headline, "Extended and Perched Near High With Earnings News Due Soon". It reported Jun '15 quarterly earnings +41% on +42% sales revenues, above the +25% minimum earnings guideline (C criteria) again. Earnings rose by +35%, +40%, +41%, +38%, and +35% in the Mar, Jun, Sep, Dec '14, and Mar '15 quarters, respectively, versus the year ago periods. Sales revenues were up +21%, +24%, +39%, +41%, and +41% during that span. Following a downturn in its FY '11 earnings its annual earnings (A criteria) history has been strong.
Leadership from other Finance - Savings & Loan issues has been reassuring concerning the L criteria. It has earned a Timeliness rating of A, and a Sponsorship rating of B. Keep in mind that its small supply of only 13.4 million shares (S criteria) in the public float can contribute to greater price volatility in the event of institutional buying or selling. BOFI was highlighted in yellow with pivot point cited based on its 3/23/15 high plus 10 cents in the 6/10/15 mid-day report (read here) while noted - "It clinched a technical buy signal with a gain backed by +55% above average volume on the prior session."
The current Up/Down Volume Ratio of 1.6 is an unbiased indication its shares have been under accumulation (I criteria) over the past 50 days. The number of top-rated funds owning share rose from 261 in Sep '14 to 275 in Jun '15.
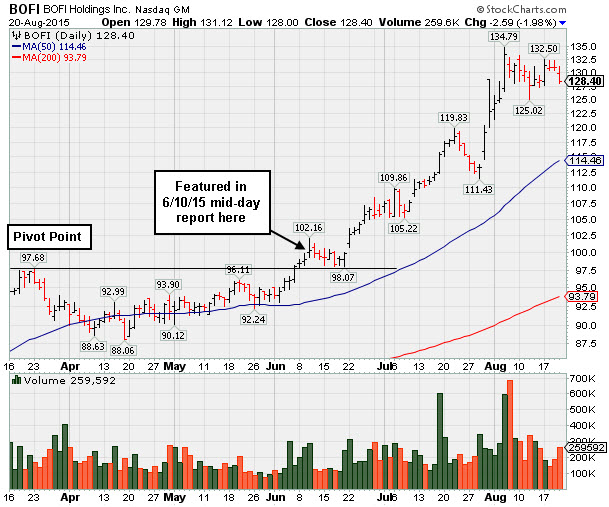
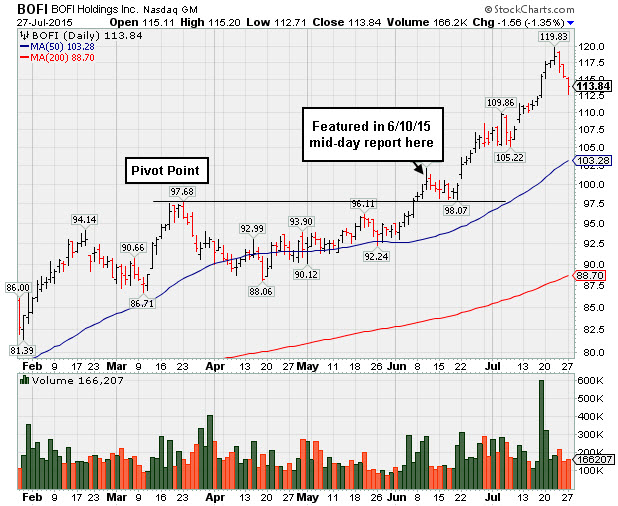
Extended and Perched Near High With Earnings News Due Soon - Monday, July 27, 2015
B O F I Holding Inc (BOFI -$1.56 or -1.35% $113.84) is very extended from its prior base. Its 50-day moving average (DMA) line ($103.28) defines important support to watch on pullbacks. After last shown in this FSU section on 7/10/15 with an annotated graph under the headline, "Hitting New Highs and Getting More Extended From a Sound Base", it rallied even further into new high territory (N criteria), with no resistance remaining due to overhead supply. Disciplined investors avoid chasing stocks more than +5% above their prior high or pivot point.
Leadership from other Finance - Savings & Loan issues is reassuring concerning the L criteria. It has earned a Timeliness rating of A, and a Sponsorship rating of B. Keep in mind that its small supply of only 13.4 million shares (S criteria) in the public float can contribute to greater price volatility in the event of institutional buying or selling. BOFI was highlighted in yellow with pivot point cited based on its 3/23/15 high plus 10 cents in the 6/10/15 mid-day report (read
here) while noted - "It clinched a technical buy signal with a gain backed by +55% above average volume on the prior session."
Keep in mind that it is due to report its Jun '15 quarterly earnings on 7/30/15, and volume and volatility often increase near earnings news. Through Mar '15 its quarterly comparisons have been above the +25% minimum earnings guideline (C criteria). Earnings rose by +35%, +40%, +41%, +38%, and +35% in the Mar, Jun, Sep, Dec '14, and Mar '15 quarters, respectively, versus the year ago periods. Sales revenues were up +21%, +24%, +39%, +41%, and +41% during that span. Following a downturn in its FY '11 earnings its annual earnings (A criteria) history has been strong.
The current Up/Down Volume Ratio of 1.9 is an unbiased indication its shares have been under accumulation (I criteria) over the past 50 days. The number of top-rated funds owning share rose from 261 in Sep '14 to 282 in Jun '15.
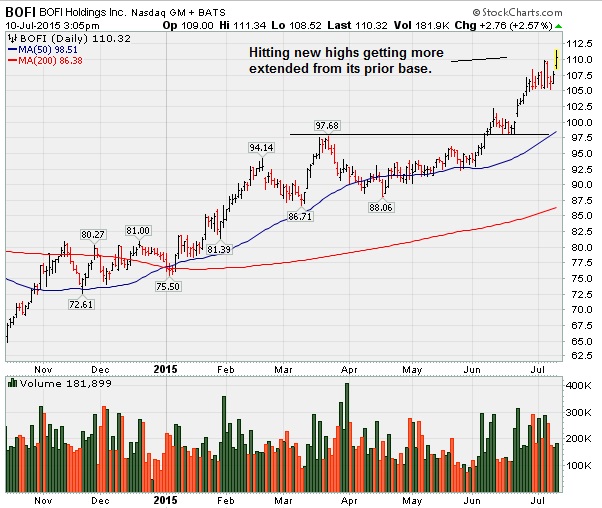
Hitting New Highs and Getting More Extended From a Sound Base - Friday, July 10, 2015
B O F I Holding Inc (BOFI) hit another new high today, getting more extended from its prior base. Prior highs near $97 define important support to watch on pullbacks. It was last shown in this FSU section on 6/10/15 with an annotated graph under the headline, "Small Saving & Loan Shows More Signs of Accumulation", hitting new 52-week and all-time highs (N criteria), rallying with no resistance remaining due to overhead supply. It was highlighted in yellow with pivot point cited based on its 3/23/15 high plus 10 cents in the earlier mid-day report (read here) while noted - "It clinched a technical buy signal with a gain backed by +55% above average volume on the prior session."
Quarterly comparisons have been above the +25% minimum earnings guideline (C criteria). Earnings rose by +35%, +40%, +41%, +38%, and +35% in the Mar, Jun, Sep, Dec '14, and Mar '15 quarters, respectively, versus the year ago periods. Sales revenues were up +21%, +24%, +39%, +41%, and +41% during that span. Following a downturn in its FY '11 earnings its annual earnings (A criteria) history has been strong.
Leadership from other Finance - Savings & Loan issues is reassuring concerning the L criteria. It has earned a Timeliness rating of A, and a Sponsorship rating of B. Keep in mind that its small supply of only 13.4 million shares (S criteria) in the public float can contribute to greater price volatility in the event of institutional buying or selling.
The current Up/Down Volume Ratio of 1.5 is an unbiased indication its shares have been under accumulation (I criteria) over the past 50 days. The number of top-rated funds owning share rose from 264 in Jun '14 to 278 in Jun '15.
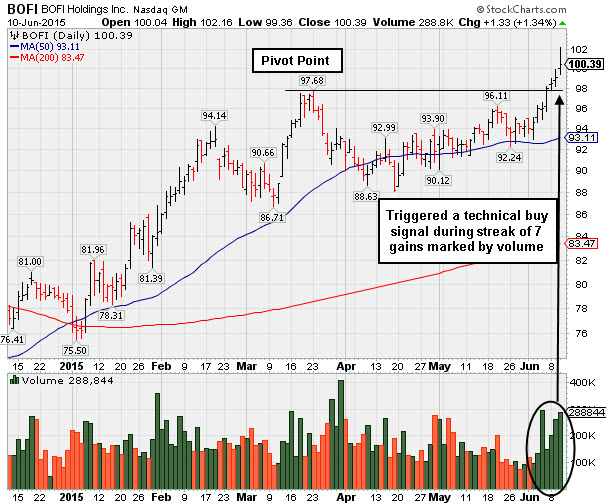
Small Saving & Loan Shows More Signs of Accumulation - Wednesday, June 10, 2015
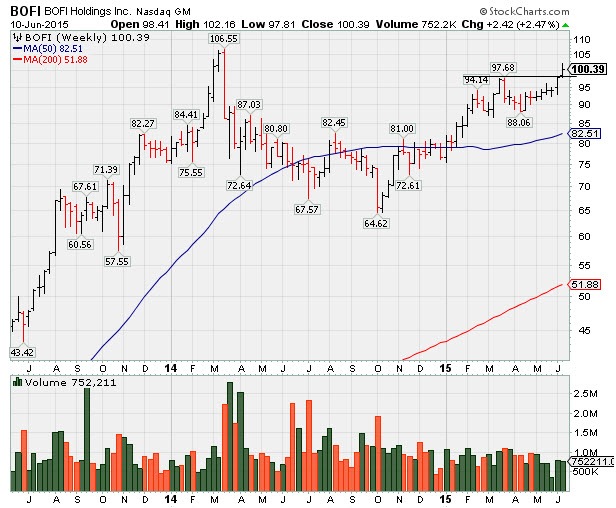
B O F I Holding Inc (BOFI +$1.33 or + 1.34% to $100.39) hit new 52-week and all-time highs (N criteria) with today's 7th consecutive gain, rallying with no resistance remaining due to overhead supply. It was highlighted in yellow with pivot point cited based on its 3/23/15 high plus 10 cents in the earlier mid-day report (read here) while noted - "It clinched a technical buy signal with a gain backed by +55% above average volume on the prior session." The weekly graph below shows that some overhead supply remains up through the $106 level. Subsequent gains into new all-time high territory could signal the beginning of another substantial leg up.
Quarterly comparisons have been above the +25% minimum earnings guideline (C criteria). Earnings rose by +35%, +40%, +41%, +38%, and +35% in the Mar, Jun, Sep, Dec '14, and Mar '15 quarters, respectively, versus the year ago periods. Sales revenues were up +21%, +24%, +39%, +41%, and +41% during that span. Following a downturn in its FY '11 earnings its annual earnings (A criteria) history has been strong.
Leadership from other Finance - Savings & Loan issues is reassuring concerning the L criteria. It has earned a Timeliness rating of A, and a Sponsorship rating of B. Keep in mind that its small supply of only 13.4 million shares (S criteria) in the public float can contribute to greater price volatility in the event of institutional buying or selling.
The current Up/Down Volume Ratio of 1.4 is an unbiased indication its shares have been under accumulation (I criteria) over the past 50 days. The number of top-rated funds owning share rose from 264 in Jun '14 to 269 in Mar '15.