After damaging technical action, stocks are noted and dropped from the Featured Stocks list. Watchful investors following this fact-based system have likely seen more than one warning sign noted to alert them to avoid or reduce exposure by the time a stock is dropped from the list. Learn lessons from these examples! Follow proper buying and selling rules to reduce risk so, in the long run, you can best increase your chances of getting the "above average" returns which are ultimately desired. Losses are a reality, and all investors must learn how to minimize them. A good way to avoid losses starts by not making "early" purchases. Undisciplined and inexperienced investors jump before a confirmed technical buy signal, or they may load up heavily instead of pyramiding their buys.
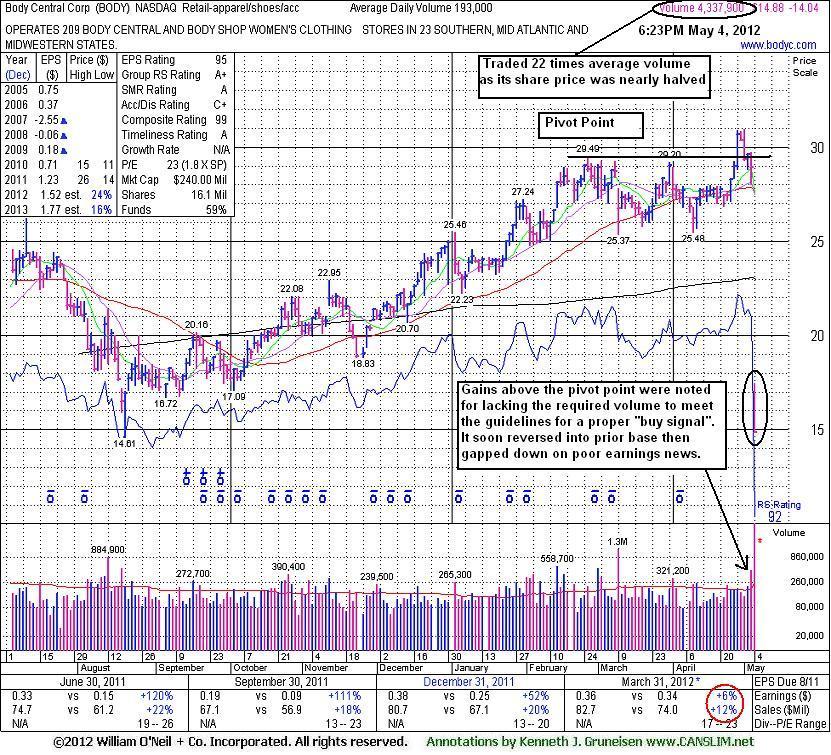
Body Central Corp (BODY -$14.04 or -48.55% to $14.88) gapped down badly today and its shares were halved. Based on the damaging technical action it will be dropped from the Featured Stocks list tonight. It reported earnings +6% on +22% sales revenues for the quarter ended March 31, 2012 versus the year ago period, below the +25% minimum guideline, disappointing investors. That was well below the +25% minimum earnings guideline for buy candidates. Its huge gap down violated its 50 DMA and 200 DMA lines. This poor technical action very vividly demonstrates that fundamental (earnings) news can have a direct and immediate impact on any company's share price.
BODY's shares had slumped below its 50 DMA line one additional time and then they rebounded with lackluster volume behind subsequent gains since its last appearance in this FSU section on 3/13/12 with an annotated graph under the headline, "Found Support at 50-Day Moving Average Line". Ownership by top-rated funds had risen from 100 in Mar '11 to 209 in Mar '12, a reassuring trend concerning the I criteria. But when a stock falls nearly 50% with 22 times average volume in one day it is very obvious that institutional investors fought their way to the exits.
The Market Commentary has clearly reminded readers - investors should always be disciplined and watch for a proper technical buy signal to be confirmed before taking any action, then steadfastly protect capital by selling whenever any stock falls more than -7% from the purchase price.
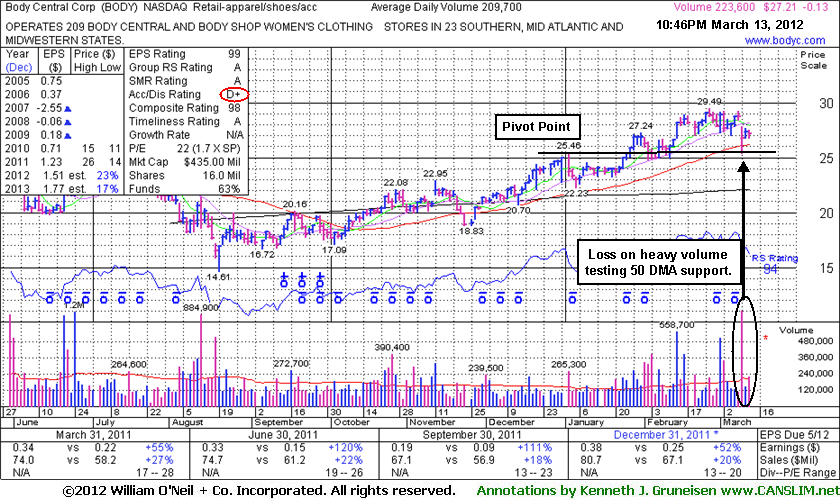
Body Central Corp's (BODY -$0.13 or -0.48% to $27.21) reported earnings +52% on +20% sales revenues for the quarter ended December 31, 2011 versus the year ago period. It found prompt support near its 50-day moving average (DMA) line and prior highs in the $26 area after a damaging 3/09/11 gap down and considerable volume-driven loss violated the previously noted upward trendline connecting its Nov-Feb lows (not shown). Additional damaging losses may raise concerns and trigger a technical sell signal if the 50 DMA is violated. Meanwhile it may eventually form a new base, but for now it is too extended from its last base to be considered buyable under the fact-based system's guidelines.
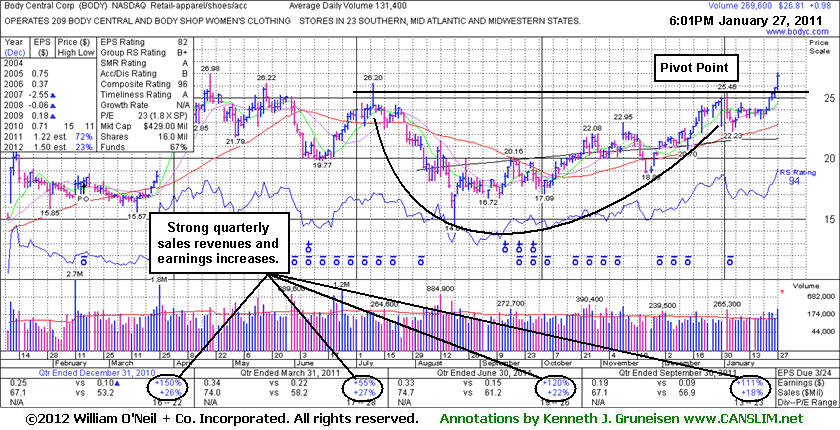
Its last appearance in this FSU section was on 1/27/12 with an annotated graph under the headline, "Breakout Backed With Twice Average Volume", as its 5th consecutive gain helped it hit a new 52-week high while rallying from a cup-with-handle type base pattern. It was featured in yellow in the earlier mid-day report (read here) with pivot point based on its 1/03/12 high. Disciplined investors avoid chasing stocks that get too extended and they always limit losses at 7% if a stock falls that much from their purchase price.
Ownership by top-rated funds rose from 100 in Mar '11 to 184 in Dec '11, a reassuring sign concerning the I criteria. Company management owns a 24% stake keeping them motivated to build and maintain shareholder value.
Body Central Corp's (BODY +$1.13 or +4.36% to $26.96) volume was 2 times average today as its 5th consecutive gain helped it hit a new 52-week high while rallying from a cup-with-handle type base pattern. It was featured in yellow in the earlier mid-day report (read here) with pivot point based on its 1/03/12 high. It is clear of all resistance due to overhead supply and may quickly get extended from its base. On pullbacks the prior highs in the $25-26 area define initial support to watch above its 50-day moving average (DMA) line. Disciplined investors avoid chasing stocks that get too extended and they always limit losses at 7% if a stock falls that much from their purchase price.
Quarterly sames revenues and earnings increases have been strong through Sep '11, satisfying the C criteria. The old 52-week high was hit when noted in the 4/20/11 mid-day report as it reversed into the red - "Held its ground and continued rising after a considerable "breakaway gap" on 3/25/11. It completed an additional Public Offering on 2/16/11 and found support near prior chart highs following a slump below its 50 DMA line in the interim since noted in the 1/13/11 mid-day report. Limited history is a concern, and it is up considerably since its $13 IPO on 10/15/10."
Ownership by top-rated funds rose from 100 in Mar '11 to 174 in Dec '11, a reassuring sign concerning the I criteria. Company management owns a 24% stake keeping them motivated to build and maintain shareholder value.