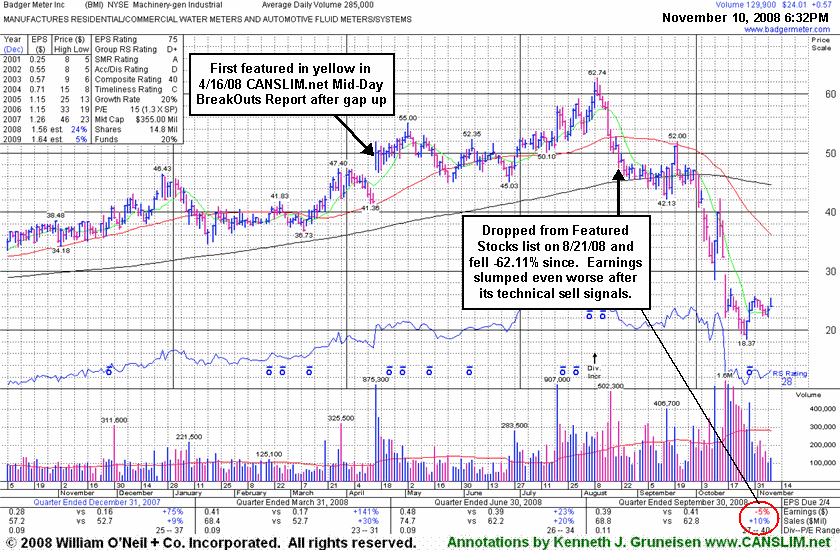
Fundamentals Faltered Following Technical Trouble - Monday, November 10, 2008
Badger Meter Inc. (BMI +$0.57 or +2.43% to $24.01) is not a currently featured stock, however it may be worth another look for any important lessons that can be learned from a previous market leader that has experienced a technical breakdown and fundamental disappointment. In this case, the stock's technical breakdown was followed with fundamental deterioration.
This stock was first featured in yellow at $47.70 on Wednesday, April 16, 2008 in the CANSLIM.net Mid Day Breakouts Report (read here). Shortly after that appearance, on 4/23/08, its recent gap up was shown on an annotated graph under the headline "Good Acceleration in Earnings and Sales Growth" in this Featured Stock Update section (read here). Later, a considerable 7/21/08 gain on heavy volume helped it break out again from an orderly base-on-base type pattern after reporting better than expected earnings and sales increases in the latest quarter ended June 30, 2008. However, the actual improvement in earnings and sales versus the year ago period was under the +25% guideline, leaving concerns about the fundamentals which were specifically noted in the 7/29/08 Featured Stock Update section (read here).
After triggering a technical sell signal by violating its 50 DMA line on 8/18/08, the Featured Stock Update table (below this section's detailed stock write-up) on 8/21/08 explained that BMI was being dropped - "Based on weak technical action and previously noted concerns about the fundamentals. In a manner quite similar to SNHY (illustrated in the August "Investing for the New Millennium" article - read here), this stock encountered distributional pressure near the upper limit of a trading channel identified by connecting prior chart highs from July, Dec '07 and May '08".
BMI was dropped from the Featured Stocks list based on its technical weakness and an earnings report that showed less than a +25% increase in quarterly earnings per share for the period ended June 30, 2008. It had closed the session on 8/21/08 at $48.49, and has since fallen -62.11% while trading as low as $18.37. Today investors can see even more fundamental evidence that explains the stock's prior technical breakdown. The quarter ended September 30, 2008 showed earnings falling short of the year-ago period! Disciplined investors locked in profits and/or avoided large losses, whereas the "buy and hold" types who refused to sell might be really upside down right now while still hoping it will eventually get better. A lot can go wrong when waiting it out, and there are no guarantees the stock will ever returns to its old highs. This exemplifies why having a sell discipline is so critical.
C A N S L I M | StockTalk | News | Chart | SEC | Zacks Reports | ![]()
![]()
![]()
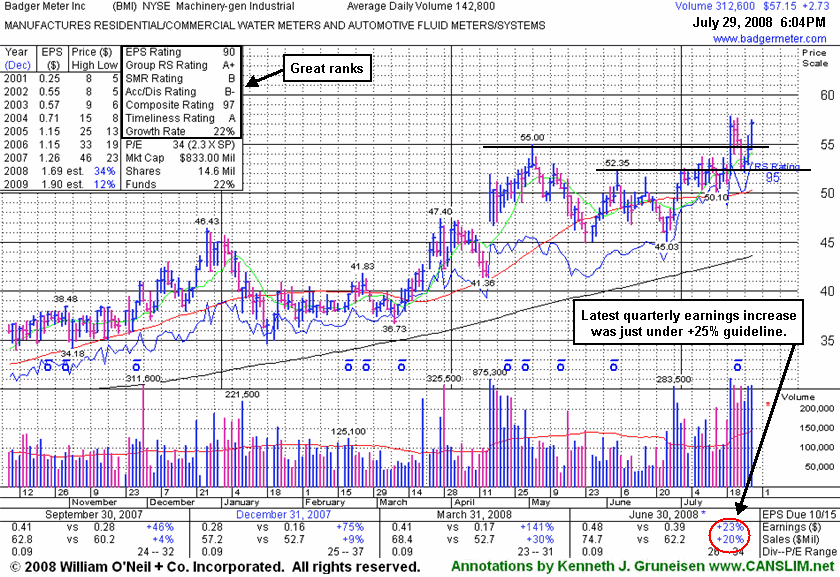
New High Close For High-Ranked Machinery Firm - Tuesday, July 29, 2008
Healthy stocks that are within close striking distance of new highs are often great buy candidates for investors to keep on their watch lists, especially when the companies match favorably with all of the investment system's criteria. When a stock is more than -10% off its 52-week high, and if it has violated its 50-day moving average (DMA) line, then the outlook only gets worse and worse as it spends a greater period of time trading deeper under that important short-term average line. By the time a stock's 50 DMA line starts sloping downward it should also be acknowledged that the stock has been struggling for a long while, in which case it might be time to reduce exposure and look for places to put that money to work in stronger buy candidates.Badger Meter Inc. (BMI +$2.73 or +5.02% to $57.15) enjoyed a new all-time high close after a third consecutive gain on above average volume. It recently bounced near prior chart highs in the $54-55 area which are now acting as support. A considerable 7/21/08 gain on heavy volume helped it break out from an orderly base-on-base type pattern after reporting better than expected earnings and sales increases in the latest quarter ended June 30, 2008. However, the actual improvement in earnings and sales versus the year ago period was under the +25% guideline, leaving concerns about the fundamentals. It was highlighted in a 6/05/08 newspaper article (read here). BMI sports strong ranks; an Earnings Per Share (EPS) rating of 90, and a Relative Strength (RS) rating of 95. Its Return on Equity stands at a respectable +22%, which is above the +17% guideline. The number of top-rated funds owning an interest rose from 35 in Sep '07 to 52 in Jun '08, which shows increasing institutional demand (the I criteria).
This stock was first featured on Wednesday, April 16, 2008 in the CANSLIM.net Mid Day Breakouts Report (read here) with a $47.50 pivot point and a $49.88 maximum buy price. Always limit losses per the 7-8% sell rule, and never hold a stock if it falls more than that from your purchase price.
C A N S L I M | StockTalk | News | Chart | SEC | Zacks Reports | ![]()
![]()
![]()
View all notes | Alert me of new notes | CANSLIM.net Company Profile
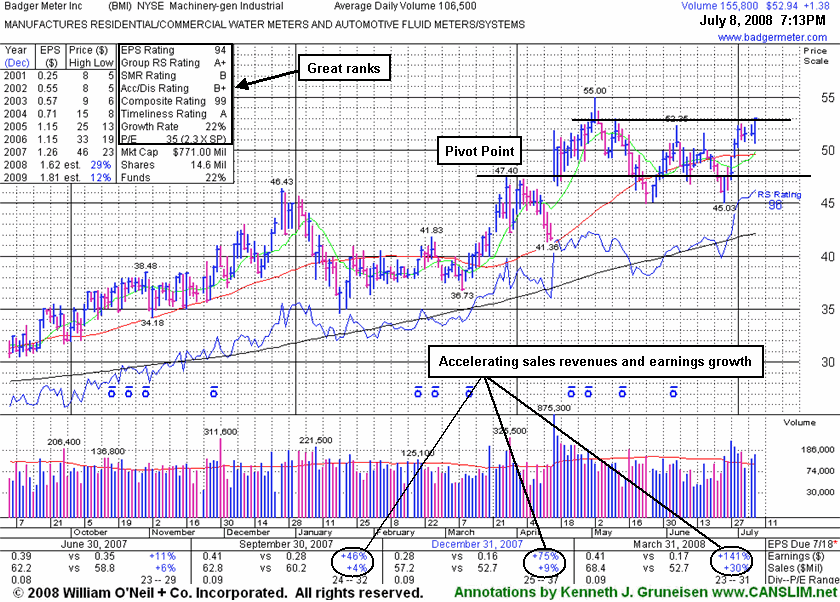
New High Close For High-Ranked Machinery Firm - Tuesday, July 08, 2008
Badger Meter Inc. (BMI +$1.38 or +2.68% to $52.94) ended at a new high close with a second consecutive gain on above average volume. The company has shown accelerating sales revenues and earnings growth in recent quarterly comparisons verus the year earlier and it sports strong ranks; an Earnings Per Share (EPS) rating of 94, and a Relative Strength (RS) rating of 96. The number of top-rated funds owning an interest rose from 35 in Sep '07 to 51 in Jun '08, which shows increasing institutional demand (the I criteria). This stock was first featured on Wednesday, April 16, 2008 in the CANSLIM.net Mid Day Breakouts Report (read here) with a $47.50 pivot point and a $49.88 maximum buy price and the following note as it was triggering a technical buy signal: "Y - It gapped up and hit a new all-time high after reporting strong sales and earnings increases in the latest quarter ended Mar 31, 2008, however prior sales revenues growth has been lackluster. It is breaking out of a cup-with-handle type pattern, but it has pulled back from earlier highs. A weak close, or any subsequent close under its prior high close ($46.73 on 4/02/08) would raise concerns." It has formed a base-on-base type pattern and is trading near the high end of its current base with little resistance remaining due to overhead supply. BMI should remain on an active watch list until a follow through day from at least one of the major market averages helps confirm a new rally attempt. Always limit losses per the 7-8% sell rule, and never hold a stock if it falls more than that from your purchase price.
C A N S L I M | StockTalk | News | Chart | SEC | Zacks Reports | ![]()
![]()
![]()
View all notes | Alert me of new notes | CANSLIM.net Company Profile
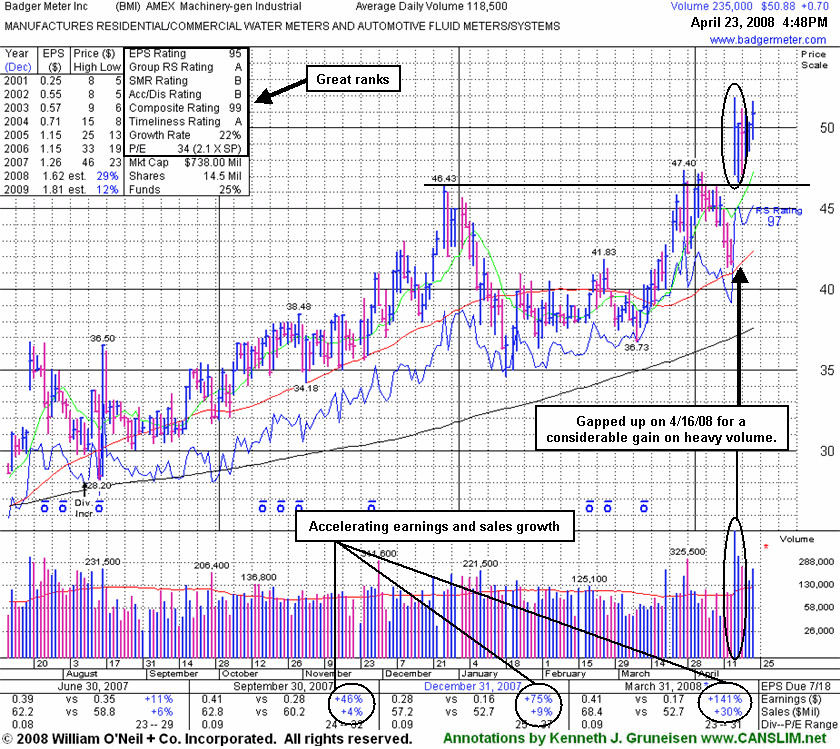
Good Acceleration in Earnings and Sales Growth - Wednesday, April 23, 2008
A classic example of the success enjoyed by many CANSLIM.net readers usually starts when an investor reads a CANSLIM.net report and buys a featured stock before it has risen above the pivot point by greater than 5%. After a stock breaks out above its pivot point, there is only a +5% window that investors have to purchase the stock under the proper guidelines. Once a stock rises above the "maximum buy price" the risk of a shake out balloons, meaning that even a normal retracement in the stock might force you to employ the 7-8% loss cutting rule. Much can be told by the stock's daily action in the weeks and months that follow a breakout. Typically, a light volume and orderly pullback suggests that the bulls remain in control. However, high volume pullbacks that violate support paint a totally different picture.
Badger Meter Inc. (BMI +$0.70 or +1.39% to $50.88) enjoyed a new high close today after another gain on above average volume. Its color code was changed to green as it rose further above its max buy level. BMI sports strong ranks; an Earnings Per Share (EPS) rating of 95, and a Relative Strength (RS) rating of 97. The number of top-rated funds owning an interest rose from 27 in Jun '07 to 50 in Mar '08, which shows increasing institutional demand (the I criteria). Concerns would be raised by any weakness leading to a close under its old chart highs near $47 which would have the effect of technically negating its latest breakout.
This stock was first featured on Wednesday, April 16, 2008 in the CANSLIM.net Mid Day Breakouts Report (read here) with a $47.50 pivot point and a $49.88 maximum buy price and the following note as it was triggering a technical buy signal: "Y - It gapped up and hit a new all-time high after reporting strong sales and earnings increases in the latest quarter ended Mar 31, 2008, however prior sales revenues growth has been lackluster. It is breaking out of a cup-with-handle type pattern, but it has pulled back from earlier highs. A weak close, or any subsequent close under its prior high close ($46.73 on 4/02/08) would raise concerns." Always limit losses per the 7-8% sell rule, and never hold a stock if it falls more than that from your purchase price.
C A N S L I M | StockTalk | News | Chart | SEC | Zacks Reports | ![]()
![]()
![]()
View all notes | Alert me of new notes | CANSLIM.net Company Profile