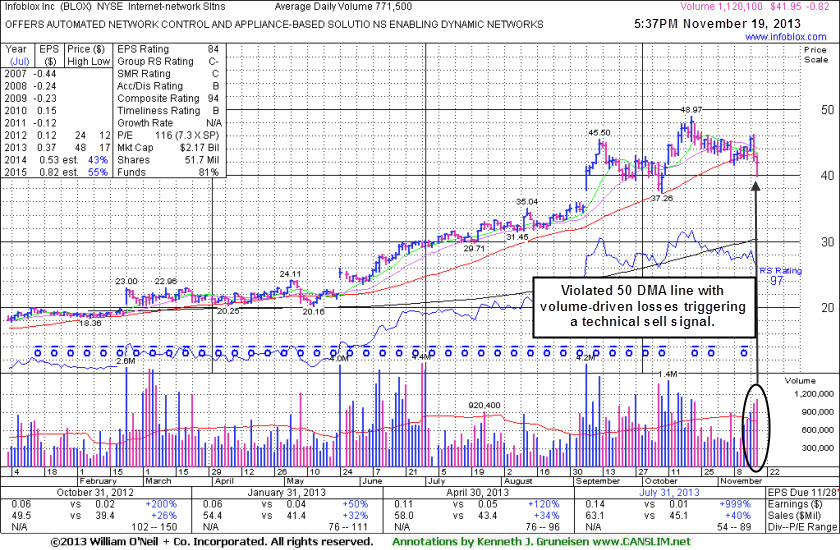
Volume-driven gains had triggered a technical buy signal after BLOX was last shown in this FSU session on 10/11/13 with annotated graphs under the headline, "Finished Another Week Higher With Volume Behind Gains", however it made limited progress above its prior high in the $45.50 area before it stalled. Its color code was changed to green based on its noted technical deterioration as it has slumped back into the prior base pattern. Only a prompt rebound above its 50 DMA line might help its outlook improve, as it would indicate support coming from the institutional crowd near that always-important level for chart readers.
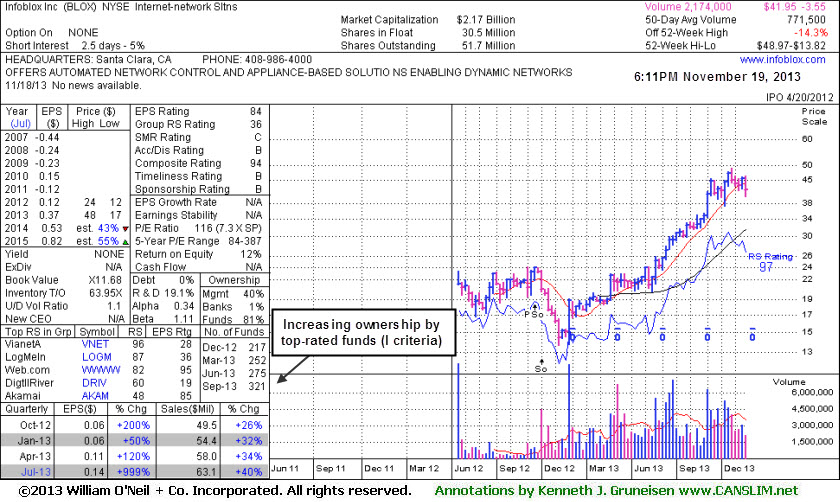
It will release its fiscal first quarter 2014 financial results for the period ending on October 31, 2013 on Tuesday, November 26, 2013 after the financial markets close. Often times, fresh earnings reports help to explain the technical action that a stock has recently been showing. It will be important to watch for the increased volume and volatility that often occurs near earnings news. Strong sales revenues and solid earnings increases in the Oct '12, Jan, Apr, and Jul '13 quarterly comparisons versus the year ago periods satisfied the C criteria. Its up and down annual earnings (A criteria) prior to its 2012 IPO was noted as a concern. Since completing a Secondary Offering on 10/04/12 it followed with choppy action and then an impressive rebound and rally. The number of top-rated funds owning its shares rose from 218 in Dec '12 to 321 in Sep '13, a reassuring trend concerning the I criteria.
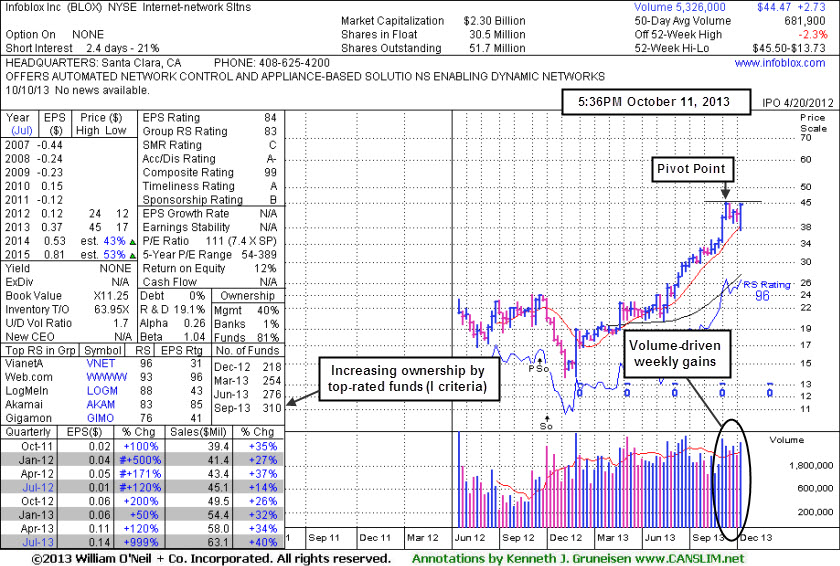
It found support while consolidating in an orderly fashion above its 50-day moving average (DMA) line recently. Strong sales revenues and solid earnings increases in the Oct '12, Jan, Apr, and Jul '13 quarterly comparisons versus the year ago periods satisfy the C criteria. Its up and down annual earnings (A criteria) prior to its 2012 IPO was noted as a concern. Since completing a Secondary Offering on 10/04/12 it followed with choppy action and then an impressive rebound and rally. No overhead supply remains to act as resistance, so it may produce more climactic gains.
Although the market's uptrend has recently been under pressure (see the Market Commentary section today for more) it may be considered reasonable now for disciplined investors to make new buying efforts in companies meeting all key criteria. As always, a proper technical buy signal should first confirm that a stock is attracting fresh institutional buying demand. Sell any stock that falls more than -7% from your purchase price, because Rule #1 is to protect yourself from suffering large losses. The number of top-rated funds owning its shares rose from 218 in Dec '12 to 310 in Sep '13, a reassuring trend concerning the I criteria.