Recently Undercut Prior High and 50-Day Moving Average - Wednesday, December 8, 2021

Recently Undercut Prior High and 50-Day Moving Average - Wednesday, December 8, 2021

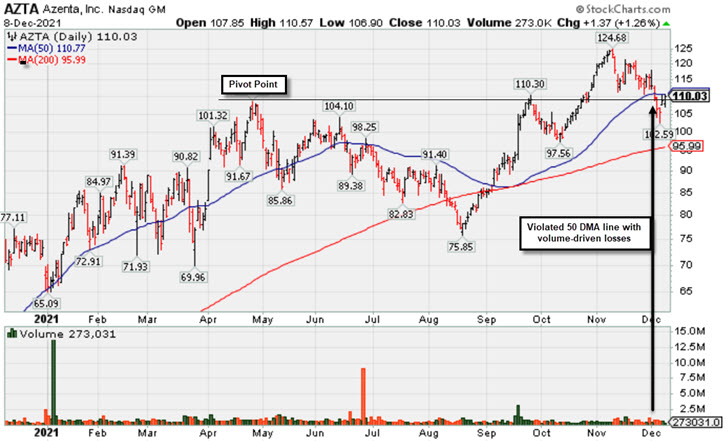
Azenta Inc. (AZTA +$1.37 or +1.26% to $110.03) rebounded near its 50-day moving average (DMA) line ($110.86) with today's gain on lighter volume. Recent volume-driven losses triggered technical sell signals. A prompt rebound above the 50 DMA line would help its outlook improve.  Formerly was Brooks Automation Inc., (BRKS). The company had said on Nov. 16 that it was changing its name to Azenta, following the launch of the Azenta Life Sciences brand, and after announcing in September that it was selling its semiconductor automation business to Thomas H. Lee Partners. 

It reported Sep 21 quarterly earnings +33% on +27% sales revenues versus the year ago period. Its current Earnings Per Share Rating has slumped to 56, well below the 80+ minimum for buy candidates under the fact-based investment system's fundamental guidelines. That rating seems low considering that its past 9 consecutive quarterly comparison above the +25% minimum earnings guideline (C criteria). Annual earnings history (A criteria) included a downturn in FY '18. 

BRKS was highlighted in yellow in the 9/20/21 mid-day report with pivot point cited based on its 4/27/21 high plus 10 cents. It was last shown in this FSU section on 11/24/21 with an annotated graph under the headline, "Consolidating Still Well Above Prior High and 50 DMA Line". 

The Electronics - Semiconductor Equipment group is ranked 41st on the 197 Industry Groups list (L criteria). The number of top-rated funds that own AZTA shares has risen from 497 in Dec '20 to 627 in Sep '21, a reassuring sign concerning the I criteria. Its current Up/Down Volume Ratio of 0.9 is an unbiased indication its shares have been under slight distributional pressure over the past 50 days. It has a Timeliness rating of B and Sponsorship Rating of B. Its small supply of 74.3 million shares outstanding (S criteria) can contribute to greater price volatility in the event of institutional buying or selling. 

Charts courtesy of www.stockcharts.com