It reported earnings +61% on +31% sales revenues for the quarter ended September 30, 2012 versus the year ago period. Earnings increases have been above the +25% guideline, satisfying the C criteria, and backed by solid sales revenues increases in the 5 latest quarterly comparisons. This Luxembourg-based Financial Services firm's small supply (S criteria) of only 15.4 million shares in the public float can contribute to greater volatility in the event of institutional buying or selling. The number of top-rated funds owning its shares rose from 108 in Sep '11 to 160 in Sep '12, a reassuring sign concerning the I criteria.
It was last shown in this FSU section while consolidating -5.1% from its all-time high on 9/11/12 with an annotated graph under the headline, "Brief Consolidation May Soon Be Noted as a Sound New Base". It had been repeatedly noted - "Extended from its prior base, and its 50 DMA line defines near-term support to watch." On 9/24/2012 its color code was changed to yellow with new pivot point cited based on its 8/20/12 high plus 10 cents. On 10/03/12 its volume-driven gain above its pivot point triggered a new (or add-on) technical buy signal and it quickly got extended beyond its "max buy" level.
It reported earnings +117% on +55% sales revenues for the quarter ended June 30, 2012 versus the year ago period. Earnings increases have been above the +25% guideline, satisfying the C criteria, and backed by solid sales revenues increases in the 4 latest quarterly comparisons. It is due to report earnings for the Sep '12 quarter on the morning of Thursday, 25 October 2012. This Luxembourg-based Financial Services firm's small supply (S criteria) of only 15.4 million shares in the public float can contribute to greater volatility in the event of institutional buying or selling. The number of top-rated funds owning its shares rose from 108 in Sep '11 to 158 in Sep '12, a reassuring sign concerning the I criteria. Its current Up/Down Volume Ratio of 1.7 is an unbiased indication its shares have been under accumulation over the past 50 days. Disciplined investors always avoid chasing extended stocks, and they limit losses by selling if ever any stock falls more than -7% from their purchase price.
Altisource Portfolio Solutions Sa (ASPS +$0.27 or +0.31% to $87.55) is consolidating -5.1% from its all-time high. It has been repeatedly noted - "Extended from its prior base, and its 50 DMA line defines near-term support to watch." Its current consolidation is still too short to be considered a new base pattern, however it may be forming a square box type base. In the days ahead a new pivot point may be cited based on its 52-week high hit on 8/20/12, and subsequent volume-driven gains above that level may trigger a new (or add-on) technical buy signal.
Since last shown in this FSU section on 8/03/12 with an annotated graph under the headline, "New High Close Leaves Leader Extended From Sound Base", it went on to rally further into new high territory. Then, after enduring some distributional pressure, it leveled out and has traded in a fairly tight trading range while staying well above its 50-day moving average (DMA) line.
It reported earnings +117% on +55% sales revenues for the quarter ended June 30, 2012 versus the year ago period. Earnings increases have been above the +25% guideline, satisfying the C criteria, and backed by solid sales revenues increases in the 4 latest quarterly comparisons. This Luxembourg-based Financial Services firm's small supply (S criteria) of only 15.4 million shares in the public float can contribute to greater volatility in the event of institutional buying or selling. The number of top-rated funds owning its shares rose from 108 in Sep '11 to 155 in Jun '12., a reassuring sign concerning the I criteria. Its current Up/Down Volume Ratio of 1.3 is an unbiased indication its shares have been under accumulation over the past 50 days. Disciplined investors always avoid chasing extended stocks, and they limit losses by selling if ever any stock falls more than -7% from their purchase price.
Altisource Portfolio Solutions Sa (ASPS +$0.51 or +0.65% to $78.40) finished at a new high close. It has been recently noted while holding its ground at its 52-week high, extended from its prior "double bottom" base. Its 50-day moving average (DMA) line defines near-term support to watch.
Since last shown in this FSU section on 7/03/12 with an annotated graph under the headline, "Extended From Prior Base, Stubbornly Holding its Ground", it reported earnings +117% on +55% sales revenues for the quarter ended June 30, 2012 versus the year ago period. Earnings increases have been above the +25% guideline, satisfying the C criteria, and backed by solid sales revenues increases in the 4 latest quarterly comparisons. This Luxembourg-based Financial Services firm's small supply (S criteria) of only 15.4 million shares in the public float can contribute to greater volatility in the event of institutional buying or selling. The number of top-rated funds owning its shares rose from 108 in Sep '11 to 151 in Jun '12., a reassuring sign concerning the I criteria. Its current Up/Down Volume Ratio of 1.7 is an unbiased indication its shares have been under accumulation over the past 50 days. Disciplined investors always avoid chasing extended stocks, and they limit losses by selling if ever any stock falls more than -7% from their purchase price.
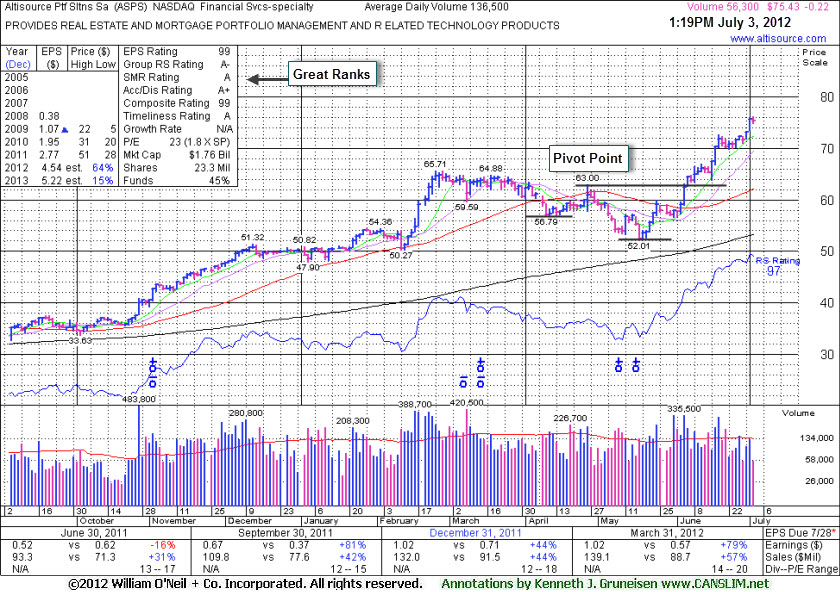
Altisource Portfolio Solutions Sa (ASPS -$0.22 or -0.29% to $74.43) held its ground near its 52-week high today. It recently wedged higher into all-time high territory without great volume conviction behind its gains, getting extended from its prior base. Disciplined investors always avoid chasing extended stocks, and they limit losses by selling if ever any stock falls more than -7% from their purchase price.
Prior highs in the $65 area define initial support to watch on pullbacks, meanwhile it is extended from its prior base. It was last shown in this FSU section on 6/05/12 with an annotated graph under the headline, "Additional Confirmations Needed For High-Ranked Leader", after highlighted in yellow in that day's mid-day report (read here). It has hardly looked back since.
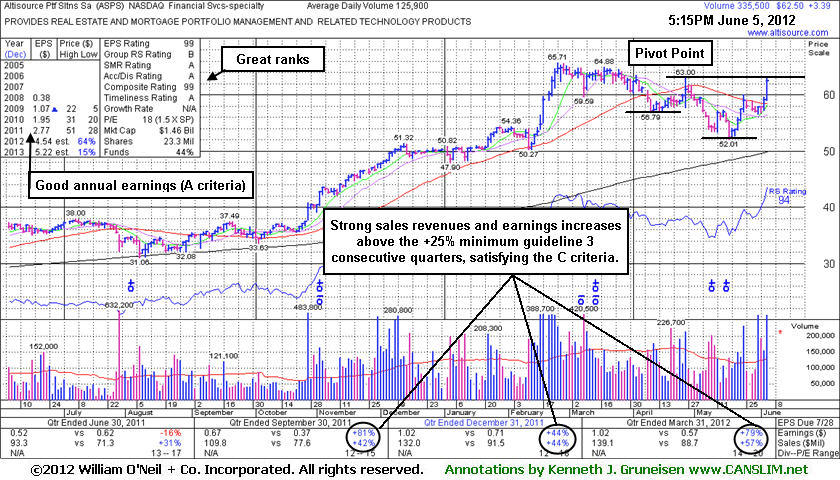
Earnings increases have been above the +25% guideline, satisfying the C criteria, and backed by solid sales revenues increases in the 3 latest quarterly comparisons through Mar '12. This Luxembourg-based Financial Services firm's small supply (S criteria) of only 15.4 million shares in the public float can contribute to greater volatility in the event of institutional buying or selling. The number of top-rated funds owning its shares rose from 100 in Jun '11 to 158 in Mar '12., a reassuring sign concerning the I criteria. Its current Up/Down Volume Ratio of 1.5 is an unbiased indication its shares have been under accumulation over the past 50 days.

Often, when a leading stock is setting up to breakout of a solid base it is highlighted in CANSLIM.net's Mid-Day Breakouts Report. The most relevant factors are noted in the report which alerts prudent CANSLIM oriented investors to place the issue in their watch list. After doing any necessary backup research, the investor is prepared to act after the stock triggers a technical buy signal (breaks above its pivot point on more than +50% average turnover) but before it gets too extended from a sound base. In the event the stock fails to trigger a technical buy signal and its price declines then it will simply be removed from the watch list. Disciplined investors know to buy as near as possible to the pivot point and avoid chasing stocks after they have rallied more than +5% above their pivot point. It is crucial to always limit losses whenever any stock heads the wrong direction, and disciplined investors sell if a struggling stock ever falls more than -7% from their purchase price.
Altisource Portfolio Solutions Sa (ASPS +$3.39 or +5.74% to $62.50) was highlighted in yellow again today in the mid-day report (read here). Its recent rebound from below its 50-day moving average (DMA) line helped its technical stance improve. Today's considerable gain was backed by more than 2 times average volume as it approached its pivot point. The pivot point cited is based upon its 4/26/12 high while it is currently working on a "double bottom" base 15-weeks in length. Subsequent volume-driven gains above the pivot point are needed to trigger a technical buy signal. Disciplined investors always watch for definitive proof of heavy institutional buying demand before taking any action. Many prior examples have proven the disadvantages of getting in "early", before a proper buy signal occurs. Keep in mind also that the major averages (M criteria) also need to confirm a new rally with a solid follow-through day before any new buying efforts are justified under the fact-based investment system.
Earnings increases have been above the +25% guideline, satisfying the C criteria, and backed by solid sales revenues increases in the 3 latest quarterly comparisons through Mar '12. This Luxembourg-based Financial Services firm's small supply (S criteria) of only 15.4 million shares in the public float can contribute to greater volatility in the event of institutional buying or selling. The number of top-rated funds owning its shares rose from 100 in Jun '11 to 154 in Mar '12., a reassuring sign concerning the I criteria.

In recent weeks an increasing number of leading stocks setting up and breaking of solid bases have been highlighted in the CANSLIM.net Mid-Day Breakouts Report. The most relevant factors are briefly noted in the report which allows disciplined investors to place the issue in their custom watch list and receive subsequent notes directly via email immediately when they are published (click the "Alert me of new notes" link). More detailed analysis is published soon after a stock's initial appearance in yellow once any new candidates are added to the Featured Stocks list. Letter-by-letter details concerning strengths or shortcomings of the company in respect to key fundamental criteria of the investment system appear along with annotated datagraphs highlighting technical chart patterns in the Featured Stock Update (FSU) section included in the CANSLIM.net After Market Update each day.
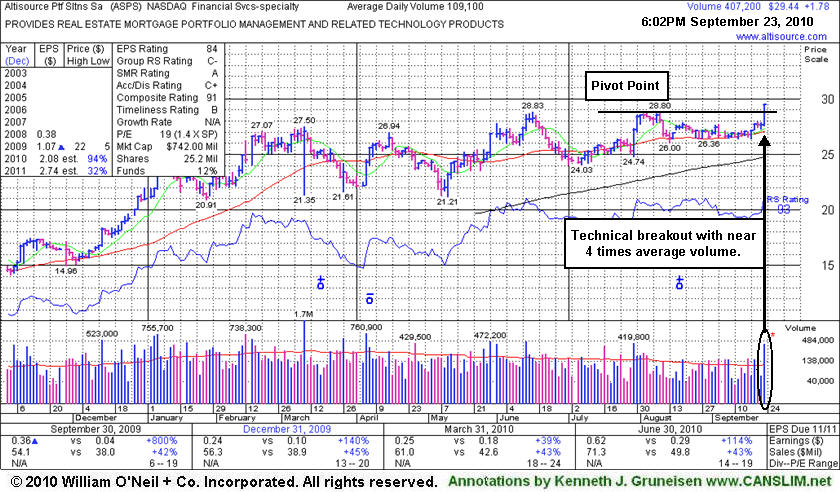
Altisource Ptf Sltns Sa (ASPS +$1.77 or +6.40% to $29.43) faces no overhead supply and it technically broke out today, triggering a buy signal with volume nearly 4 times its average daily volume as it rose above its pivot point. This Luxembourg-based Financial Services firm was highlighted in yellow in today's mid-day report (read here) with above average volume as it traded only -1.5% from its 52-week high while building on an orderly 9-week flat base above its 50 DMA line.
The C criteria is satisfied after recent quarterly comparisons had big sales and earnings increases versus the year ago period. However, its Sep '09 quarter and FY '09 earnings results have blue triangles beside the earnings figure on the graph service used by our experts indicating that pre-tax, non-recurring items were included (where possible, such items are normally removed to provide data better suited for comparison). The number of top-rated funds owning its shares fell from 47 in Sep '09 to 35 in Jun '10. It did not make significant progress since noted in February 2010 mid-day reports -"Annual earnings (A criteria) history has been up and down and needs additional review."
