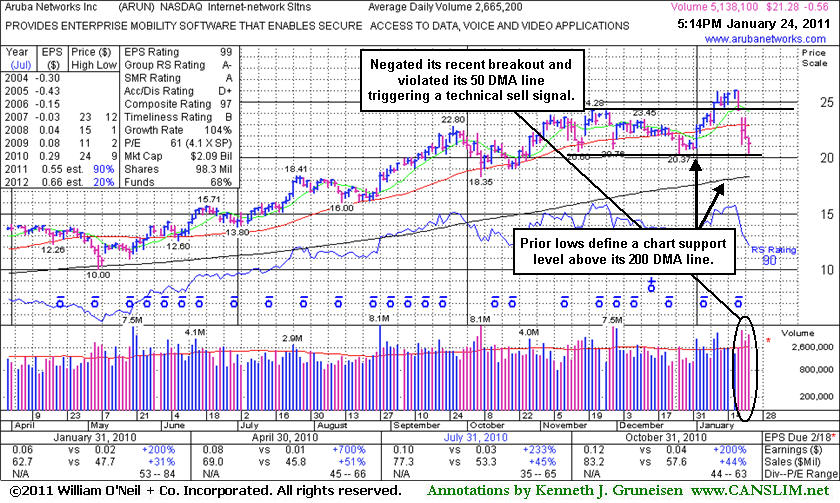
Aruba Networks Inc. (ARUN -$0.56 or -2.56% to $21.28) finished in the upper third of its intra-day range today after trading near previously noted lows defining chart support. After negating its latest breakout, and violating its 50-day moving average (DMA) line last week triggering a technical sell signal, subsequent damaging losses may raise more serious concerns. Its Accumulation/Distribution Rating has slumped to a D+. A rebound above its short-term average is needed for its outlook to improve. If any new (or add-on) buying was done after its recent breakout, disciplined investors may have already been prompted to sell based upon the investment system's rule of limiting losses whenever any stock falls more than -7% from the purchase price.
ARUN has slumped -18.2% off its 52-week high near recent chart lows in the $20 area, where further deterioration would raise greater concerns. Its 200 DMA line is the next chart important support level to watch. Since first featured at $12.71 in the February 22, 2010 mid-day report it has traded up as much as +104.5%. The number of top-rated funds owning an interest in its shares rose from 262 in Dec '09 to 403 in Dec '10, providing a nice reassurance with respect to the investment system's I criteria. Return On Equity reported at 21% is above the 17% guideline, an encouraging sign. Management's 24% ownership interest keeps the directors' focus on maintaining and growing shareholder value.
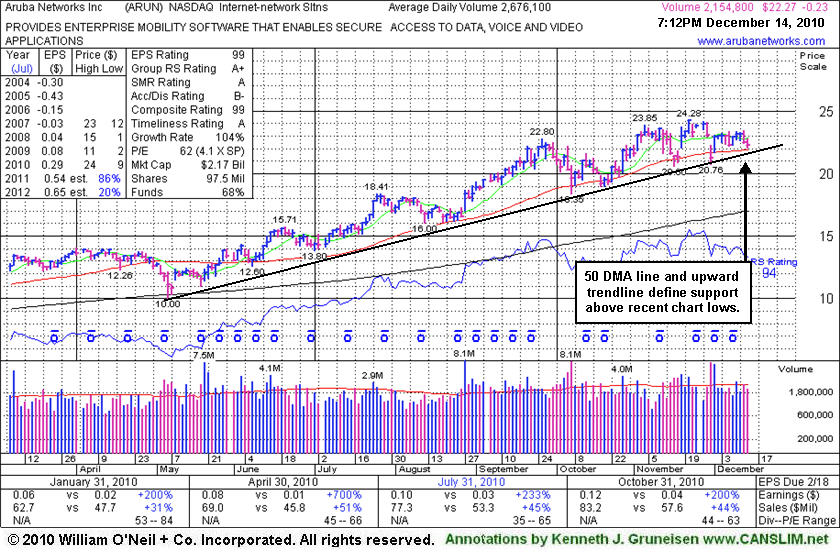
Aruba Networks Inc. (ARUN -$0.23 or -1.02% to $22.27) is perched -8.3% off its 52-week high, consolidating above its 50-day moving average (DMA) line and an upward trendline. They define support above recent chart lows near $20.60, where further deterioration would raise greater concerns. After enduring distributional pressure, its prompt repair of a recent 50 DMA line violation was a reassuring sign. The upward trendline connecting May - November lows was previously noted as support to watch, and it nearly coincides with is short-term average line.
Since first featured at $12.71 in the February 22, 2010 mid-day report it has traded up as much as +91%. Its Accumulation/Distribution Rating has improved to a B- from an E when it was last shown on 10/26/10 in this FSU section under the headline "Distributional Action Has Networking Firm Consolidating Above Support" after it endured losses with heavier volume. The number of top-rated funds owning an interest in its shares rose from 262 in Dec '09 to 389 in Sept '10 providing a nice reassurance with respect to the investment system's I criteria. Return On Equity reported at 21% is above the 17% guideline, an encouraging sign. Management's 24% ownership interest keeps the directors' focus on maintaining and growing shareholder value.
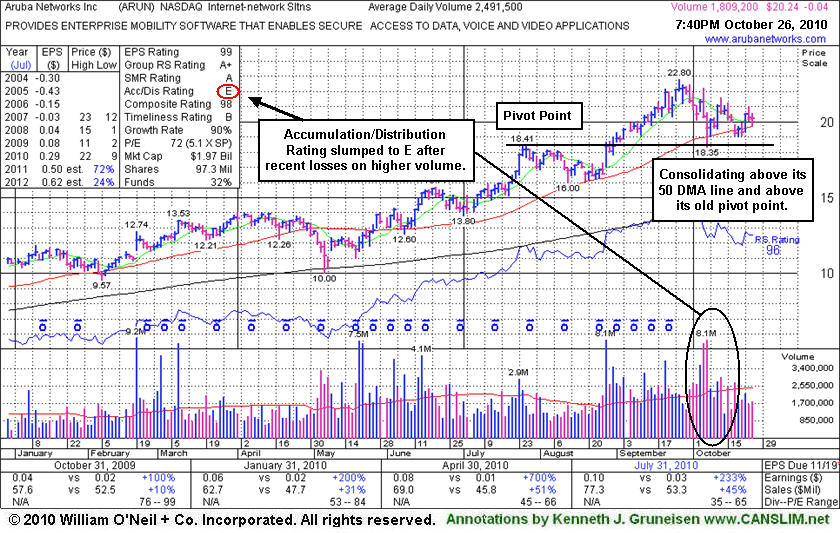
Aruba Networks Inc. (ARUN -$0.04 or -0.20% to $20.24) is consolidating above its 50-day moving average (DMA) line and its prior lows noted as an important support to watch. More damaging losses leading to technical violations would raise concerns. Since its last appearance in this FSU section with an annotated graph on 9/02/10 under the headline "High-Ranked Leader Attracting Institutional Interest" its Accumulation/Distribution Rating has fallen from a B to an E (see red circle) after it endured losses with heavier volume indicative of distributional pressure. That raises concerns, however, the number of top-rated funds owning an interest in its shares rose from 45 in Mar '09 to 113 in Sept '10 providing a nice reassurance with respect to the investment system's I criteria. Return On Equity reported at 21% is above the 17% guideline, an encouraging sign. Management's 26% ownership interest keeps the directors' focus on maintaining and growing shareholder value.
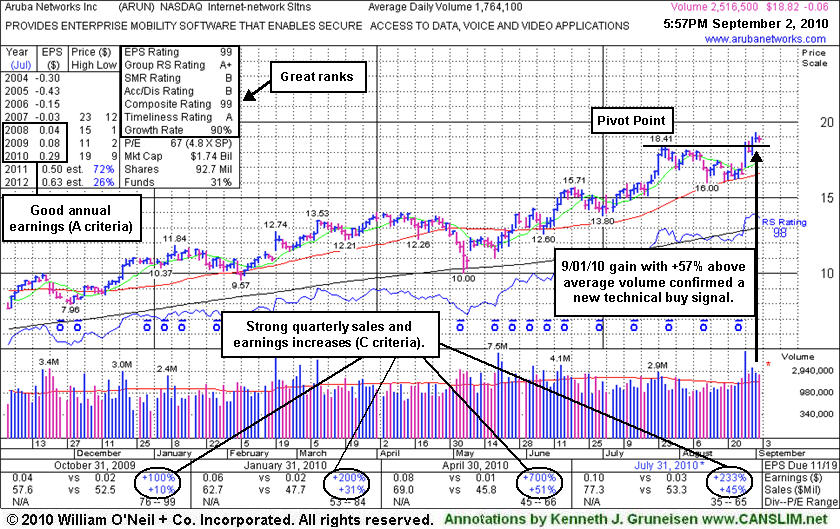
Confirming gains and a follow-through day on 9/01/10 (M criteria) helped trigger a technical buy signal after ARUN had returned to the Featured Stocks list as it was highlighted in yellow in the 8/30/10 mid-day report (read here). It rebounded impressively and produced strong quarterly sales revenues and earnings increases in the quarterly reports since it was dropped from the Featured Stocks list in early-May at the time of the "flash crash."
Aruba Networks Inc. (ARUN -$0.06 or -0.32% to $18.82) is holding its ground after recent gains for new 52-week highs backed by above average volume helped it rally above its pivot point from a base-on-base type pattern. Confirming gains and a follow-through day on 9/01/10 (M criteria) helped trigger a technical buy signal. It returned to the Featured Stocks list as it was highlighted in yellow in the 8/30/10 mid-day report (read here). It rebounded impressively and produced strong quarterly sales revenues and earnings increases in the quarterly reports since it was dropped from the Featured Stocks list in early-May at the time of the "flash crash."
The number of top-rated funds owning an interest in its shares rose from 45 in Mar '09 to 101 in Jun '10 providing a nice reassurance with respect to the investment system's I criteria. Return On Equity reported at 21% is now above the 17% guideline, an encouraging sign. Management's 26% ownership interest keeps the directors' focus on maintaining and growing shareholder value.
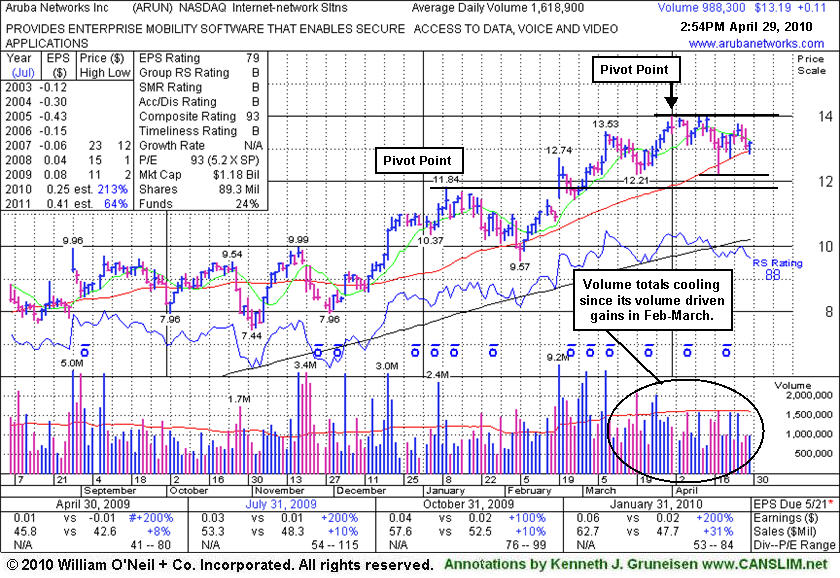
Aruba Networks Inc. (ARUN +$0.19 or +1.45% to $13.27) is consolidating quietly on below average volume, and volume totals have been generally cooling since its volume-driven gains in February and March. It has been finding support near its 50-day moving average (DMA) line. Subsequent deterioration below that important short-term average would raise concerns, while its recent chart low ($12.21 on 3/19/10) helps define the next nearest chart support above its old pivot point.
A new pivot point based on its 4/01/10 high plus ten cents has been noted considering its current 5-week flat base being formed. That may be the first "sound" base pattern formed since ARUN was first featured in yellow on 2/19/10 in the mid-day report with a note that it - "Gapped up today for a considerable gain and new 52 week high, rising from a flat base-on-base pattern" (read here). A convincing gain above its new pivot point with heavy volume would produce a new technical buy signal that may prompt new or add-on buying efforts.
Its current quarterly earnings (C criteria) increases have been above the +25% minimum guideline and earnings in recent years followed prior annual losses. The quarter ended Dec 31, 2009 also showed a more impressive +30% sales revenues increase, an encouraging acceleration. Earnings news is not pending in the near-term because its next report will be for the quarter ending on April 30, 2010, unlike the majority of companies which are now reporting.
The number of top-rated funds owning an interest in its shares rose from 45 in Mar '09 to 81 in March '10 providing a nice reassurance with respect to the investment system's I criteria. Return On Equity reported at 6% is below the 17% guideline, leaving some concerns. However, management's 26% ownership interest keeps the directors' focus on maintaining and growing shareholder value.
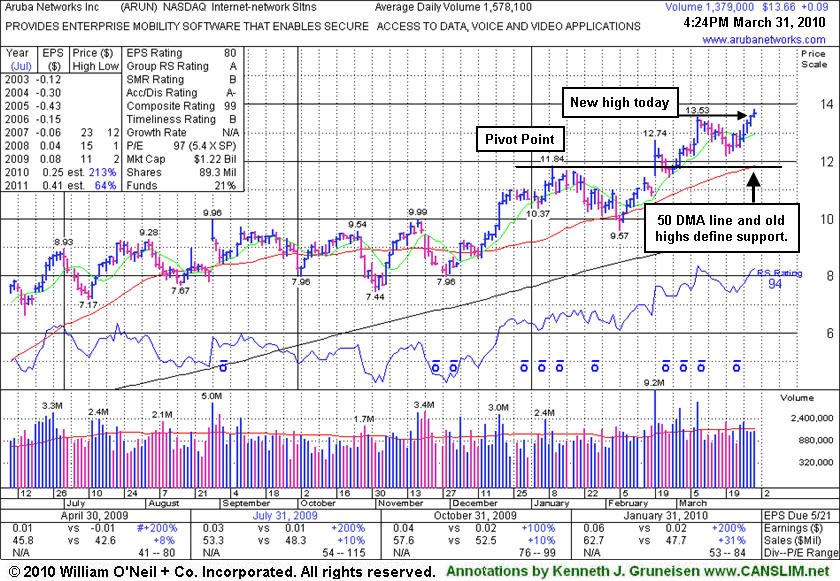
Aruba Networks Inc. (ARUN +$0.09 or +0.66% to $13.66) rallied today on near average volume for its 5th consecutive gain and a new 52-week high. It is extended from its prior base, and disciplined investors would avoid chasing it and wait for another ideal entry point within the investment system's guidelines. Support to watch is defined by prior chart highs and its 50-day moving average (DMA) line in the upper $11 area. It was first featured in yellow on 2/19/10 in the mid-day report with a note that it - "Gapped up today for a considerable gain and new 52 week high, rising from a flat base-on-base pattern" (read here).
Some of the strong technical action recently was an immediate response to its improving fundamentals. Its current quarterly earnings (C criteria) increases have been above the +25% minimum guideline and earnings in recent years followed prior annual losses. The quarter ended Dec 31, 2009 also showed a more impressive +30% sales revenues increase continuing its acceleration. The number of top-rated funds owning an interest in its shares rose from 45 in Mar '09 to 82 in Dec '09 providing a nice reassurance with respect to the investment system's I criteria. Return On Equity reported at 6% is below the 17% guideline, leaving some concerns. However, management's 26% ownership interest keeps the directors' focus on maintaining and growing shareholder value.
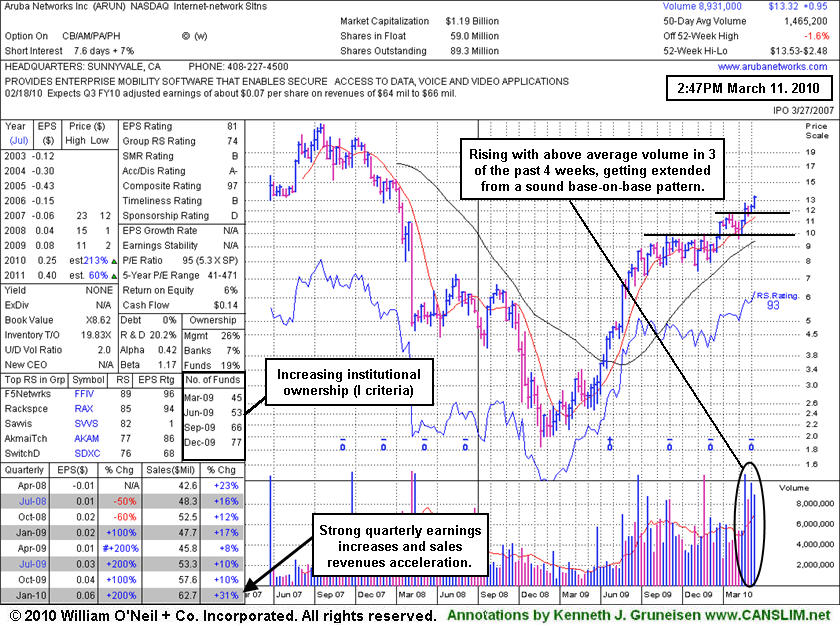
Aruba Networks Inc. (ARUN +$0.02 or +0.15% to $13.29) has been consolidating near its 52-week high after a considerable gain on 3/09/10 with volume nearly 4 times average. It is extended from its prior base, and disciplined investors would avoid chasing it and wait for another ideal entry point within the investment system's guidelines. Meanwhile, support to watch is now defined by prior chart highs and its 50-day moving average (DMA) line. When it gapped up 2/19/10 it was first featured in yellow in the mid-day report (read here) as its considerable gain for a new 52 week high on more than 8 times average volume helped it break out from a flat base-on-base pattern above its 50 DMA line. As previously noted, "a gap up gain with 8 times average volume is an indication of heavy institutional (I criteria) buying demand." It held its ground above prior chart highs and then followed through with additional confirming gains on heavy volume since its last appearance in this FSU section on 2/22/10 with an annotated daily graph under the headline "Held Ground After Prior Gap Up With 8 Times Average Volume." We will follow up that annotated daily graph with a weekly graph below that reveals several important data points.
Some of the strong technical action recently was an immediate response to its improving fundamentals. Its Up/Down Volume Ratio of 2.0 and gains backed by above average volume in 3 of the past 4 weeks are bullish signs. Its current quarterly earnings (C criteria) increases have been above the +25% minimum guideline and earnings in recent years followed prior annual losses. The quarter ended Dec 31, 2009 also showed a more impressive +30% sales revenues increase continuing its acceleration. The number of top-rated funds owning an interest in its shares rose from 45 in Mar '09 to 77 in Dec '09 providing a nice reassurance with respect to the investment system's I criteria. Return On Equity reported at 6% is below the 17% guideline, leaving some concerns. However, management's 26% ownership interest keeps the directors' focus on maintaining and growing shareholder value.
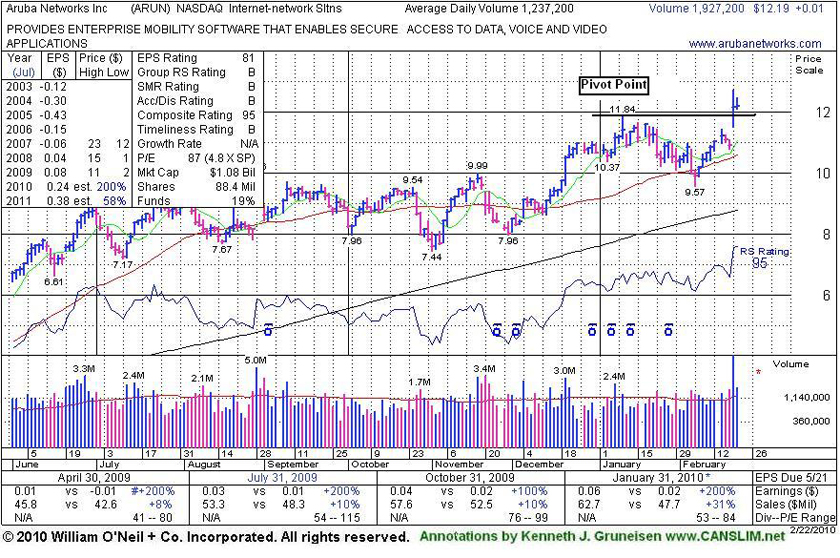
Aruba Networks Inc. (ARUN +$0.01 or +0.08% to $12.19) held its ground today. It gapped up 2/19/10 and was featured in the mid-day report (read here) as a considerable gain for a new 52 week high on more than 8 times average volume helped it break out from a flat base-on-base pattern above its 50-day moving average line. A gap up gain with 8 times average volume is an indication of heavy institutional (I criteria) buying demand.
Quarterly earnings increases (excluding items - click here to read about "Q2 Loss" in the Business Journal) have been strong and sales revenues in the latest quarter ended Jan 31, 2010 showed impressive acceleration. The strong technical action was an immediate response to its improving fundamentals. Its current quarterly earnings (C criteria) increases have been above the +25% minimum guideline and earnings in recent years followed prior annual losses.