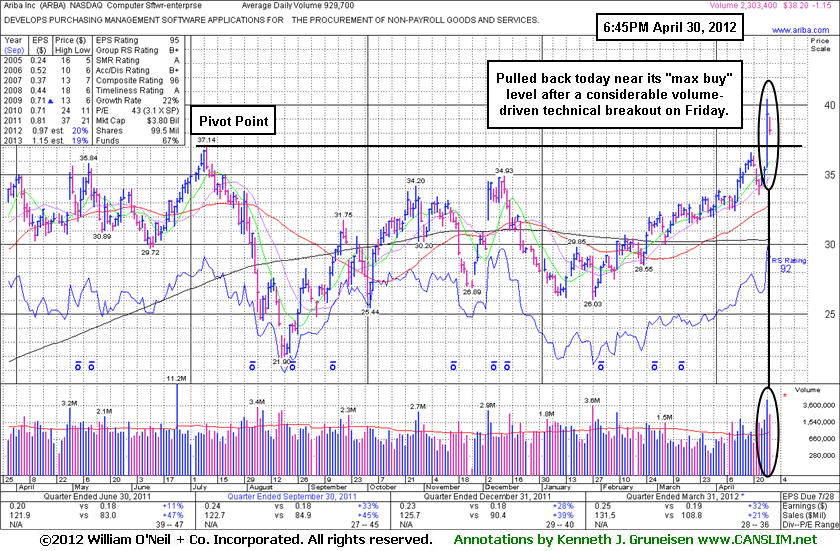
Ariba Inc (ARBA -$1.15 or -2.92% to $38.20) pulled back today with above average volume following the prior session's considerable gain backed by 5 times average volume. Support to watch is at prior highs in the $35-37 area. ARBA was highlighted in yellow in the 4/27/12 mid-day breakouts report (read here) when triggering a buy signal and blasting above the pivot point cited based on its 7/11/11 high plus 10 cents. It tallied 12 weekly gains in the span of 13 weeks and no overhead supply remains to act as resistance.
The high-ranked Computer Software - Enterprise firm reported earnings +32% on +21% sales revenues for the quarter ended March 31, 2012 versus the year ago period. The Sep and Dec '11 quarterly comparisons showed earnings increases above the +25% guideline, but sales revenues increases have shown sequential deceleration. Return on Equity reported at 13% is below the 17% guideline, a cause for slight concern. Its annual earnings (A criteria) history has been good since a downturn in FY '07. The current Up/Down Volume Ratio of 1.8 is an unbiased indication its shares have been under accumulation in the past 50 days. The number of top-rated funds owning its shares rose from 421 in Jun '11 to 437 in Mar '12.