There are no featured stock write-ups on APOG proir to 2/18/2025
 Upgrade your membership to see all of the expert analysis we have published on APOG now!
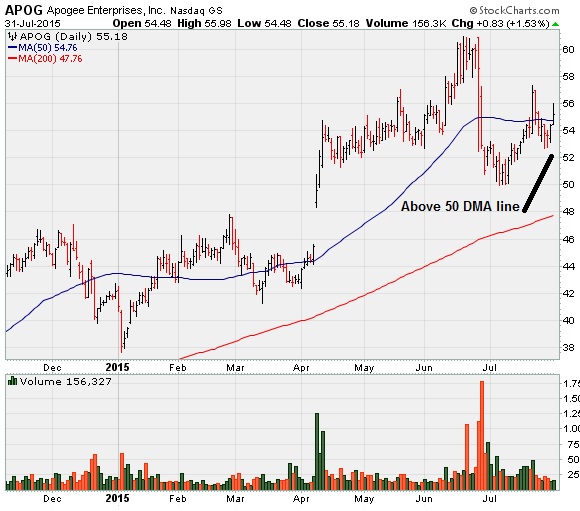
Rebound Above 50-Day Moving Average Line - Friday, July 31, 2015
Apogee Enterprises (APOG) rebounded back above its 50-day moving average (DMA) line and its color code was changed to yellow. Damaging losses below the recent low ($50.07 on 7/07/15) would raise greater concerns.
APOG was last shown in this FSU section on 7/13/15 with annotated graphs under the headline, "Sputtering After Damaging 50-Day Moving Average Violation". It traded up and much as +23.1% and since highlighted in yellow with pivot point cited based on its 2/26/15 high plus 10 cents in the 4/09/15 mid-day report (read here). By comparison, the benchmark S&P 500 Index is up +0.9% over that same timespan. Quarterly earnings rose +80%, 50%, +67%, +42%, 74%, and +95% in the Feb, May, Aug, Nov '14, Feb and May '15 quarterly comparisons, respectively, consistently well above the +25% minimum guideline (C criteria) in the 5 latest quarterly comparisons. Following a downturn and losses for FY '11 it has been showing better annual earnings (A criteria) growth. The Bldg- Constr Prds/Misc group has shown leadership (L criteria) and has a 94 Group Relative Strength Rating.
The number of top-rated funds owning its shares rose from 272 in Jun '14 to 350 in Jun '15, a reassuring sign concerning the I criteria. But its current Up/Down Volume Ratio of 0.8 is an unbiased indication its shares have been under distributional pressure over the past 50 days. Its small supply of only 28.1 million shares (S criteria) in the publicly traded flat can contribute to greater volatility in the event of institutional buying or selling.
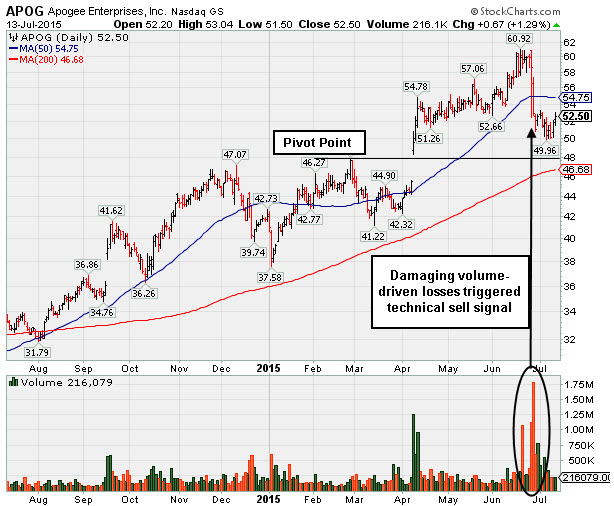
Sputtering After Damaging 50-Day Moving Average Violation - Monday, July 13, 2015
Apogee Enterprises (APOG +$0.67 or +1.29% to $52.50) is still quietly sputtering below its 50-day moving average (DMA) line ($54.89). A rebound above the 50 DMA line is needed to help its outlook improve. Subsequent damaging losses below recent low ($50.07 on 7/07/15) would raise greater concerns.
APOG wedged higher with gains lacking great volume conviction then it encountered damaging distributional pressure since last shown in this FSU section on 6/12/15 with annotated graphs under the headline, "Extended From Prior Base and Perched at High".
APOG traded up and much as +23.1% and is still up +5.4% since highlighted in yellow with pivot point cited based on its 2/26/15 high plus 10 cents in the 4/09/15 mid-day report (read here). By comparison, the benchmark S&P 500 Index is virtually unchanged over that same timespan.
Quarterly earnings rose +80%, 50%, +67%, +42%, 74%, and +95% in the Feb, May, Aug, Nov '14, Feb and May '15 quarterly comparisons, respectively, consistently well above the +25% minimum guideline (C criteria) in the 5 latest quarterly comparisons. Following a downturn and losses for FY '11 it has been showing better annual earnings (A criteria) growth. The Bldg- Constr Prds/Misc group has shown leadership (L criteria) and has a 89 Group Relative Strength Rating.
The number of top-rated funds owning its shares rose from 272 in Jun '14 to 345 in Jun '15, a reassuring sign concerning the I criteria. But its current Up/Down Volume Ratio of 0.7 is an unbiased indication its shares have been under distributional pressure over the past 50 days. Its small supply of only 28.1 million shares (S criteria) in the publicly traded flat can contribute to greater volatility in the event of institutional buying or selling.
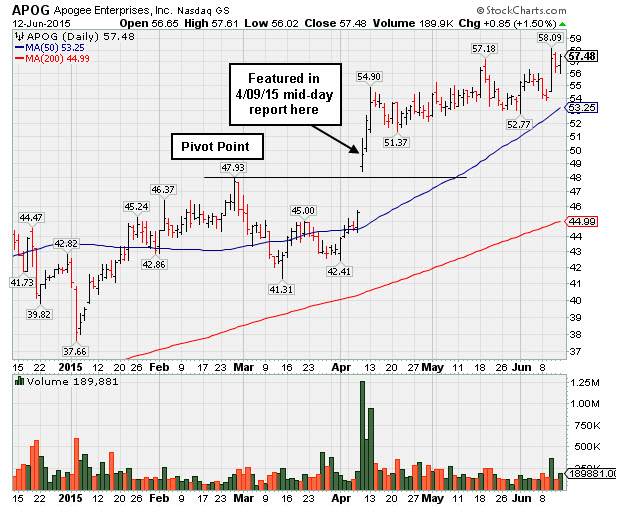
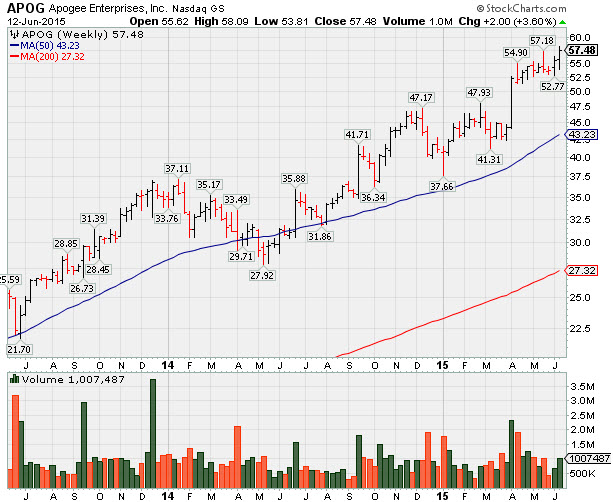
Extended From Prior Base and Perched at High - Friday, June 12, 2015
Apogee Enterprises (APOG +$0.85 or +1.50% to $57.48) is perched near its 52-week high, but it has not formed a sound new base. It stayed above its 50-day moving average (DMA) line ($53.31) since last shown in this FSU section on 5/20/15 with annotated graphs under the headline, "Wedged to New Highs Without Forming a Proper New Base". The 50 DMA line defines important support to watch on pullbacks.
By comparison, the benchmark S&P 500 Index is virtually unchanged while APOG is up +15.9% since highlighted in yellow with pivot point cited based on its 2/26/15 high plus 10 cents in the 4/09/15 mid-day report (read here). It gapped up hitting new 52-week highs (N criteria), then finished the session well above its pivot point, clinching a technical buy signal with 8 times its average daily volume behind the big gain.
Quarterly earnings rose +80%, 50%, +67%, +42%, and 74% in the Feb, May, Aug, Nov '14 and Feb '15 quarterly comparisons, respectively, consistently well above the +25% minimum guideline (C criteria) in the 5 latest quarterly comparisons. Following a downturn and losses for FY '11 it has been showing better annual earnings (A criteria) growth. The Bldg- Constr Prds/Misc group has shown leadership (L criteria) and has a 92 Group Relative Strength Rating.
The number of top-rated funds owning its shares rose from 272 in Jun '14 to 343 in Mar '15, a reassuring sign concerning the I criteria. Its current Up/Down Volume Ratio of 1.6 is also an unbiased indication its shares have been under accumulation over the past 50 days. Its small supply of only 28 million shares (S criteria) in the publicly traded flat can contribute to greater volatility in the event of institutional buying or selling.
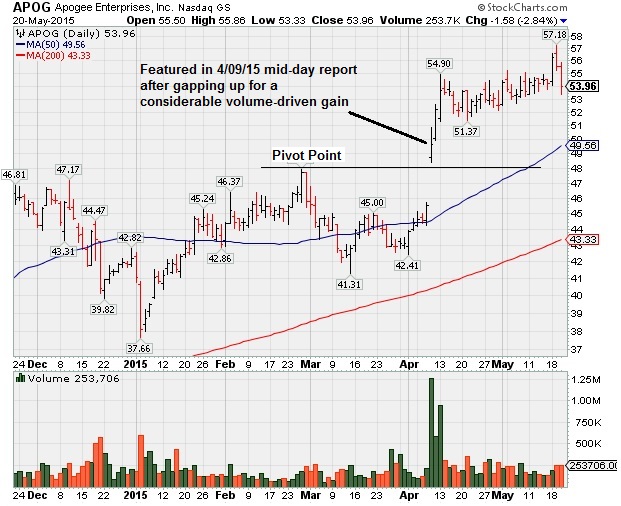
Wedged to New Highs Without Forming a Proper New Base - Wednesday, May 20, 2015
Apogee Enterprises (APOG -$1.58 or -2.84% to $53.96) pulled back for a 2nd consecutive session, retreating from its 52-week high with losses on average volume. It has not formed a sound base, but stubbornly held its ground while wedging higher in recent weeks. Its 50-day moving average (DMA) line and prior highs define important support to watch on pullbacks. It was last shown in this FSU section on 5/05/15 with annotated graphs under the headline, " Perched Near Its All-Time High, Extended From Prior Base".
APOG was highlighted in yellow with pivot point cited based on its 2/26/15 high plus 10 cents in the 4/09/15 mid-day report (read here). It gapped up hitting new 52-week highs (N criteria), then finished the session well above its pivot point, clinching a technical buy signal with 8 times its average daily volume behind the big gain.
Quarterly earnings rose +80%, 50%, +67%, +42%, and 74% in the Feb, May, Aug, Nov '14 and Feb '15 quarterly comparisons, respectively, consistently well above the +25% minimum guideline (C criteria) in the 5 latest quarterly comparisons. Following a downturn and losses for FY '11 it has been showing better annual earnings (A criteria) growth. The Bldg- Constr Prds/Misc group has shown leadership (L criteria) and has a 94 Group Relative Strength Rating.
The number of top-rated funds owning its shares rose from 272 in Jun '14 to 346 in Mar '15, a reassuring sign concerning the I criteria. Its current Up/Down Volume Ratio of 1.8 is also an unbiased indication its shares have been under accumulation over the past 50 days. Its small supply of only 27.7 million shares (S criteria) in the publicly traded flat can contribute to greater volatility in the event of institutional buying or selling.
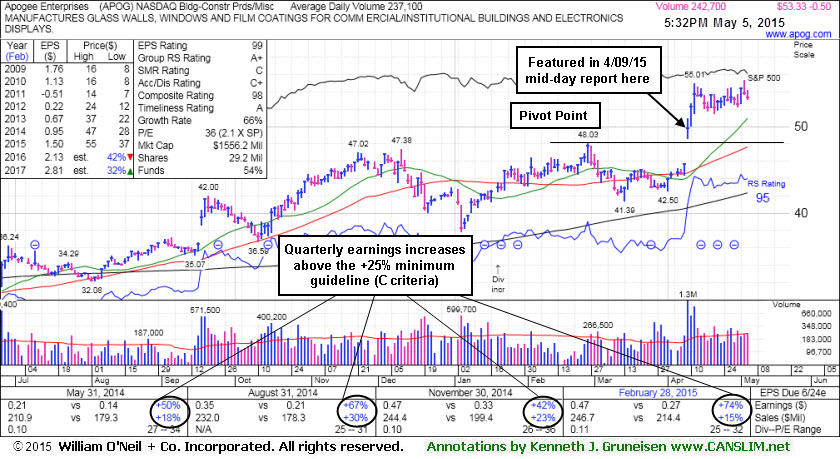
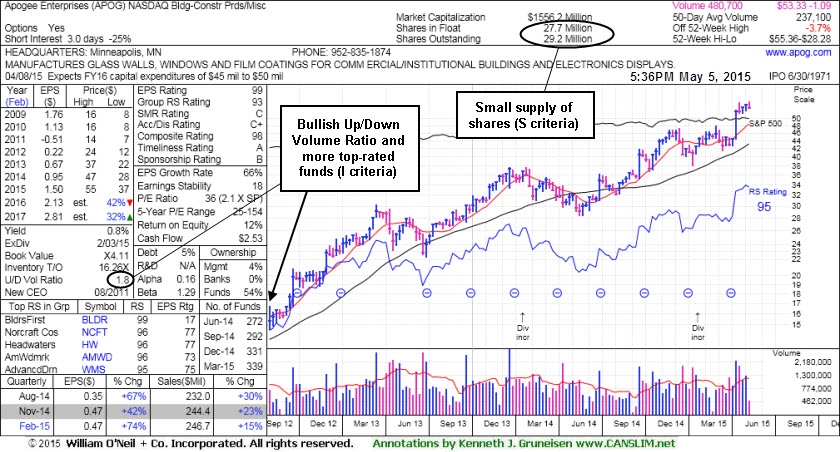
Perched Near Its All-Time High, Extended From Prior Base - Tuesday, May 05, 2015
Apogee Enterprises (APOG -$0.50 or -0.93% to $53.33) is extended from its prior base. Prior highs in the $48 area define initial support to watch on pullbacks. It was last shown in this FSU section on 4/09/15 with annotated graphs under the headline, "Breakaway Gap Backed With 8 Times Average Volume". It was highlighted in yellow with pivot point cited based on its 2/26/15 high plus 10 cents in the earlier mid-day report (read here). It gapped up hitting new 52-week highs (N criteria), then finished the session well above its pivot point, clinching a technical buy signal with 8 times its average daily volume behind the big gain.
APOG reported Feb '15 quarterly earnings +74% on +15% sales revenues. Earnings increases were above the +25% minimum guideline (C criteria) in the 5 latest quarterly comparisons. Following a downturn and losses for FY '11 it has been showing better annual earnings (A criteria) growth. The Bldg- Constr Prds/Misc group has shown leadership (L criteria) and has a 93 Group Relative Strength Rating.
The number of top-rated funds owning its shares rose from 272 in Jun '14 to 339 in Mar '15, a reassuring sign concerning the I criteria. Its current Up/Down Volume Ratio of 1.8 is also an unbiased indication its shares have been under accumulation over the past 50 days. Its small supply of only 27.5 million shares (S criteria) in the publicly traded flat can contribute to greater volatility in the event of institutional buying or selling.
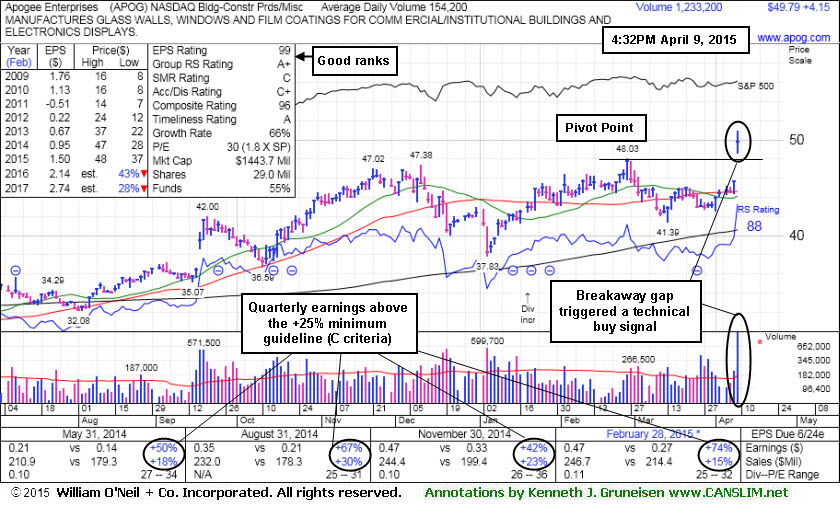
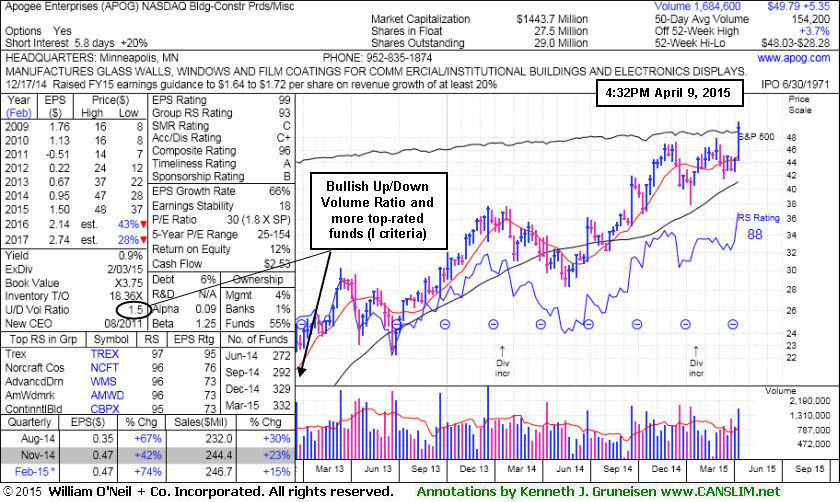
Breakaway Gap Backed With 8 Times Average Volume - Thursday, April 09, 2015
Apogee Enterprises (APOG +$4.14 or +9.07% to $49.78) was highlighted in yellow with pivot point cited based on its 2/26/15 high plus 10 cents in the earlier mid-day report (read here). It gapped up today hitting new 52-week highs (N criteria), then finished the session well above its pivot point, clinching a technical buy signal with 8 times its average daily volume behind the big gain.
APOG reported Feb '15 quarterly earnings +74% on +15% sales revenues. Earnings increases were above the +25% minimum guideline (C criteria) in the 5 latest quarterly comparisons. Following a downturn and losses for FY '11 it has been showing better annual earnings (A criteria) growth. The Bldg- Constr Prds/Misc group has shown leadership (L criteria) and has a 93 Group Relative Strength Rating.
The number of top-rated funds owning its shares rose from 272 in Jun '14 to 332 in Mar '15, a reassuring sign concerning the I criteria. Its current Up/Down Volume Ratio of 1.5 is also an unbiased indication its shares have been under accumulation over the past 50 days. Its small supply of only 27.5 million shares (S criteria) in the publicly traded flat can contribute to greater volatility in the event of institutional buying or selling.