Review of Ambarella's Rally and Technical Breakdown - Thursday, September 3, 2015
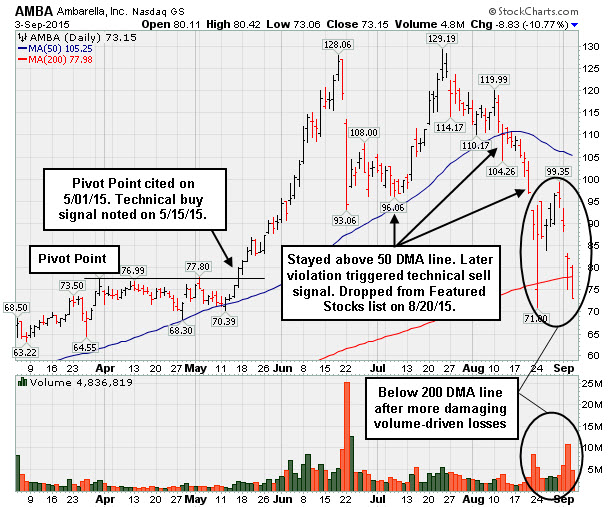
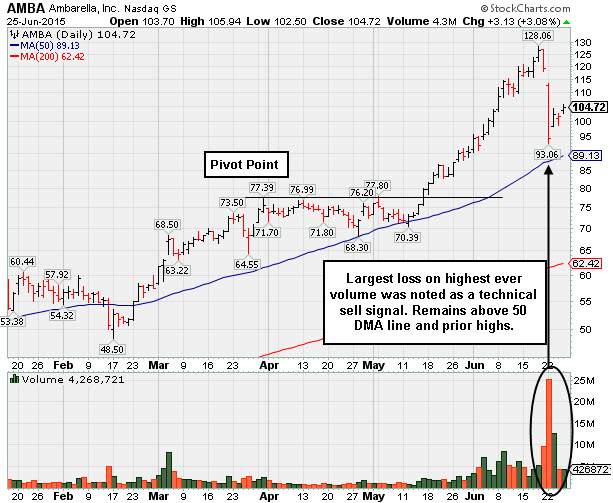
After an impressive rally it suffered a sharp pullback. It was noted 6/22/2015 11:29:55 AM - "Abruptly retreating for a 2nd consecutive loss with heavy volume. This is why members were reminded to avoid buying stocks that are very extended from a sound base pattern. While it may go on to produce more climatic gains, when a previously strong leader suffers its largest loss on the highest volume it has seen throughout its advance, such negative action may be considered a technical sell signal.
AMBA managed a remarkable rebound in the following weeks, but it barely made it to a new 52-week high before stalling again. Members were cautioned on 8/11/2015 3:07:31 PM - "Slumping near prior lows and its 50 DMA line defining important support in the $109-110 area. Damaging losses leading to violations would trigger technical sell signals."
It remained included on the Featured Stocks list, but members were cautioned once again on 8/18/2015 1:51:36 PM - "Still sputtering below its 50 DMA line. Outlook gets worse the longer it lingers below that important short-term average. Damaging losses below recent lows ($104.26 on 8/12/15) would raise greater concerns and trigger a more worrisome technical sell signal."
And after additional damage it was given a final note on 8/20/2015 3:51:13 PM "Slumping further below its 50 DMA line and near prior lows in the $93 area defining the next important support level. Only a rebound above its 50 DMA line would help its outlook. Will be dropped from the Featured Stocks list tonight due to technical deterioration."
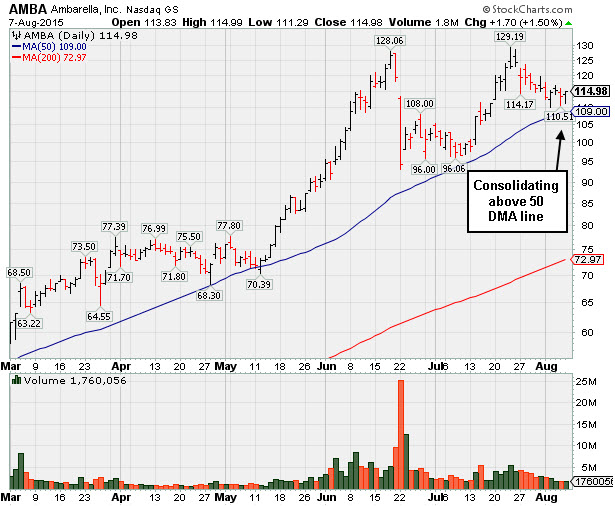
Choppy Consolidation is Not a New Cup-With-Handle Base - Friday, August 7, 2015
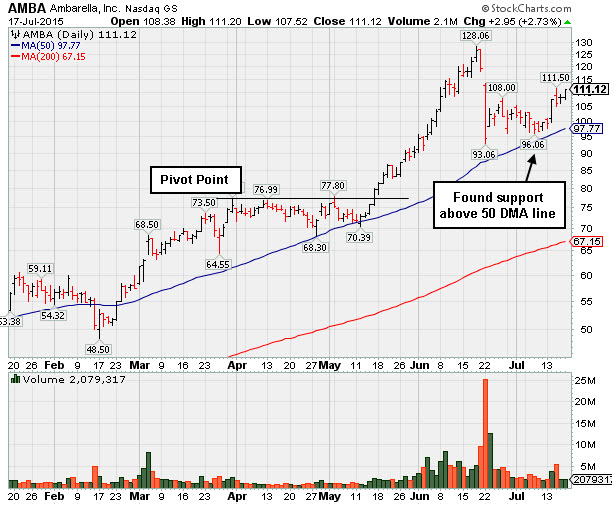
Found Support Above 50-Day Moving Average After Sharp Pullback - Friday, July 17, 2015
Holding Ground After Big Pullback on Heavy Volume Triggered Technical Sell Signal - Thursday, June 25, 2015
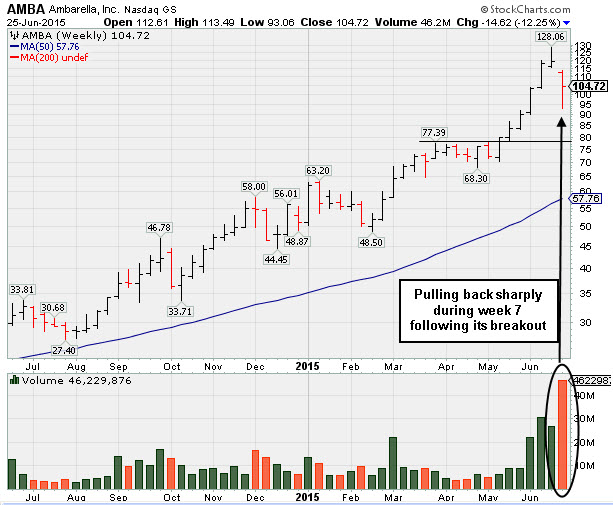
Ambarella Corporation (AMBA +$3.13 or +3.08% to $104.73) rebounded further with another gain today backed by above average volume. It may go on to produce more climatic gains, however, its large loss on 6/22/15 with heavy volume was noted as a technical sell signal.
It was repeatedly noted, "Very extended from any sound base with volume-driven gains having the look of a 'climax run'." Following its technical breakout with +77% above average volume on 5/15/15 it tallied gains of greater than +20% in the first 2-3 weeks, and when such substantial gains are quickly produced the fact-based investment system's rules suggest holding for a minimum of 8 weeks. Investors who may still have a good profit cushion might choose to give it additional time, however any subsequent losses on higher volume might trigger additional sell signals, especially if it violates its 50-day moving average (DMA) line or breaks down below its pivot point and slumps back into the prior base.
The high-ranked Electronics - Semiconductor firm was last shown in this FSU section on 6/02/15 with annotated graphs under the headline, "Extended From Base Following Spurt of Volume-Driven Gains". It reported earnings +184% on +74% sales revenues for the Apr '15 quarter, continuing to show impressive sales revenues and earnings acceleration in sequential quarterly comparisons. It reported earnings increases of +42%, 84%, and +162% in the Jul, Oct '14 and Jan '15 quarterly comparisons versus the year-ago periods, respectively. Sales revenues during that span rose +25%, +43%, and +62%. Its fundamentals match with the fact-based investment system guidelines with quarterly comparisons showing improvement above the +25% minimum earnings guideline (C criteria).
Extended From Base Following Spurt of Volume-Driven Gains - Tuesday, June 2, 2015
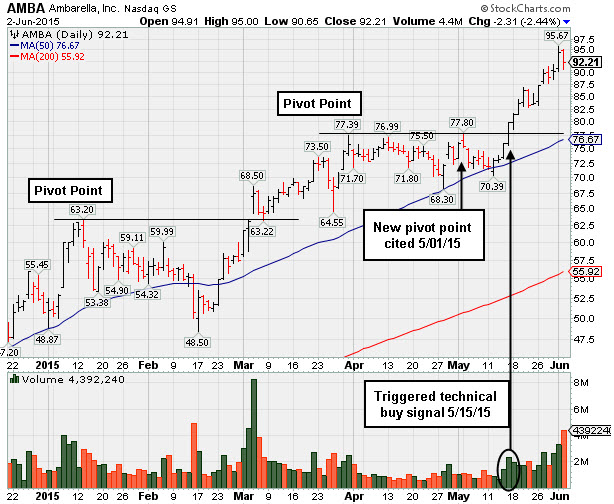
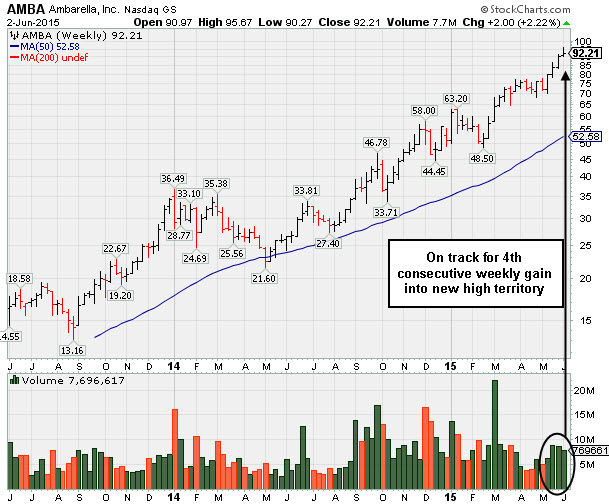
Ambarella Corporation (AMBA -$2.31 or -2.44% to $92.21) pulled back today from new all-time highs following an impressive spurt of volume-driven gains. Disciplined investors avoid chasing extended stocks. Prior highs in the $77 area define initial support to watch on pullbacks.
On 5/01/15 a new pivot point was cited based on its 3/31/15 high plus 10 cents. The high-ranked Electronics - Semiconductor firm was last shown in this FSU section on 5/12/15 with annotated graphs under the headline, "Did Not Trigger New Buy Signal But Found Support Near 50 Day Moving Average". Subsequent gains above the pivot point on 5/15/15 backed by +77% above average volume triggered a technical buy signal.
It reported earnings +184% on +74% sales revenues for the Apr '15 quarter, continuing to show impressive sales revenues and earnings acceleration in sequential quarterly comparisons. It reported earnings increases of +42%, 84%, and +162% in the Jul, Oct '14 and Jan '15 quarterly comparisons versus the year-ago periods, respectively. Sales revenues during that span rose +25%, +43%, and +62%. AMBA's fundamentals match with the fact-based investment system guidelines with quarterly comparisons showing improvement above the +25% minimum earnings guideline (C criteria).
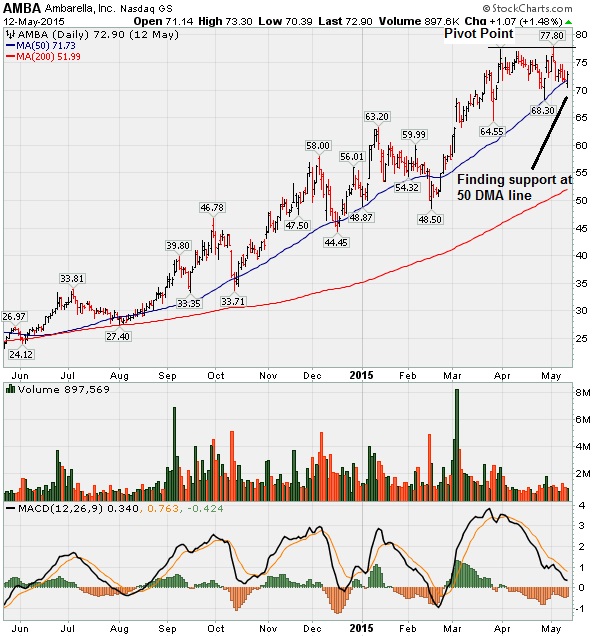
Did Not Trigger New Buy Signal But Found Support Near 50 Day Moving Average - Tuesday, May 12, 2015
On 5/01/15 a new pivot point was cited based on its 3/31/15 high plus 10 cents. Volume-driven gains above the pivot point cited are still needed to trigger a new (or add-on) technical buy signal.
The high-ranked Electronics - Semiconductor firm was last shown in this FSU section on 4/20/15 with annotated graphs under the headline, "Perched at All-Time High, Extended From Prior Base".
It reported earnings increases of +42%, 84%, and +162% in the Jul, Oct '14 and Jan '15 quarterly comparisons versus the year-ago periods, respectively. Sales revenues during that span rose +25%, +43%, and +62%, show impressive sales revenues and earnings acceleration in sequential quarterly comparisons. AMBA's fundamentals match with the fact-based investment system guidelines with quarterly comparisons showing improvement above the +25% minimum earnings guideline (C criteria).
The number of top-rated funds owning its shares has been on the rise, up from 51 in Dec '12 to 237 in Mar '15, a reassuring indication concerning the I criteria. Its current Up/Down Volume Ratio of 1.4 is also an unbiased indication its shares have been under slight accumulation over the past 50 days. Its small supply (S criteria) of only 27.6 million shares in the public float can contribute to great price volatility in the event of institutional buying or selling.
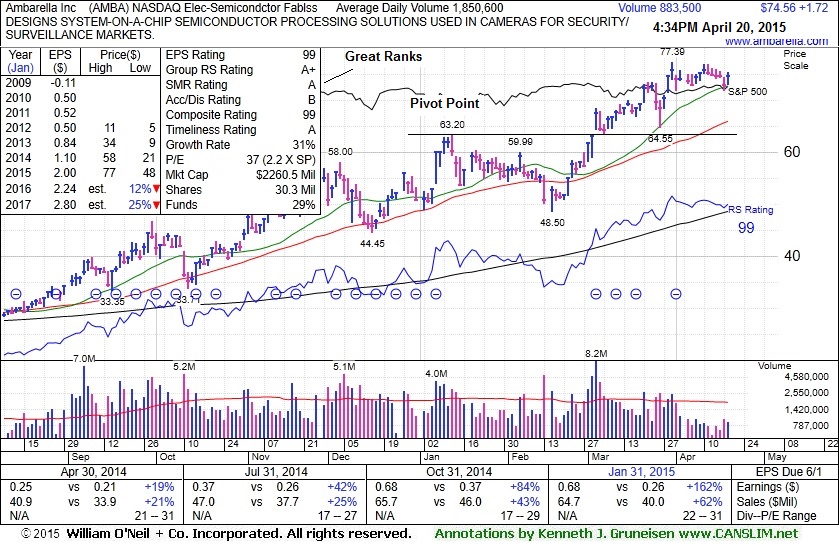
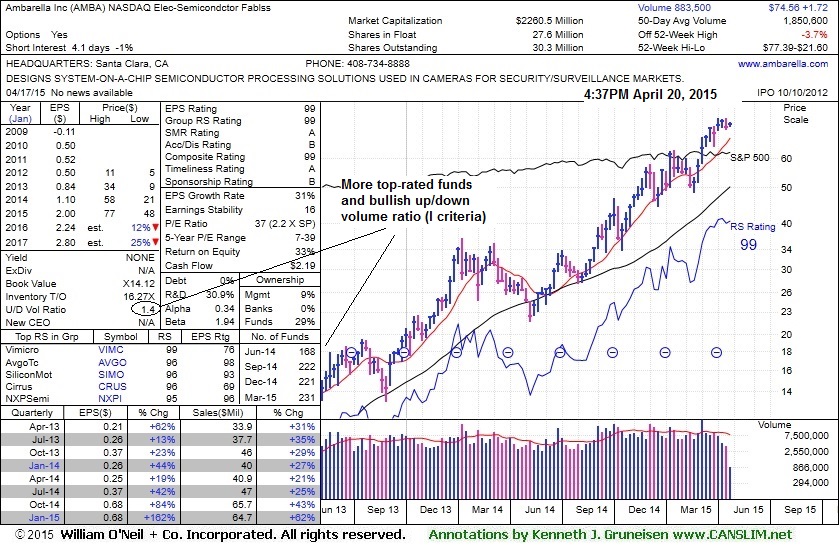
Perched at All-Time High, Extended From Prior Base - Monday, April 20, 2015
Ambarella Corporation's (AMBA +$1.72 or +2.36% to $74.56) volume totals have cooled in recent weeks while stubbornly holding its ground near its all-time high. It has not formed a sound base of sufficient length. Its 50-day moving average (DMA) line ($65.91) and recent low ($64.55 on 3/26/15) define important near term support to watch on pullbacks.
The high-ranked Electronics - Semiconductor firm was last shown in this FSU section on 3/30/15 with annotated graphs under the headline, "Getting Extended After Brief Pullback". Members were reminded - "Disciplined investors avoid chasing stocks more than +5% above their prior highs."
On 3/02/15 a new pivot point was cited based on its 1/13/15 high plus 10 cents. On 3/04/15 it gapped up for a considerable volume-driven gain triggering a technical buy signal after it reported earnings +162% on +62% sales revenues for the Jan '15 quarter - continuing to show impressive sales revenues and earnings acceleration in sequential quarterly comparisons (see annotated graph below). AMBA's fundamentals match with the fact-based investment system guidelines with quarterly comparisons showing improvement above the +25% minimum earnings guideline (C criteria).
The number of top-rated funds owning its shares has been on the rise, up from 51 in Dec '12 to 231 in Mar '15, a reassuring indication concerning the I criteria. Its current Up/Down Volume Ratio of 1.4 is also an unbiased indication its shares have been under slight accumulation over the past 50 days. Its small supply (S criteria) of only 27.6 million shares in the public float can contribute to great price volatility in the event of institutional buying or selling.
Getting Extended After Brief Pullback - Monday, March 30, 2015
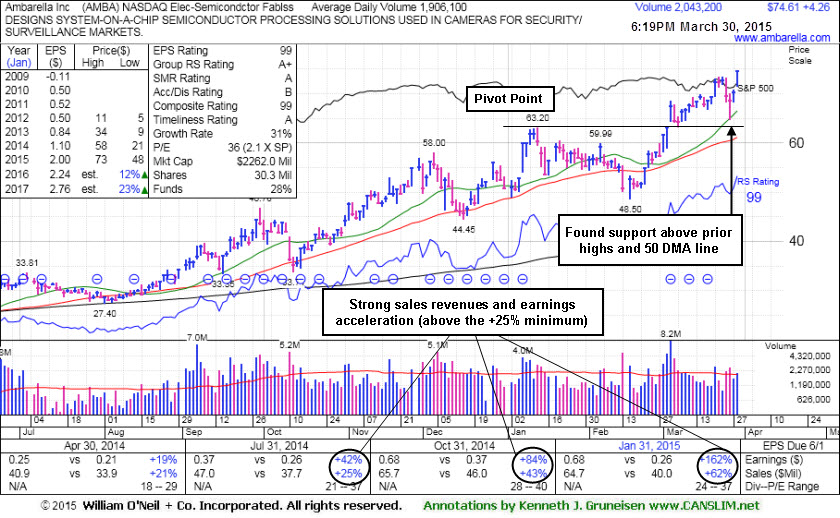
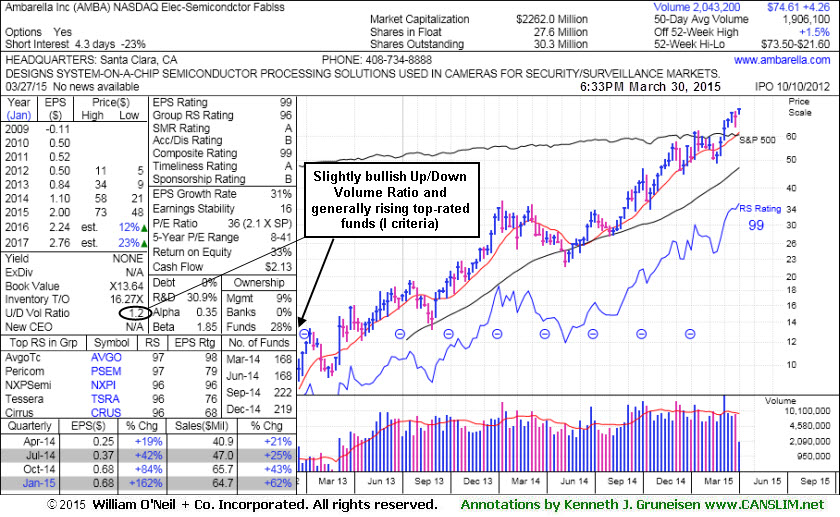
Ambarella Corporation (AMBA +$4.26 or +6.06% to $74.61) hit a new 52-week high, getting more extended from the latest sound base. It posted gains and promptly rebounded after a brief dip below its "max buy" level. Prior highs near $63 define important near term support to watch on pullbacks. The high-ranked Electronics - Semiconductor firm was last shown in this FSU section on 3/10/15 with annotated graphs under the headline, "Rallied Above Max Buy Level Following Strong Earnings News", Members were reminded - "Disciplined investors avoid chasing stocks more than +5% above their prior highs."
On 3/02/15 a new pivot point was cited based on its 1/13/15 high plus 10 cents. On 3/04/15 it gapped up for a considerable volume-driven gain triggering a technical buy signal after it reported earnings +162% on +62% sales revenues for the Jan '15 quarter - continuing to show impressive sales revenues and earnings acceleration in sequential quarterly comparisons (see annotated graph below). AMBA's fundamentals match with the fact-based investment system guidelines with quarterly comparisons showing improvement above the +25% minimum earnings guideline (C criteria).
The number of top-rated funds owning its shares has been on the rise, up from 51 in Dec '12 to 219 in Dec '14, a reassuring indication concerning the I criteria. Its current Up/Down Volume Ratio of 1.2 is also an unbiased indication its shares have been under slight accumulation over the past 50 days. Its small supply (S criteria) of only 27.6 million shares in the public float can contribute to great price volatility in the event of institutional buying or selling.
Rallied Above Max Buy Level Following Strong Earnings News - Tuesday, March 10, 2015
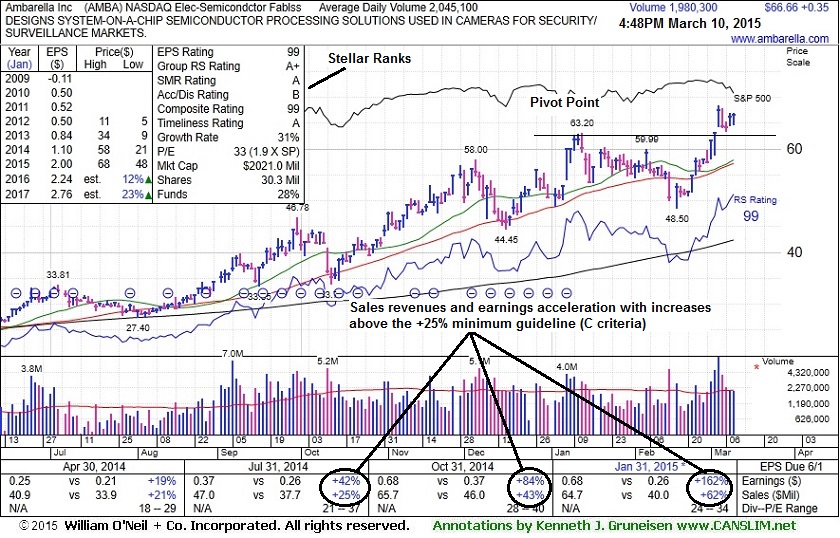
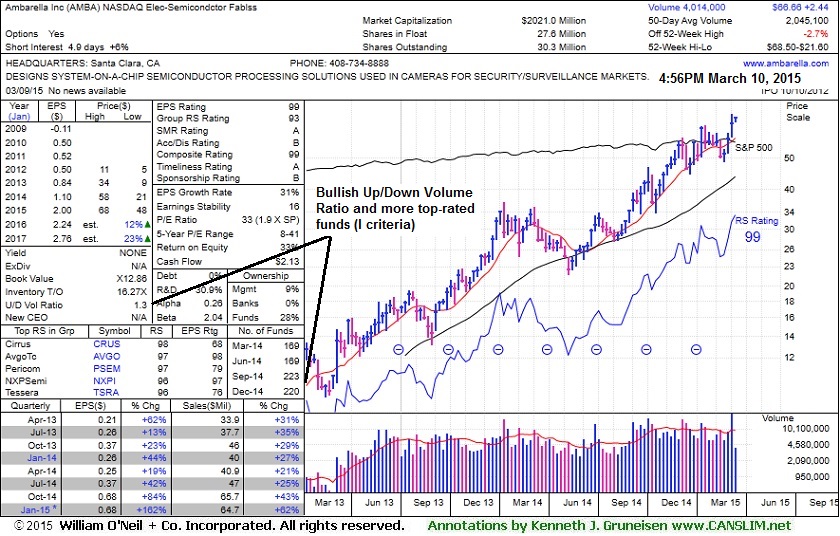
Ambarella Corporation (AMBA -0.97 or -1.84% to $66.61) finished just above its "max buy" level with near average volume behind today's gain. Disciplined investors avoid chasing stocks more than +5% above their prior highs. On 3/02/15 a new pivot point had been cited based on its 1/13/15 high plus 10 cents. Then, on 3/04/15 it gapped up for a considerable volume-driven gain triggering a technical buy signal after it reported earnings +162% on +62% sales revenues for the Jan '15 quarter - continuing to show impressive sales revenues and earnings acceleration in sequential quarterly comparisons (see annotated graph below).
The high-ranked Electronics - Semiconductor firm was last shown in this FSU section on 2/18/15 with an annotated graph under the headline, "Violation of 50-Day Moving Average Triggered Sell Signal". A subsequent rebound above the 50 DMA line helped its outlook improve. Members were reminded - "Keep in mind that any stock that is sold can always be bought again if strength returns. Disciplined investors do not make excuses for any stock that falls more than -7% from their purchase price.""
AMBA's fundamentals match with the fact-based investment system guidelines with quarterly comparisons showing improvement above the +25% minimum earnings guideline (C criteria). The number of top-rated funds owning its shares rise from 51 in Dec '12 to 220 in Dec '14, a reassuring indication concerning the I criteria. Its current Up/Down Volume Ratio of 1.3 is also an unbiased indication its shares have been under accumulation over the past 50 days. Its small supply (S criteria) of only 27.6 million shares in the public float can contribute to great price volatility in the event of institutional buying or selling.
Violation of 50-Day Moving Average Triggered Sell Signal - Wednesday, February 18, 2015
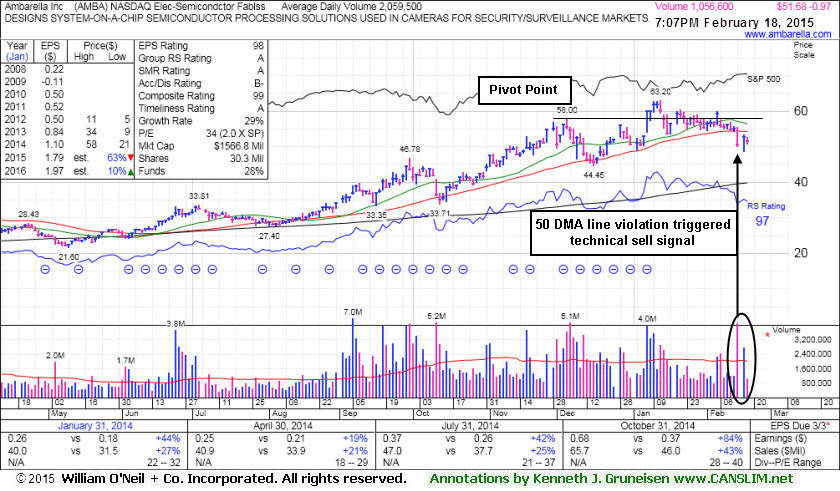
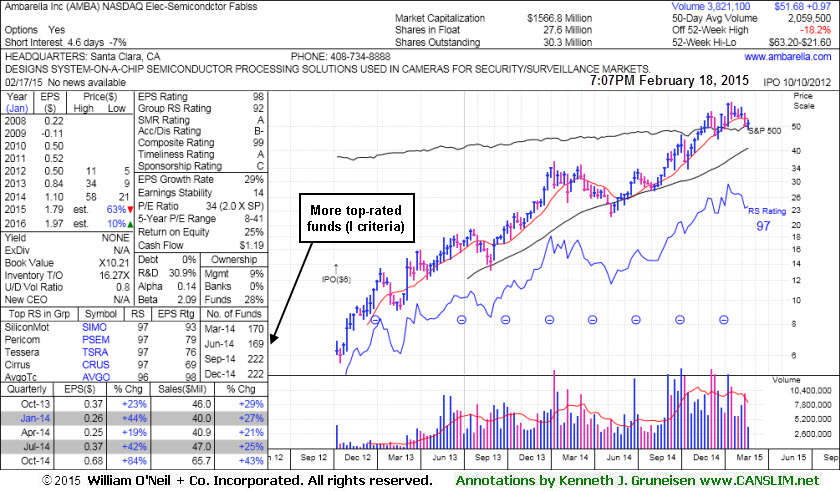
Ambarella Corporation (AMBA -0.97 or -1.84% to $51.68) edged lower today with light volume. It managed a" positive reversal" on the prior session following a damaging violation of its 50-day moving average (DMA) line on 2/13/15 which triggered a technical sell signal. A prompt rebound above the 50 DMA line would help its outlook improve, however that important short-term average may act as resistance.The high-ranked Electronics - Semiconductor firm was last shown in this FSU section on 1/27/15 with an annotated graph under the headline, "Volume Totals Cooling While Staying Above 50-Day Moving Average". Members were reminded - "A damaging violation of that important short-term average would raise concerns and trigger a technical sell signal. Keep in mind that any stock that is sold can always be bought again if strength returns. Disciplined investors do not make excuses for any stock that falls more than -7% from their purchase price.""
It was highlighted in yellow in the 1/07/15 mid-day report (read here) with pivot point cited based on its 12/04/14 high plus 10 cents. Fundamentals match with the fact-based investment system guidelines after it reported earnings +84% on +43% sales revenues for the Oct '14 quarter. Recent quarterly comparisons show improvement above the +25% minimum earnings guideline (C criteria) with sales revenues showing encouraging acceleration. The number of top-rated funds owning its shares rise from 51 in Dec '12 to 222 in Dec '14, a reassuring indication concerning the I criteria. Its small supply (S criteria) of only 27.6 million shares in the public float can contribute to great price volatility in the event of institutional buying or selling.
Volume Totals Cooling While Staying Above 50-Day Moving Average - Tuesday, January 27, 2015
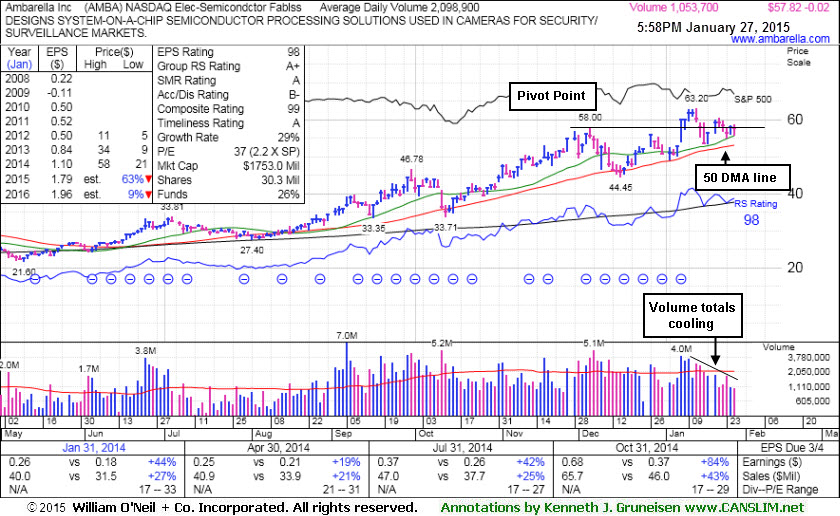
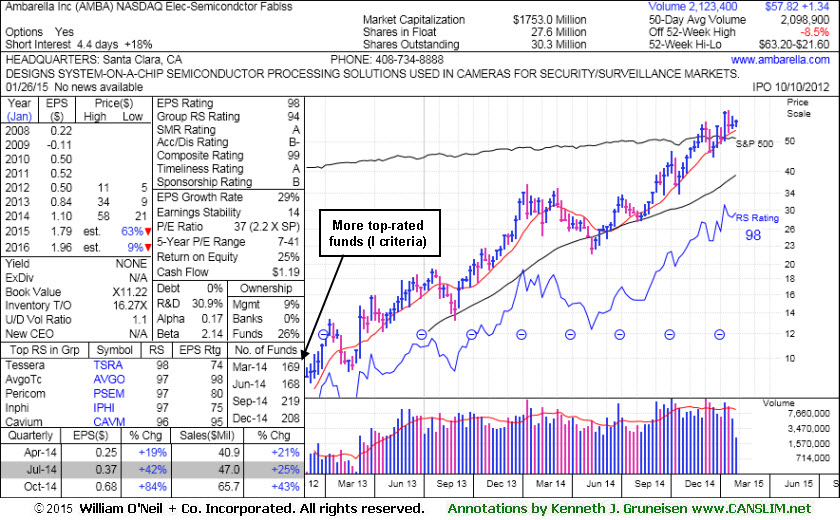
Ambarella Corporation (AMBA -0.02 or -0.03% to $57.82) is consolidating with volume totals cooling in recent weeks while staying above near-term support at its 50-day moving average (DMA) line ($53.07). A damaging violation of that important short-term average would raise concerns and trigger a technical sell signal.
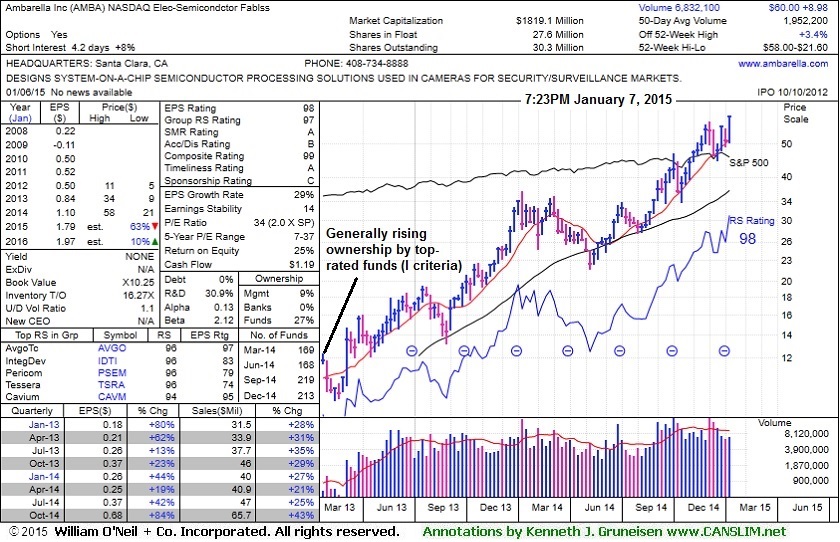
The high-ranked Electronics - Semiconductor firm was last shown in this FSU section on 1/07/15 with an annotated graph under the headline, "Strong Finish Triggered a Technical Buy Signal". It was highlighted in yellow in the mid-day report (read here) with pivot point cited based on its 12/04/14 high plus 10 cents. The gain above its pivot point for a new high was backed by +105% above average volume triggering a convincing technical buy signal. Members were previously reminded - "Keep in mind that any stock that is sold can always be bought again if strength returns. Disciplined investors do not make excuses for any stock that falls more than -7% from their purchase price."
Fundamentals were noted as a better match with the fact-based investment system after it reported earnings +84% on +43% sales revenues for the Oct '14 quarter. Recent quarterly comparisons show improvement above the +25% minimum earnings guideline (C criteria) with sales revenues showing encouraging acceleration. The number of top-rated funds owning its shares rise from 51 in Dec '12 to 208 in Dec '14, a reassuring indication concerning the I criteria. Its small supply (S criteria) of only 27.6 million shares in the public float can contribute to great price volatility in the event of institutional buying or selling.
Strong Finish Triggered a Technical Buy Signal - Wednesday, January 07, 2015
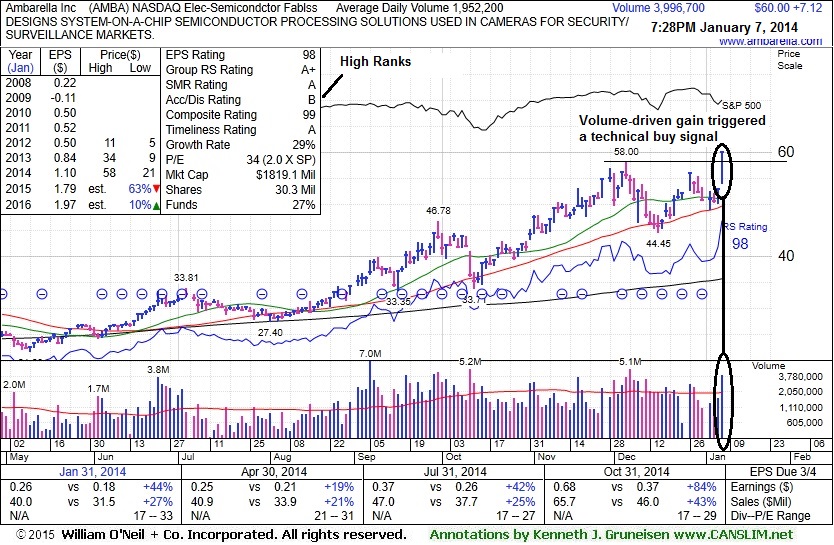
Ambarella Corporation (AMBA +7.12 or +13.46% to $60.00) finished strong today after highlighted in yellow in the mid-day report (read here) with pivot point cited based on its 12/04/14 high plus 10 cents. The gain above its pivot point for a new high was backed by +105% above average volume triggering a convincing technical buy signal. However, members are reminded that recent market commentaries have pointed out the broader market's downturn as a "correction", and new buying efforts are only to be made when the market is in a confirmed uptrend.
AMBA found support at its 50-day moving average (DMA) line while consolidating in recent weeks. It was noted in prior mid-day reports - "Fundamentals are a better match with the fact-based investment system after it reported earnings +84% on +43% sales revenues for the Oct '14 quarter. Recent quarterly comparisons show improvement above the +25% minimum earnings guideline (C criteria) with sales revenues showing encouraging acceleration. Patient investors may watch for a new base or secondary buy point to possibly develop and be noted in the weeks ahead."
The high-ranked Electronics - Semiconductor firm was last shown in this FSU section on 8/13/13 with an annotated graph under the headline, "50-Day Moving Average Recently Acted As Resistance ". Members were reminded - "Keep in mind that any stock that is sold can always be bought again if strength returns. Disciplined investors do not make excuses for any stock that falls more than -7% from their purchase price. Investors could have better odds by pouncing on another stock staging a fresh and powerful technical breakout, rather than holding on to any lagging stock trading below its 50 DMA line. The longer a stock remains trading below its 50 DMA line the worse its outlook gets, and it may meanwhile be prone to an even deeper consolidation."
The number of top-rated funds owning its shares rise from 51 in Dec '12 to 213 in Dec '14, a reassuring indication concerning the I criteria. Its small supply (S criteria) of only 27.6 million shares in the public float can contribute to great price volatility in the event of institutional buying or selling.
50-Day Moving Average Recently Acted As Resistance - Tuesday, August 13, 2013
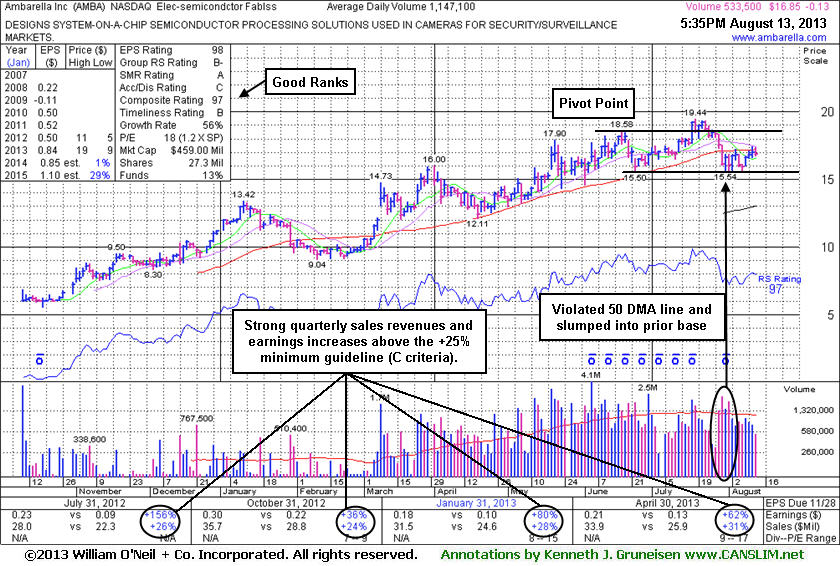
Ambarella Corporation (AMBA -$0.13 or -0.77% to $16.85) has been encountering resistance at its 50-day moving average (DMA) line. A technical violation triggered a sell signal on 7/30/13 as it completely negated the latest breakout and slumped back into its prior base. A prompt rebound above that important short-term average would help its outlook improve. The stock made limited headway after last shown in this FSU section on 7/17/13 with an annotated graph under the headline, "Technical Breakout Backed By +65% Above Average", when breaking out from a short "square box" base pattern. That summary contrasted the stock's +27.9% gain in under 5 months time, with the S&P 500 Index's +17.8% year-to-date gain, a vivid example of the potential advantages investors may gain when carefully selecting individual stocks using the fact-based investment system.
AMBA closed today's session still well above $15.04 as it was priced when first shown in this FSU section under the headline, "Volume-Driven Gain From Cup-With-High-Handle to New 52-Week High - Tuesday, March 26, 2013 ". While it may go on to form a sound new base pattern, for now its consolidation has been too brief. Keep in mind that any stock that is sold can always be bought again if strength returns. Disciplined investors do not make excuses for any stock that falls more than -7% from their purchase price. Investors could have better odds by pouncing on another stock staging a fresh and powerful technical breakout, rather than holding on to any lagging stock trading below its 50 DMA line. The longer a stock remains trading below its 50 DMA line the worse its outlook gets, and it may meanwhile be prone to an even deeper consolidation.
The high-ranked Electronics - Semiconductor firm recently reported strong earnings and revenues increases for the April '13 quarter, continuing its streak of strong quarterly earnings comparisons versus the year ago periods - satisfying the C criteria with increases above the +25% minimum guideline. The number of top-rated funds owning its shares rise from 51 in Dec '12 to 78 in Jun '13, a reassuring indication concerning the I criteria. Its current Up/Down Volume Ratio of 1.2 is also an unbiased indication that its shares have been under slight accumulation over the past 50 days. Its small supply (S criteria) of only 13.9 million shares in the public float can contribute to great price volatility in the event of institutional buying or selling. It has been a while since the stock flashed any signs of heavy institutional buying demand.
Technical Breakout Backed By +65% Above Average - Wednesday, July 17, 2013
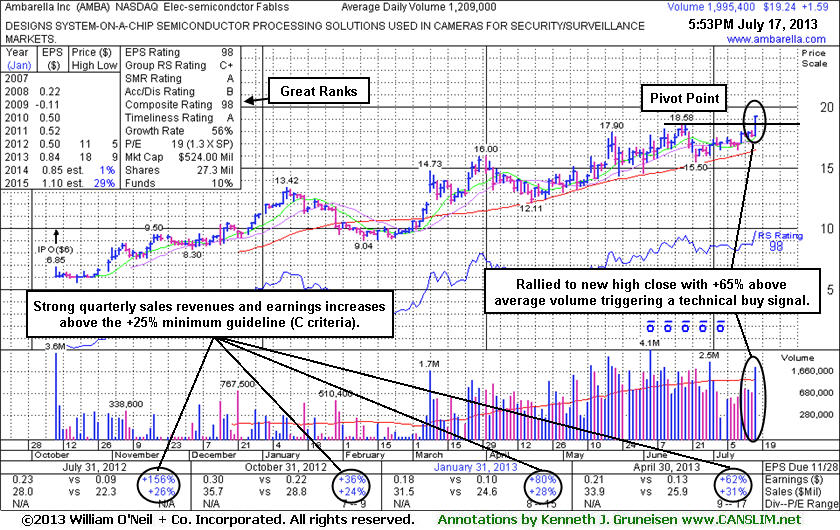
Ambarella Corporation (AMBA +$1.59 or +9.01% to $19.24) rallied above its pivot point with +65% above average volume breaking out from a short "square box" base pattern and triggering a new (or add-on) technial buy signal. It consolidated in a healthy fashion above its 50-day moving average (DMA) line while volume totals cooled in recent weeks. Its was last shown in this FSU section on 6/27/13 with an annotated graph under the headline, "Consolidating Above 50-Day Moving Average Line". Chart-readers recognize that short-term average as an important support level to watch where a violation would trigger a worrisome technical sell signal. It stayed above the 50 DMA line since blasting higher in March.
AMBA closed today's session +27.9% from the $15.04 it was when first shown in this FSU section under the headline, "Volume-Driven Gain From Cup-With-High-Handle to New 52-Week High - Tuesday, March 26, 2013 ". Keep in mind that 3 out of 4 stocks tend to move in the direction of the major averages (M criteria), yet during a confirmed rally many individual leaders generate much greater percentage gains than the major averages and index-linked ETFs. Contrasting this stock's +27.9% gain in under 5 months time, versus the S&P 500 Index's +17.8% year-to-date gain, we see a vivid example of the potential advantages investors may gain when carefully selecting individual stocks using the fact-based investment system.
It recently reported strong earnings and revenues increases for the April '13 quarter, continuing its streak of strong quarterly earnings comparisons versus the year ago periods - satisfying the C criteria with increases above the +25% minimum guideline. The high-ranked Electronics - Semiconductor firm saw the number of top-rated funds owning its shares rise from 51 in Dec '12 to 75 in Mar '13, a reassuring indication concerning the I criteria. Its current Up/Down Volume Ratio of 1.5 is also an unbiased indication that its shares have been under accumulation over the past 50 days. Its small supply (S criteria) of only 13.9 million shares in the public float can contribute to great price volatility in the event of institutional buying or selling.
Consolidating Above 50-Day Moving Average Line - Thursday, June 27, 2013
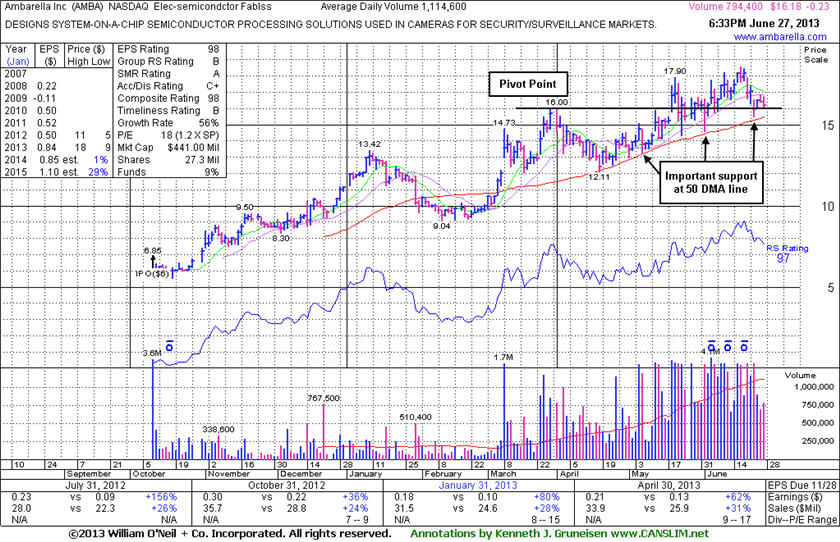
Ambarella Corporation (AMBA -$0.23 or -1.40% to $16.18) is consolidating above its 50-day moving average (DMA) line. Chart-readers recognize that short-term average as an important support level to watch where a violation would trigger a worrisome technical sell signal. In recent months it stayed above the 50 DMA line. It made little additional progress following its 6/14/13 appearance in this FSU section with an annotated graph under the headline, "Eight Consecutive Weekly Gains for Strong Leader". It touched new 52-week highs last week but encountered distributional pressure - indicated by gaps down for considerable losses on heavy volume. Keep in mind that 3 out of 4 stocks tend to move in the direction of the major averages (M criteria), so whether the market resumes a confirmed rally, or if the current "correction" continues, the broader market action can be expected to weigh heavily on the stock's ultimate performance.
It recently reported strong earnings and revenues increases for the April '13 quarter, continuing its streak of strong quarterly earnings comparisons versus the year ago periods - satisfying the C criteria with increases above the +25% minimum guideline. The high-ranked Electronics - Semiconductor firm saw the number of top-rated funds owning its shares rise from 51 in Dec '12 to 66 in Mar '13, a reassuring indication concerning the I criteria. Its current Up/Down Volume Ratio of 1.5 is also an unbiased indication that its shares have been under accumulation over the past 50 days. Its small supply (S criteria) of only 13.9 million shares in the public float can contribute to great price volatility in the event of institutional buying or selling.
Eight Consecutive Weekly Gains for Strong Leader - Friday, June 14, 2013
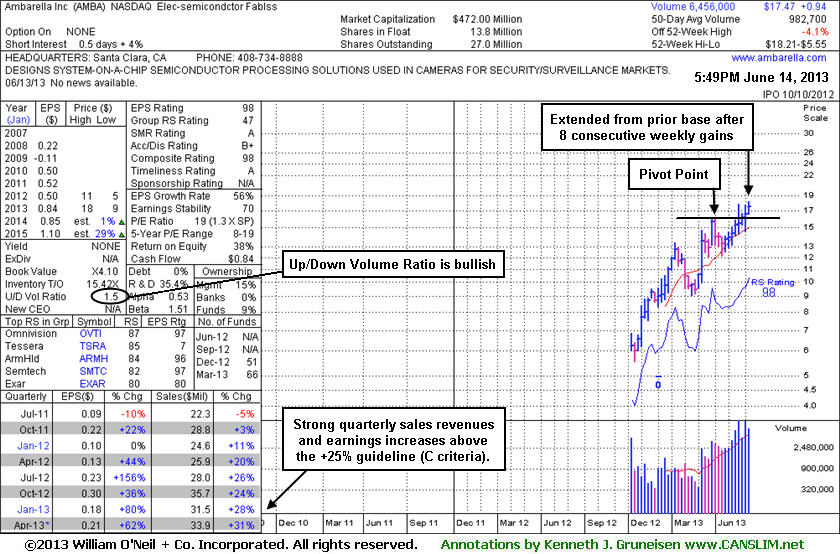
Ambarella Corporation (AMBA +$0.43 or +2.52% to $17.47) has tallied 8 consecutive weekly gains and it is extended from its prior base. It recently reported strong earnings and revenues increases for the April '13 quarter, continuing its streak of strong quarterly earnings comparisons versus the year ago periods - satisfying the C criteria with increases above the +25% minimum guideline. Recent lows and its 50-day moving average (DMA) line ($14.69 now) define important chart support to watch on pullbacks.
AMBA's last appearance in this FSU section was on 5/29/13 with an annotated graph under the headline, "Found Support Above 50-Day Moving Average After Whipsaw Action Negated Recent Breakout". Members were reminded - "A stock sold based on triggering the fact-based investment system's strict sell rules can be bought back at a later time if impressive strength returns. In fact, in the Certification it is taught that experts should buy a slightly larger dollar amount (+10% more) in the same stock if it later flashes especially bullish action. This tactic reinforces their commitment and confidence in the fact-based investment system. As always, there is a chance the stock might turn negative again, in which case the -7% sell rule may apply yet again. However, it is crucial to investors' long-term success to do a good job of limiting losses while they are small. The best approach is to never hang on for a weak stock to possibly become a -20%, -30%, -40%, or more devastating loss. In a bullish market environment, patient and disciplined investors investors can find their fair share of great winners by following the rules."
It stayed above its 50 DMA line and was noted on 6/4/2013 as it tallied a solid gain with above average volume against a mostly negative market backdrop. Then it gapped up on 6/05/13 after reporting strong earnings and revenues increases for the April '13 quarter versus the year ago period. The high-ranked Electronics - Semiconductor firm saw the number of top-rated funds owning its shares rise from 51 in Dec '12 to 66 in Mar '13, a reassuring indication concerning the I criteria. Its current Up/Down Volume Ratio of 1.5 is also an unbiased indication that its shares have been under accumulation over the past 50 days. Its small supply (S criteria) of only 13.8 million shares in the public float can contribute to great price volatility in the event of institutional buying or selling.
Found Support Above 50-Day Moving Average After Whipsaw Action Negated Recent Breakout - Wednesday, May 29, 2013
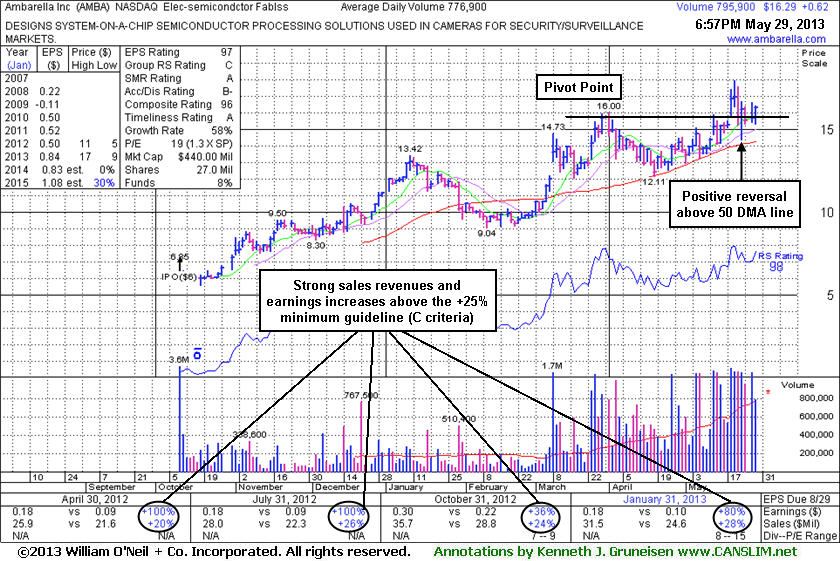
Any stock sold based on triggering the fact-based investment system's strict sell rules can be bought back at a later time if impressive strength returns. In fact, in the Certification it is taught that experts should buy a slightly larger dollar amount (+10% more) in the same stock if it later flashes especially bullish action. This tactic reinforces their commitment and confidence in the fact-based investment system. As always, there is a chance the stock might turn negative again, in which case the -7% sell rule may apply yet again. However, it is crucial to investors' long-term success to do a good job of limiting losses while they are small. The best approach is to never hang on for a weak stock to possibly become a -20%, -30%, -40%, or more devastating loss. In a bullish market environment, patient and disciplined investors investors can find their fair share of great winners by following the rules.Ambarella Corporation (AMBA +$0.62 or +3.96% to $16.29) rebounded back above its pivot point as it advanced further today with average volume behind its solid gain. It stayed well above its 50-day moving average (DMA) line ($14.25 now) and managed a "positive reversal" on Thursday, however the choppy action and Friday's weak finish below its old high close ($15.66 on 3/28/13) had raised concerns by completely negating its recent breakout. The whipsaw-like price volatility from its 5/21/13 high likely prompted disciplined investors into selling their shares after falling -7% from their purchase price. AMBA's last appearance in this FSU section was on 5/06/13 with an annotated graph under the headline, "Found Support at 50-Day Average While Forming New Base", after highlighted in the mid-day report (read here). The new pivot point cited was based on its 4/01/13 high plus 10 cents. Subsequent volume-driven gains above the pivot point triggered a new technical buy signal.
The high-ranked Electronics - Semiconductor firm reported earnings +80% on +28% sales revenues for the Jan '13 quarter. Its strong quarterly earnings comparisons versus the year ago periods satisfy the C criteria with increases above the +25% minimum guideline. It also has a good annual earnings (A criteria), however it has a limited history since its IPO at $6 on 10/10/12. The number of top-rated funds owning its shares rose from 51 in Dec '12 to 67 in Mar '13, a reassuring indication concerning the I criteria. Its current Up/Down Volume Ratio of 1.6 is also an unbiased indication that its shares have been under accumulation over the past 50 days. Its small supply (S criteria) of only 13.3 million shares in the public float can contribute to great price volatility in the event of institutional buying or selling.
Found Support at 50-Day Average While Forming New Base - Monday, May 06, 2013
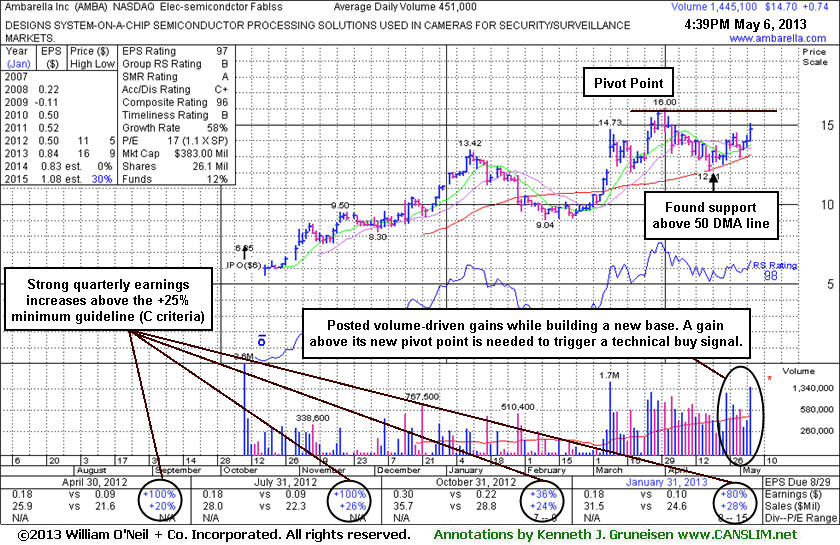
Often, when a leading stock is setting up to breakout of a solid base it is highlighted in CANSLIM.net's Mid-Day Breakouts Report. The most relevant factors are noted in the report which alerts prudent CANSLIM oriented investors to place the issue in their watch list. After doing any necessary backup research, the investor is prepared to act after the stock triggers a technical buy signal (breaks above its pivot point on more than +50% average turnover) but before it gets too extended from a sound base. In the event the stock fails to trigger a technical buy signal and its price declines then it will simply be removed from the watch list. Disciplined investors know to buy as near as possible to the pivot point and avoid chasing stocks after they have rallied more than +5% above their pivot point. It is crucial to always limit losses whenever any stock heads the wrong direction, and disciplined investors sell if a struggling stock ever falls more than -7% from their purchase price.Ambarella Corporation (AMBA +$0.74 or +5.30% to $14.70) was highlighted in yellow in the earlier mid-day report (read here) and it has returned to the Featured Stocks list. The new pivot point cited is based on its 4/01/13 high plus 10 cents. Subsequent volume-driven gains above the new pivot point may trigger a new technical buy signal. Patience may be required, as it may spend more time basing, meanwhile it faces some resistance due to overhead supply up through the $16 level. It found encouraging support at its 50-day moving average (DMA) line and flashed above average volume behind recent gains while building on a new base since dropped from the Featured Stocks list on 4/18/13. Its last appearance in this FSU section with an annotated graph was on 4/17/13 under the headline, "Encountering Distributional Pressure in Recent Weeks".
The high-ranked Electronics - Semiconductor firm reported earnings +80% on +28% sales revenues for the Jan '13 quarter. Its strong quarterly earnings comparisons versus the year ago periods satisfy the C criteria with increases above the +25% minimum guideline. It also has a good annual earnings (A criteria), however it has a limited history since its IPO at $6 on 10/10/12. The number of top-rated funds owning its shares rose from 51 in Dec '12 to 68 in Mar '13, a reassuring indication concerning the I criteria. Its current Up/Down Volume Ratio of 1.4 is also an unbiased indication that its shares have been under accumulation over the past 50 days. Its small supply (S criteria) of only 13.3 million shares in the public float can contribute to great price volatility in the event of institutional buying or selling.
Encountering Distributional Pressure in Recent Weeks - Wednesday, April 17, 2013
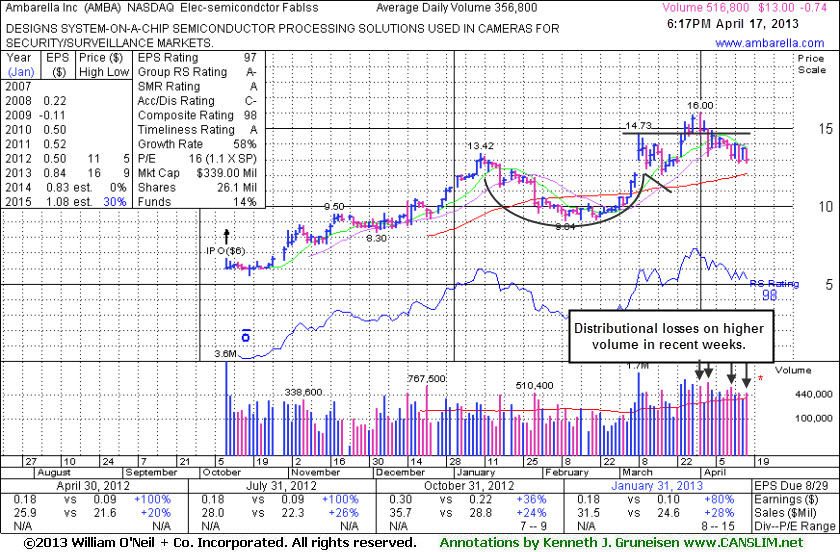
Ambarella Corporation (AMBA -$0.74 or -5.39% to $13.00) has been encountering distributional pressure in recent weeks and it is slumping toward near-term support at its 50-day moving average (DMA) line. Disciplined investors always limit losses by selling if any stock falls more than -7% from their purchase price. It was last shown in this FSU section with an annotated graph on 3/26/13 under the headline, "Volume-Driven Gain From Cup-With-High-Handle to New 52-Week High", while rallying for considerable gains with heavy volume from a cup-with-high-handle base, triggering a technical buy signal.The high-ranked Electronics - Semiconductor firm reported earnings +80% on +28% sales revenues for the Jan '13 quarter. Its strong quarterly earnings comparisons versus the year ago periods satisfy the C criteria with increases above the +25% minimum guideline. It also has a good annual earnings (A criteria), however it has a limited history since its IPO at $6 on 10/10/12. The number of top-rated funds owning its shares rose from 51 in Dec '12 to 68 in Mar '13, a reassuring indication concerning the I criteria. Its current Up/Down Volume Ratio of 1.3 is also an unbiased indication that its shares have been under accumulation over the past 50 days. Its small supply (S criteria) of only 13.3 million shares in the public float can contribute to great price volatility in the event of institutional buying or selling.
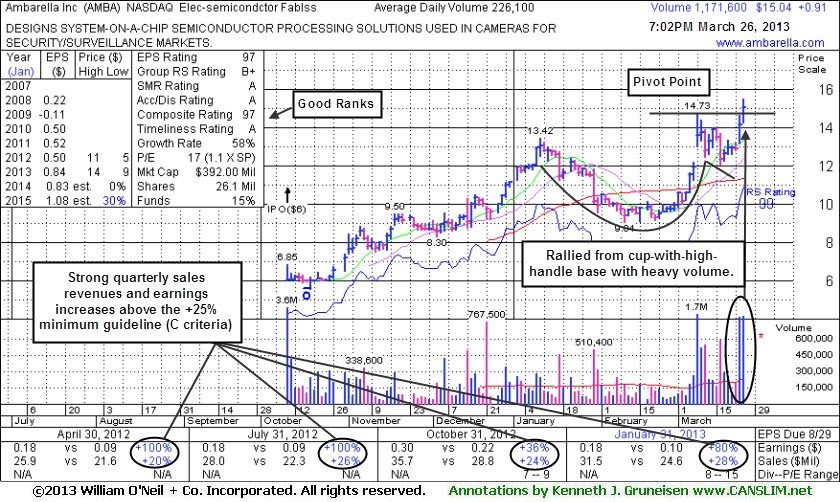
Volume-Driven Gain From Cup-With-High-Handle to New 52-Week High - Tuesday, March 26, 2013
Often, when a leading stock is breaking out of a solid base it is highlighted in CANSLIM.net's Mid-Day Breakouts Report. The most relevant factors are noted in the report which alerts prudent CANSLIM oriented investors. After doing any necessary backup research, the investor is prepared to act. Disciplined investors know to buy as near as possible to the pivot point and avoid chasing stocks after they have rallied more than +5% above their pivot point. It is crucial to always limit losses whenever any stock heads the wrong direction, and disciplined investors sell if a struggling stock ever falls more than -7% from their purchase price.
Ambarella Corporation (AMBA +$0.91 +6.44% to $15.04) was higlighted in yellow with pivot point based on its 3/08/13 high plus 10 cents in the earlier mid-day report (read
here). It gapped up today for a 2nd consecutive session while rallying for considerable gains with heavy volume. It hit a new 52 week high and rose from a cup-with-high-handle base triggering a technical buy signal. Disciplined investors avoid chasing stocks more than +5% above their pivot point and they limit losses by selling if ever any stock falls more than -7% from their purchase price.The high-ranked Electronics - Semiconductor firm reported earnings +80% on +28% sales revenues for the Jan '13 quarter. Its strong quarterly earnings comparisons versus the year ago periods satisfy the C criteria with increases above the +25% minimum guideline. It also has a good annual earnings (A criteria), however it has a limited history since its IPO at $6 on 10/10/12. The number of top-rated funds owning its shares rose from N/A in prior quarters to 51 as of Dec '12, a reassuring indication concerning the I criteria. Its current Up/Down Volume Ratio of 1.4 is also an unbiased indication that its shares have been under accumulation over the past 50 days. Its small supply (S criteria) of only 13.3 million shares in the public float can contribute to great price volatility in the event of institutional buying or selling.
