Finding Support Near 50-Day Moving Average Line - Wednesday, July 02, 2014
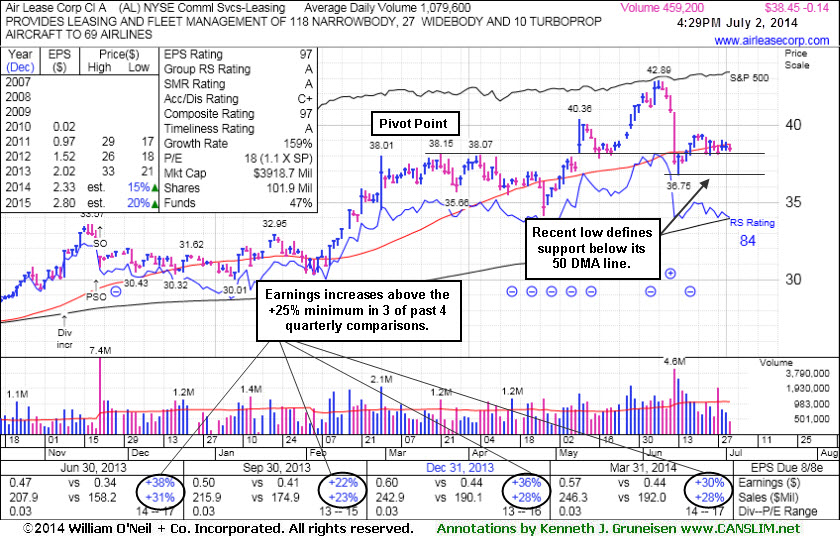
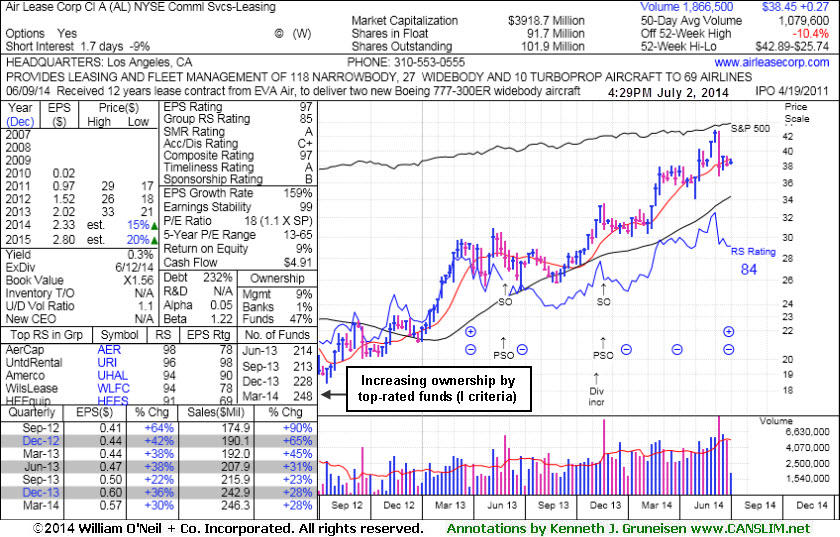
Air Lease Corp (AL -$0.14 or -0.36% to $38.45) is consolidating near its 50-day moving average (DMA) line ($38.76). A subsequent violation of its recent low ($36.55 on 6/13/17) would raise more serious concerns and trigger a worrisome technical sell signal. After last shown in this FSU section on 6/11/14 with an annotated graph under the headline, "Enduring Mild Distributional Pressure on Pullback", it pulled back with higher volume indicative of heavy distributional pressure. Disciplined investors limit losses by always selling if any stock falls more than -7% from their purchase price.
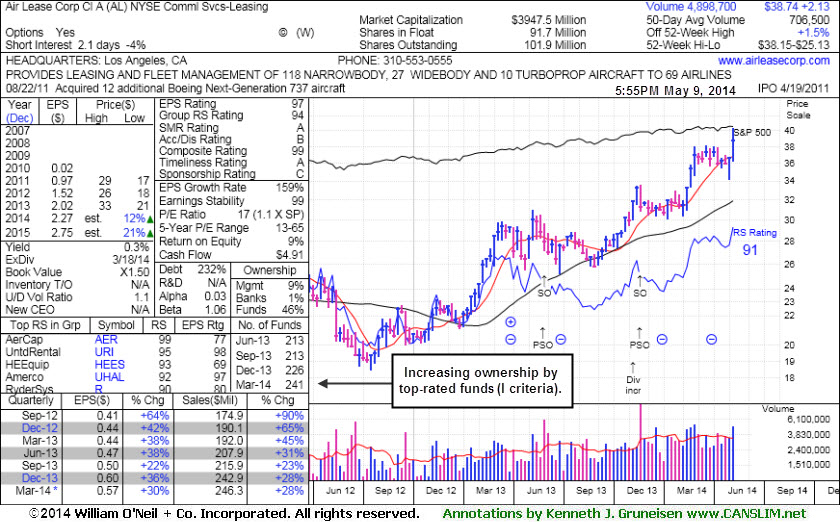
Its earnings Per Share Rank is 97, well above the 80+ minimum for buy candidates. Its Relative Strength Rating of 84 is above the 80+ minimum guideline. The Commercial Services - Leasing firm was highlighted in yellow with pivot point based on its 3/21/14 high plus 10 cents in the 5/09/14 mid-day report (read here) when its gain backed by +119% above average volume clinched a convincing technical buy signal.
It reported earnings +30% on +28% sales revenues for the Mar '14 quarter, and 3 of the past 4 quarterly comparisons showed earnings increases above the +25% minimum guideline (C criteria). It completed a Secondary Offering on 11/21/13 and an earlier Secondary Offering on 5/31/13. The Commercial Services - Leasing firm has seen the number of top-rated funds owning its shares rise from 177 in Sep '12 to 248 in Mar '14, which is reassuring concerning the I criteria.
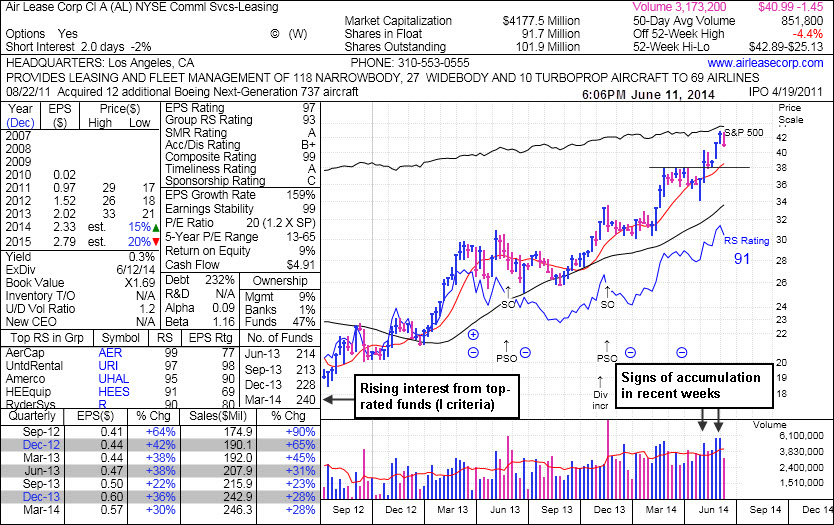
Enduring Mild Distributional Pressure on Pullback - Wednesday, June 11, 2014
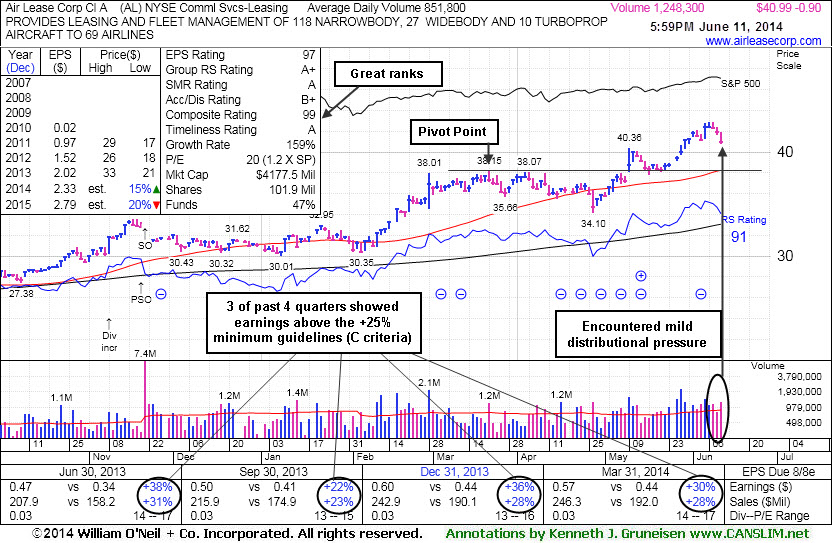
Air Lease Corp (AL -$0.90 or -2.15% to $40.99) pulled back with higher volume indicative of mild distributional pressure while retreating from a new 52-week high following volume-driven gains. Prior highs near $40 define near-term support to watch on pullbacks. Disciplined investors limit losses by always selling if any stock falls more than -7% from their purchase price.
Its earnings Per Share Rank is 97, well above the 80+ minimum for buy candidates. Its Relative Strength Rating of 91 is above the 80+ minimum guideline. AL was last shown in this FSU section on 5/28/14 with an annotated graph under the headline, "Finished Near Session Low and Below 'Max Buy' Level After Gain on Volume", as it gapped up and hit a new 52-week high with 3 times average volume behind its gain. The Commercial Services - Leasing firm was highlighted in yellow with pivot point based on its 3/21/14 high plus 10 cents in the 5/09/14 mid-day report (read here) when its gain backed by +119% above average volume clinched a convincing technical buy signal.
It reported earnings +30% on +28% sales revenues for the Mar '14 quarter, and 3 of the past 4 quarterly comparisons showed earnings increases above the +25% minimum guideline (C criteria). It completed a Secondary Offering on 11/21/13 and an earlier Secondary Offering on 5/31/13. The Commercial Services - Leasing firm has seen the number of top-rated funds owning its shares rise from 177 in Sep '12 to 240 in Mar '14, which is reassuring concerning the I criteria.
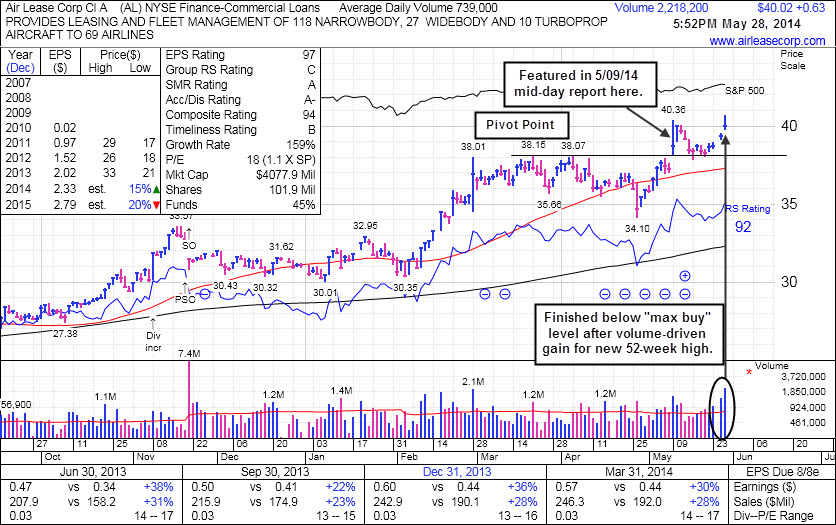
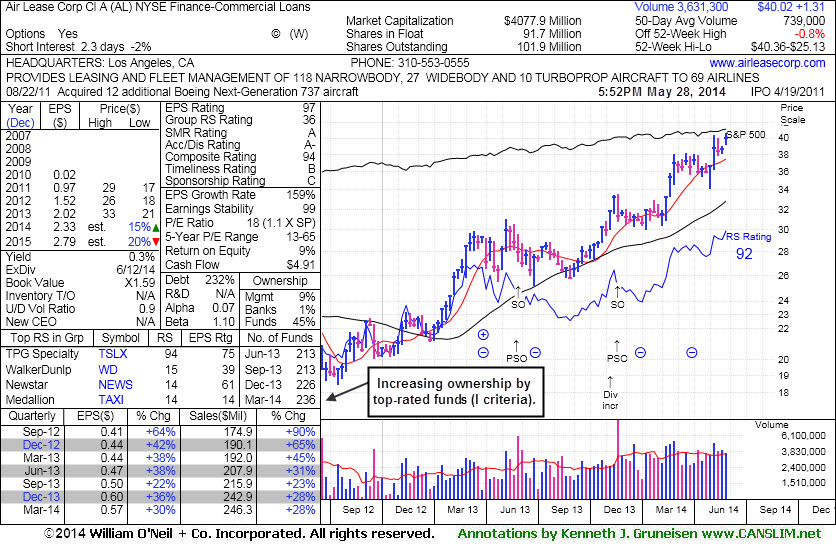
Finished Near Session Low and Below "Max Buy" Level After Gain on Volume - Wednesday, May 28, 2014
Air Lease Corp (AL +$0.63 or +1.60% to $40.02) gapped up today and hit a new 52-week high with 3 times average volume behind its gain, however it appears to have encountered some distributional pressure as it finished near the session low after slumping back below its "max buy" level. It was highlighted in yellow with pivot point based on its 3/21/14 high plus 10 cents in the 5/09/14 mid-day report (read here) when its gain backed by +119% above average volume clinched a convincing technical buy signal. Disciplined investors always avoid chasing stocks more than +5% above their pivot point and always limit losses by selling if any stock falls more than -7% from their purchase price.It reported earnings +30% on +28% sales revenues for the Mar '14 quarter, and 3 of the past 4 quarterly comparisons showed earnings increases above the +25% minimum guideline (C criteria). It completed a Secondary Offering on 11/21/13 and an earlier Secondary Offering on 5/31/13. The Commercial Services - Leasing firm has seen the number of top-rated funds owning its shares rise from 177 in Sep '12 to 236 in Mar '14, which is reassuring concerning the I criteria.
Its earnings Per Share Rank is 97, well above the 80+ minimum for buy candidates. Its Relative Strength Rating of 92 is above the 80+ minimum guideline. Those ratings had slumped below the minimum threshold when AL was shown in this FSU section on 6/17/13 with an annotated graph under the headline, "Faltering Fundamental and Technical Characteristics Raise Concerns".
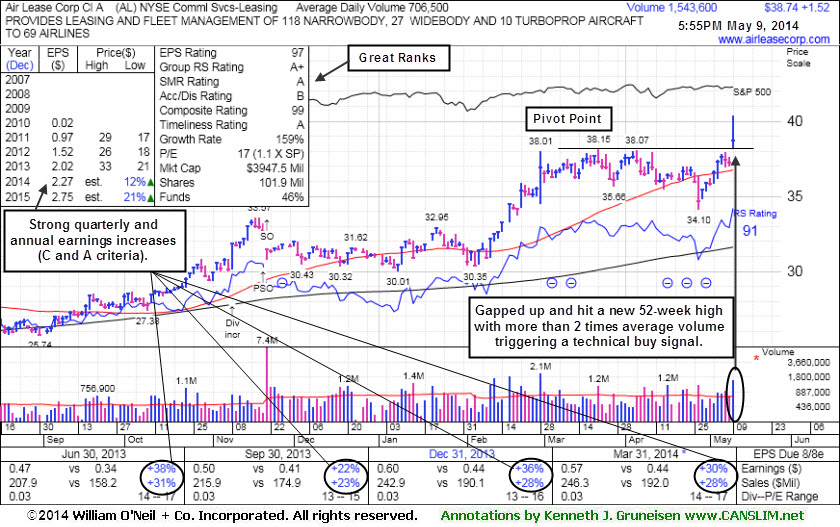
Volume Heavy Following Gap Up Gain for New 52-Week High - Friday, May 09, 2014
Air Lease Corp (AL +$1.52 or +4.08% to $38.74) was highlighted in yellow with pivot point based on its 3/21/14 high plus 10 cents in the earlier mid-day report (read here). It gapped up and hit a new 52-week high, and its strong finish backed by +119% above average volume clinched a convincing technical buy signal. Disciplined investors always avoid chasing stocks more than +5% above their pivot point and always limit losses by selling if any stock falls more than -7% from their purchase price.
It reported earnings +30% on +28% sales revenues for the Mar '14 quarter, and 3 of the past 4 quarterly comparisons showed earnings increases above the +25% minimum guideline (C criteria). Since dropped from the Featured Stocks list.and noted with caution on 6/21/13 it found support near its 200-day moving average (DMA) line then rallied to new highs. It completed a Secondary Offering on 11/21/13 and an earlier Secondary Offering on 5/31/13. The Commercial Services - Leasing firm has seen the number of top-rated funds owning its shares rise from 177 in Sep '12 to 241 in Mar '14, which is reassuring concerning the I criteria.
Its earnings Per Share Rank is 97, well above the 80+ minimum for buy candidates. Its Relative Strength Rating of 91 is above the 80+ minimum guideline. Those ratings had slumped below the minimum threshold when AL was last shown in this FSU section on 6/17/13 with an annotated graph under the headline, "Faltering Fundamental and Technical Characteristics Raise Concerns".
Faltering Fundamental and Technical Characteristics Raise Concerns - Monday, June 17, 2013
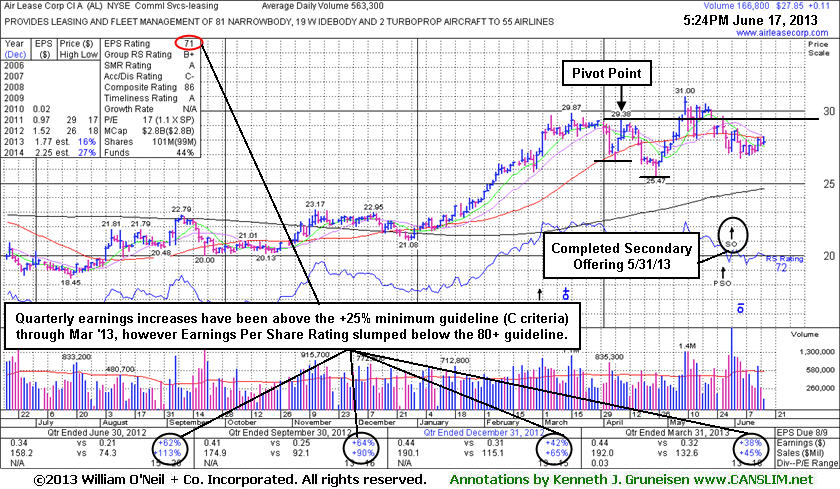
Air Lease Corp (AL +$0.11 or +0.40% to $27.85) is still consolidating below its 50-day moving average (DMA) line which may continue to act as resistance. Gains above that short-term average are needed for it to improve its technical stance and help its near-term outlook. It completed a Secondary Offering on 5/31/13. The company reported earnings +38% on +45% sales revenues for the quarter ended March 31, 2013 versus the year ago period. The result was below analysts' estimates yet well above the +25% minimum earnings guideline (C criteria). However, its earnings Per Share Rank has subsequently fallen from 84 to 71, below the 80+ minimum for buy candidates (see red circle). Its Relative Strength Rating has also slumped below the 80+ minimum guideline to 72. Decelerating sales revenues and earnings increases in sequential quarterly comparisons through Dec '12 were noted as cause for some concern, and the Mar '13 comparison continued that worrisome trend.
It is still a fairly good match with the fact-based investment system's fundamental guidelines (C and A criteria), however it would be more ideal for a company to show sales and earnings acceleration. Couple the fundamental concerns with its technical weakness and it gets harder to argue for giving the Commercial Services - Leasing firm much latitude. Disciplined investors always limit losses if any stock falls -7% from their purchase price.
The number of top-rated funds owning its shares edged higher from 177 in Sep '12 to 187 in Mar '13 which is slightly reassuring concerning the I criteria. AL was last shown in this FSU section on 5/30/13 with an annotated graph under the headline, "Weak Technical Action Triggered Sell Signal", after it violated important support at its 50-day moving average (DMA) line with volume-driven losses which raised concerns and triggered a technical sell signal.
Weak Technical Action Triggered Sell Signal - Thursday, May 30, 2013
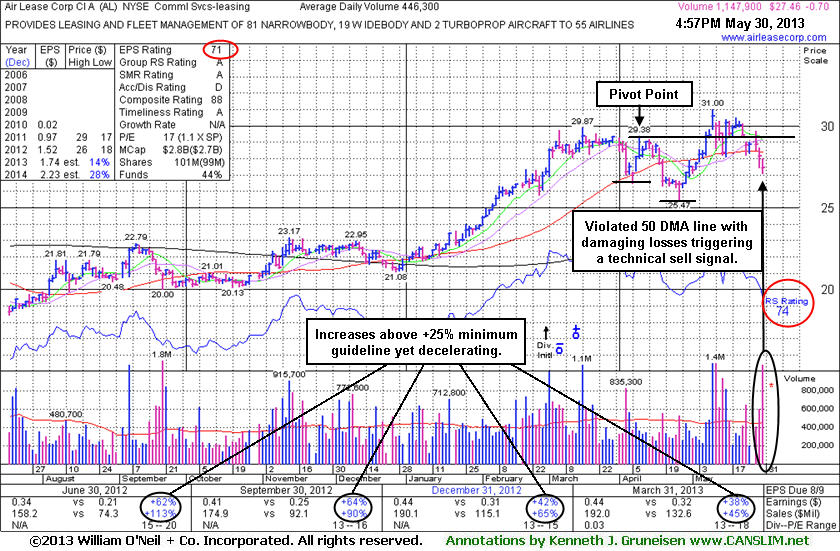
Air Lease Corp (AL -$0.70 or -2.49% to $27.46) recently violated important support at its 50-day moving average (DMA) line with volume-driven losses which raised concerns and triggered a technical sell signal. Only a prompt rebound above its 50 DMA would help its outlook improve.It was last shown in this FSU section on 5/09/13 with an annotated graph under the headline, "Trading Lower After Hours Following Earnings Announcement", after highlighted in yellow with a pivot point based on its 4/09/13 high while rallying from a "double bottom" base in the earlier mid-day report (read here). Its strong finish for a 6th consecutive gain had clinched a technical buy signal, however, members were cautioned - "Volume and volatility often increase near earnings news." After the close it reported earnings +38% on +45% sales revenues for the quarter ended March 31, 2013 versus the year ago period. The result was below analysts' estimates yet well above the +25% minimum earnings guideline (C criteria). However, its earnings Per Share Rank has subsequently fallen from 84 to 71, below the 80+ minimum for buy candidates. Its Relative Strength Rating has also slumped below the 80+ minimum guideline to 74 (see red circles).
Decelerating sales revenues and earnings increases in sequential quarterly comparisons through Dec '12 were noted as cause for some concern, and the Mar '13 comparison continued that worrisome trend. It is still a fairly good match with the fact-based investment system's fundamental guidelines (C and A criteria), however it would be more ideal for a company to show sales and earnings acceleration. The number of top-rated funds owning its shares edged higher from 177 in Sep '12 to 184 in Mar '13 which is reassuring concerning the I criteria.
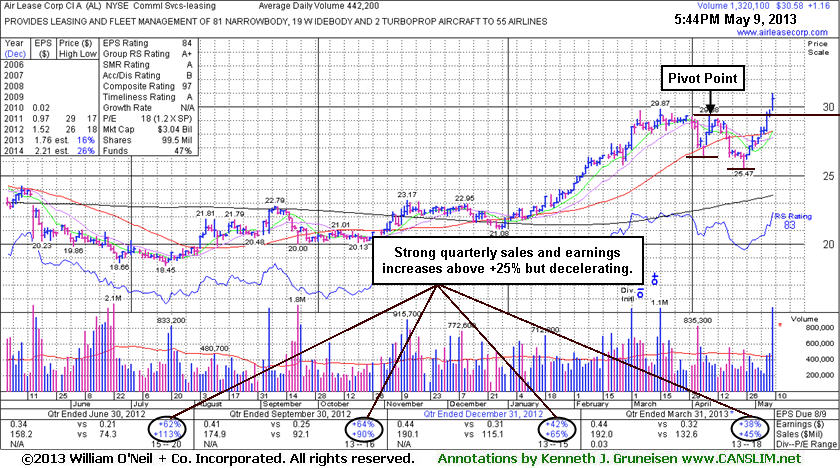
Trading Lower After Hours Following Earnings Announcement - Thursday, May 09, 2013
Often, when a leading stock is setting up to breakout of a solid base it is highlighted in CANSLIM.net's Mid-Day Breakouts Report. The most relevant factors are noted in the report which alerts prudent CANSLIM oriented investors to place the issue in their watch list. After doing any necessary backup research, the investor is prepared to act after the stock triggers a technical buy signal (breaks above its pivot point on more than +50% average turnover) but before it gets too extended from a sound base. In the event the stock fails to trigger a technical buy signal and its price declines then it will simply be removed from the watch list. Disciplined investors know to buy as near as possible to the pivot point and avoid chasing stocks after they have rallied more than +5% above their pivot point. It is crucial to always limit losses whenever any stock heads the wrong direction, and disciplined investors sell if a struggling stock ever falls more than -7% from their purchase price.Air Lease Corp (AL +$1.16 or +3.94% to $30.58) was highlighted in yellow with a pivot point based on its 4/09/13 high while rallying from a "double bottom" base to a new 52-week high with above average volume in the earlier mid-day report (read here). Its strong finish for a 6th consecutive gain clinched a technical buy signal, however, members were cautioned - "Volume and volatility often increase near earnings news." After the close it reported earnings +38% on +45% sales revenues for the quarter ended March 31, 2013 versus the year ago period. The result was well above the +25% minimum earnings guideline (C criteria), however it missed analysts' consensus estimates, and the shares traded much lower in the after-hours.
AL undercut the 50-day moving average (DMA) line during its consolidation since noted with caution in the 4/04/13 mid-day report following a volume-driven loss. It found support near prior highs in the $26 area. Recently it had tallied 11 consecutive weekly gains. Decelerating sales revenues and earnings increases in sequential quarterly comparisons through Dec '12 were noted as cause for some concern.
Fundamentals are still strong enough that its earnings history is a good match with the fact-based investment system's fundamental guidelines (C and A criteria). The number of top-rated funds owning its shares rose from 177 in Sep '12 to 192 in Mar '13 which is reassuring concerning the I criteria. Its Up/Down Volume Ratio of 1.4 is also an unbiased indication that its shares have been under accumulation over the past 50 days.