Damaging Volume-Driven Loss Triggered Technical Sell Signal - Monday, September 28, 2015
Found Support Above 50-Day Moving Average - Monday, September 14, 2015
Finding Support Above 50-Day Average and Prior Highs - Friday, September 4, 2015
Testing Support Amid Broad Market Weakness - Tuesday, August 25, 2015
Gap Up Gain Triggered Technical Buy Signal Following Earnings - Wednesday, August 5, 2015
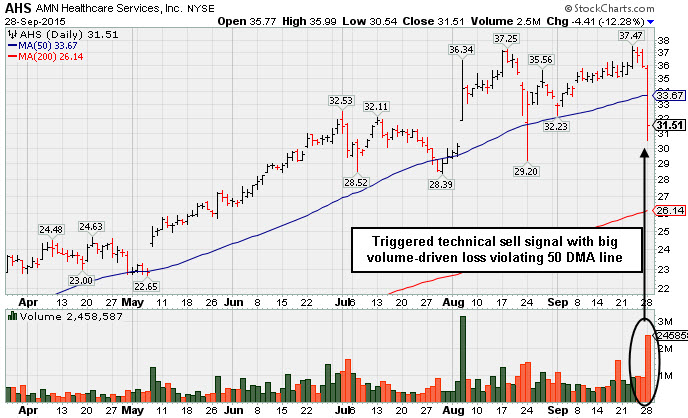
Damaging Volume-Driven Loss Triggered Technical Sell Signal - Monday, September 28, 2015
A M N Healthcare Svcs (AHS -$4.41 or -12.28% to $31.51) raised concerns and triggered a technical sell signal while violating its 50-day moving average (DMA) line with above average volume behind today's big loss, its 3rd consecutive loss. Only a prompt rebound above the 50 DMA line would help its outlook improve.
AHS was last shown in this FSU section on 9/14/15 with an annotated graph under the headline, "Found Support Above 50-Day Moving Average", perched within striking distance of its 52-week high. Members were reminded - "Damaging losses would raise greater concerns, especially if slumping to a close back in the prior base."
AHS was highlighted in yellow with new pivot point based on its 7/01/15 high plus 10 cents in the 8/05/15 mid-day report (read here). It reported earnings +80% on +40% sales revenues for the Jun '15 quarter, its 3rd consecutive quarterly comparison with earnings above the 25% minimum guideline (C criteria), helping it better match the fact-based investment system's winning models. Sequentially, its quarterly comparisons have shown encouraging acceleration as earnings rose +35%, +67%, and +81% on the Dec '14, Mar and Jun '15 periods, respectively. Sales revenues rose +12%, +36%, and +40% over that same span.
The number of top-rated funds owning its shares rose from 282 in Sep '14 to 338 in Jun '15, a reassuring sign concerning the I criteria. Its current Up/Down Volume Ratio of 1.1 is an unbiased indication its shares have been under slight accumulation over the past 50 days. It currently has a Timeliness Rating of A and a Sponsorship Rating of B. Its small supply of only 47.7 million shares outstanding (S criteria) can contribute to greater volatility in the event of institutional buying or selling.
Found Support Above 50-Day Moving Average - Monday, September 14, 2015
A M N Healthcare Svcs (AHS -$0.24 or -0.68% to $34.98) is perched within striking distance of its 52-week high, consolidating above its 50-day moving average (DMA) line and prior highs defining important near term support. AHS was last shown in this FSU section on 9/04/15 with an annotated graph under the headline, " Finding Support Above 50-Day Average and Prior Highs". Damaging losses would raise greater concerns, especially if slumping to a close back in the prior base.
AHS was highlighted in yellow with new pivot point based on its 7/01/15 high plus 10 cents in the 8/05/15 mid-day report (read here). It reported earnings +80% on +40% sales revenues for the Jun '15 quarter, its 3rd consecutive quarterly comparison with earnings above the 25% minimum guideline (C criteria), helping it better match the fact-based investment system's winning models. Sequentially, its quarterly comparisons have shown encouraging acceleration as earnings rose +35%, +67%, and +81% on the Dec '14, Mar and Jun '15 periods, respectively. Sales revenues rose +12%, +36%, and +40% over that same span.
The number of top-rated funds owning its shares rose from 282 in Sep '14 to 339 in Jun '15, a reassuring sign concerning the I criteria. Its current Up/Down Volume Ratio of 1.1 is an unbiased indication its shares have been under slight accumulation over the past 50 days. It currently has a Timeliness Rating of A and a Sponsorship Rating of B. Its small supply of only 47.7 million shares outstanding (S criteria) can contribute to greater volatility in the event of institutional buying or selling.
Finding Support Above 50-Day Average and Prior Highs - Friday, September 4, 2015
A M N Healthcare Svcs (AHS -$0.03 or -0.09% to $34.21) is still consolidating above its 50-day moving average (DMA) line ($32.30) and prior highs defining near-term support. More damaging losses would raise greater concerns, especially if slumping to a close back in the prior base. AHS was last shown in this FSU section on 8/25/15 with an annotated graph under the headline, "Testing Support Amid Broad Market Weakness". Keep in mind that 3 out of 4 stocks usually move in the same direction as the major averages (M criteria), and recent weakness has raised serious concerns.
AHS was highlighted in yellow with new pivot point based on its 7/01/15 high plus 10 cents in the 8/05/15 mid-day report (read here). It reported earnings +80% on +40% sales revenues for the Jun '15 quarter, its 3rd consecutive quarterly comparison with earnings above the 25% minimum guideline (C criteria), helping it better match the fact-based investment system's winning models. Sequentially, its quarterly comparisons have shown encouraging acceleration as earnings rose +35%, +67%, and +81% on the Dec '14, Mar and Jun '15 periods, respectively. Sales revenues rose +12%, +36%, and +40% over that same span.
The number of top-rated funds owning its shares rose from 282 in Sep '14 to 327 in Jun '15, a reassuring sign concerning the I criteria. Its current Up/Down Volume Ratio of 1.2 is an unbiased indication its shares have been under slight accumulation over the past 50 days. It currently has a Timeliness Rating of A and a Sponsorship Rating of B. Its small supply of only 47.7 million shares outstanding (S criteria) can contribute to greater volatility in the event of institutional buying or selling.
Testing Support Amid Broad Market Weakness - Tuesday, August 25, 2015
A M N Healthcare Svcs (AHS +$0.09 or +0.27% to $33.14) appears to be finding support following damaging losses testing prior highs and its 50-day moving average (DMA) line. More damaging losses would raise greater concerns and trigger technical sell signals. Keep in mind that 3 out of 4 stocks usually move in the same direction as the major averages (M criteria), and recent weakness has raised serious concerns.
AHS was last shown in this FSU section on 8/05/15 with an annotated graphs under the headline, "Gap Up Gain Triggered Technical Buy Signal Following Earnings", after highlighted in yellow with new pivot point based on its 7/01/15 high plus 10 cents in the earlier mid-day report (read here). It reported earnings +80% on +40% sales revenues for the Jun '15 quarter, its 3rd consecutive quarterly comparison with earnings above the 25% minimum guideline (C criteria), helping it better match the fact-based investment system's winning models. Sequentially, its quarterly comparisons have shown encouraging acceleration as earnings rose +35%, +67%, and +81% on the Dec '14, Mar and Jun '15 periods, respectively. Sales revenues rose +12%, +36%, and +40% over that same span.
The number of top-rated funds owning its shares rose from 282 in Sep '14 to 314 in Jun '15, a reassuring sign concerning the I criteria. . Its small supply of only 47.6 million shares outstanding (S criteria) con contribute to greater volatility in the event of institutional buying or selling.
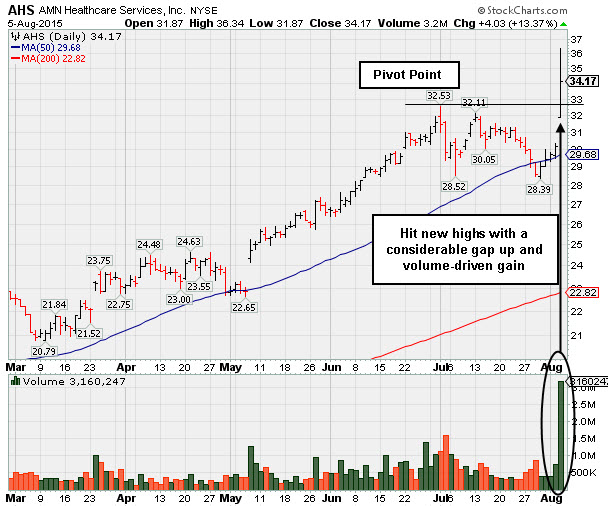
Gap Up Gain Triggered Technical Buy Signal Following Earnings - Wednesday, August 5, 2015
A M N Healthcare Svcs (AHS +$4.03 or +13.37% to $34.17) was highlighted in yellow with new pivot point based on its 7/01/15 high plus 10 cents in the earlier mid-day report (read here). Hitting a new 52-week high with a "breakaway gap" today, it triggered a technical buy signal as it rallied with heavy volume from a 5-week flat base during which it found support at its 50-day moving average (DMA) line.
It reported earnings +80% on +40% sales revenues for the Jun '15 quarter, its 3rd consecutive quarterly comparison with earnings above the 25% minimum guideline (C criteria), helping it better match the fact-based investment system's winning models. Sequentially, its quarterly comparisons have shown encouraging acceleration as earnings rose +35%, +67%, and +81% on the Dec '14, Mar and Jun '15 periods, respectively. Sales revenues rose +12%, +36%, and +40% over that same span.
The number of top-rated funds owning its shares rose from 282 in Sep '14 to 314 in Jun '15, a reassuring sign concerning the I criteria. Its current Up/Down Volume ratio of 1.5 is also an unbiased indication its shares have been under accumulation over the past 50 days. Its small supply of only 47.6 million shares outstanding (S criteria) con contribute to greater volatility in the event of institutional buying or selling.
AHS has a Timeliness rating of A and Sponsorship Rating of B. The Commercial Services - Staffing industry group has a mediocre Group Relative Strength rating of 52, however leadership from a few staffing firms is a reassuring sign concerning the L criteria.
Charts courtesy www.stockcharts.com


