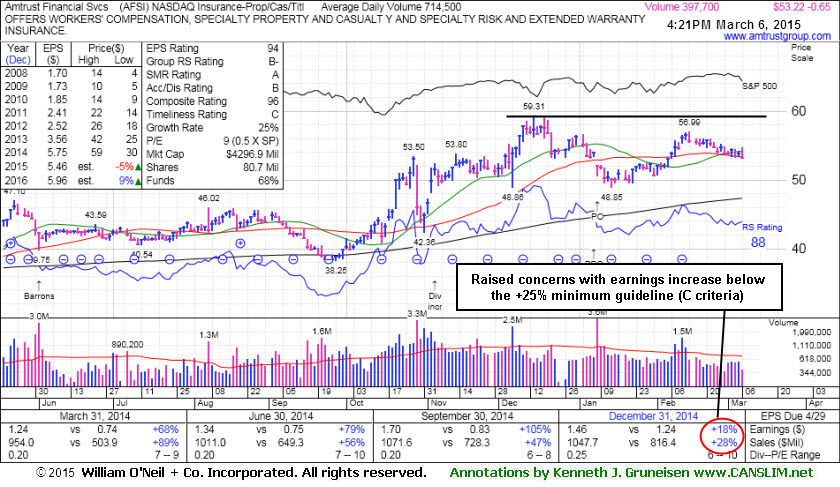
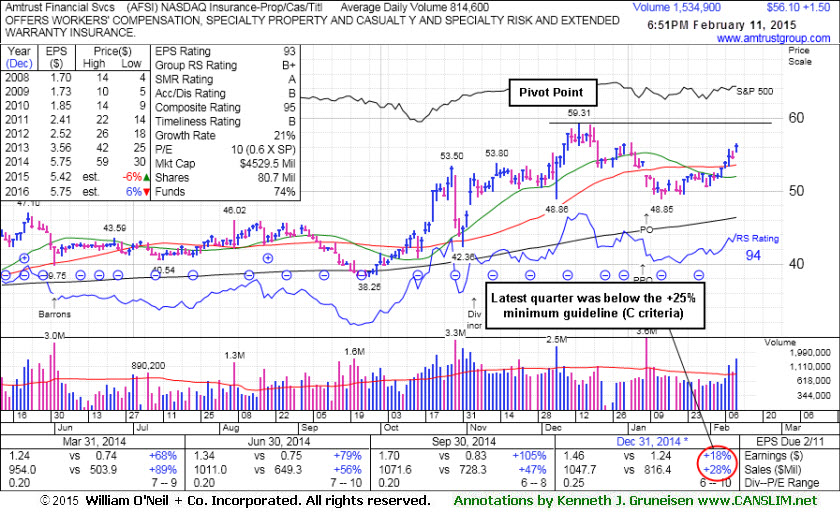
Amtrust Financial Services' (AFSI -$0.56 or -1.04% to $53.31) is consolidating near its 50-day moving average (DMA) line with volume totals cooling. Fundamental concerns were raised by earnings for the Dec '14 quarter reported below the +25% minimum guideline (C criteria). It will be dropped from the Featured Stocks list tonight. AFSI was last shown in this FSU section on 2/11/15 with annotated graphs under the headline, "Financial Firms Dec '14 Earnings Raised Fundamental Concerns", after highlighted in yellow in the earlier mid-day report (read here). Members were cautioned - "Disciplined investors might sooner take interest in another fresh buy candidate - one actually breaking out and without any fundamental flaws. It reported better than expected earnings - but a closer look at the freshly reported Dec '14 quarter shows its earnings rose +18% on +28% sales revenues versus the year ago period. That broke the prior streak of 9 consecutive comparisons above the +25% minimum earnings guideline (C criteria), a fundamental flaw difficult to ignore."
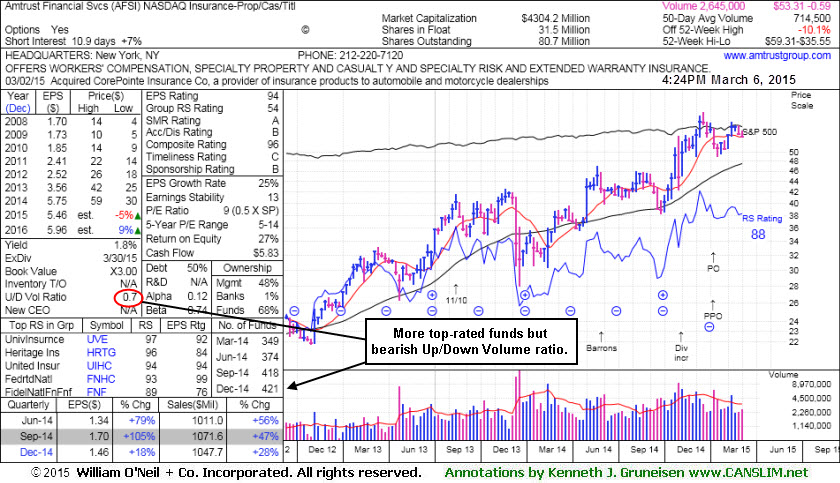
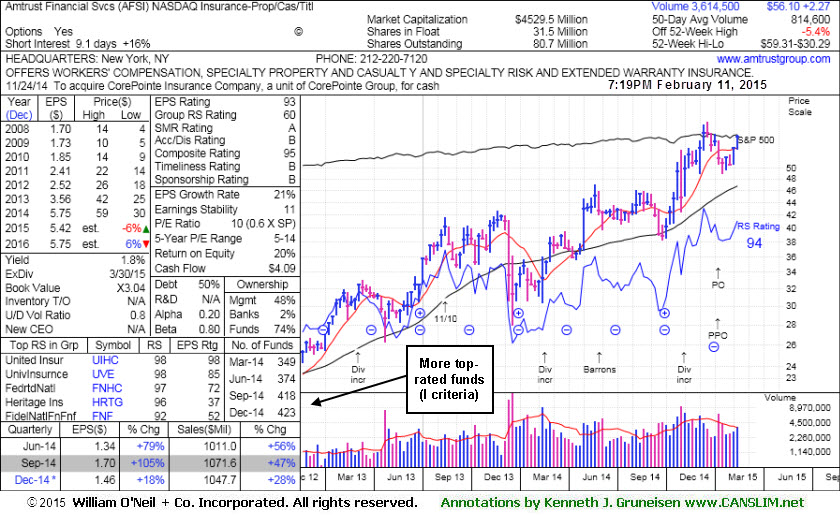
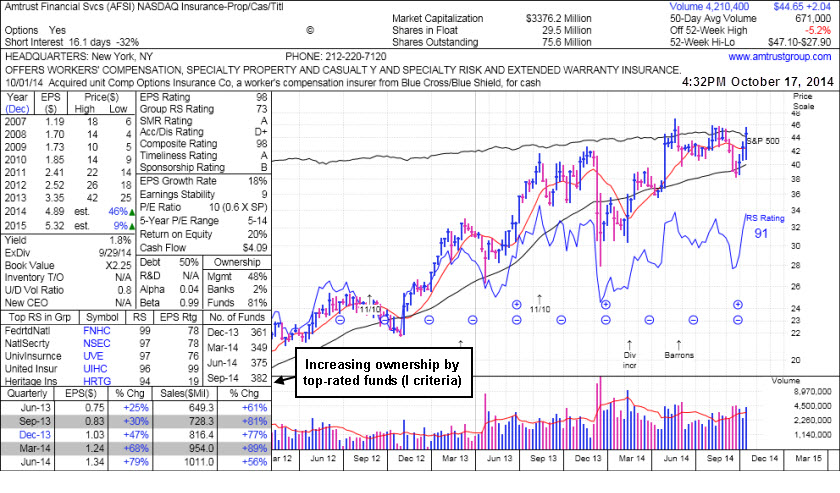
The high-ranked Insurance - Property/Casualty/Title firm completed a new Public Offering on 1/08/15. With the help of underwriters, companies often attract additional institutional buying support with such offerings. The number of top-rated funds owning an interest rose from 349 in Mar '14 to 421 in Dec '14, already a reassuring trend (I criteria). It has a great annual earnings (A criteria) history and it has a 94 Earnings Per Share rating, well above the 80+ minimum rating for buy candidates. Its Relative Strength Rating is currently 88, above the 80+ minimum guideline for buy candidates.
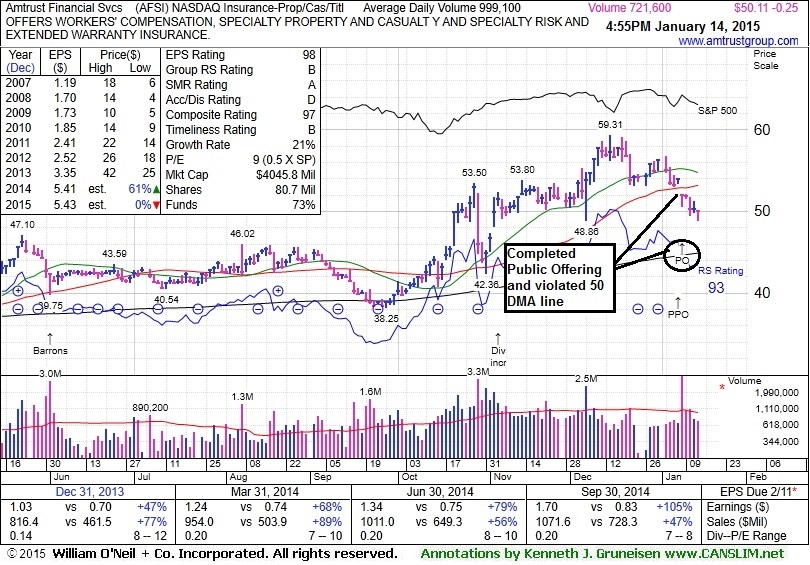
Amtrust Financial Services' (AFSI -$0.25 or -0.50% to $50.11) was highlighted in yellow in the earlier mid-day report (read here) while working on the right side of a 9-week cup shaped base. Recent volume-driven gain above its 50 DMA line helped its technical stance and outlook improve, and it was noted that - "Subsequent volume-driven gains for new highs may trigger a new technical buy signal". However, fundamental concerns were raised by raised by today's earnings report.
Disciplined investors might sooner take interest in another fresh buy candidate - one actually breaking out and without any fundamental flaws. It reported better than expected earnings - but a closer look at the freshly reported Dec '14 quarter shows its earnings rose +18% on +28% sales revenues versus the year ago period. That broke the prior streak of 9 consecutive comparisons above the +25% minimum earnings guideline (C criteria), a fundamental flaw difficult to ignore. AFSI was last shown in this FSU section on 1/14/15 with annotated graphs under the headline, "Trading Below 50-Day Moving Average Line Hurts Outlook". It has been rebounding since dropped from the Featured Stocks list on 1/16/15.
The high-ranked Insurance - Property/Casualty/Title firm completed a new Public Offering on 1/08/15. With the help of underwriters, companies often attract additional institutional buying support with such offerings. The number of top-rated funds owning an interest rose from 349 in Mar '14 to 423 in Dec '14, already a reassuring trend (I criteria). It has a great annual earnings (A criteria) history and it has a 93 Earnings Per Share rating, well above the 80+ minimum rating for buy candidates. Its Relative Strength Rating is currently 94, above the 80+ minimum guideline for buy candidates.
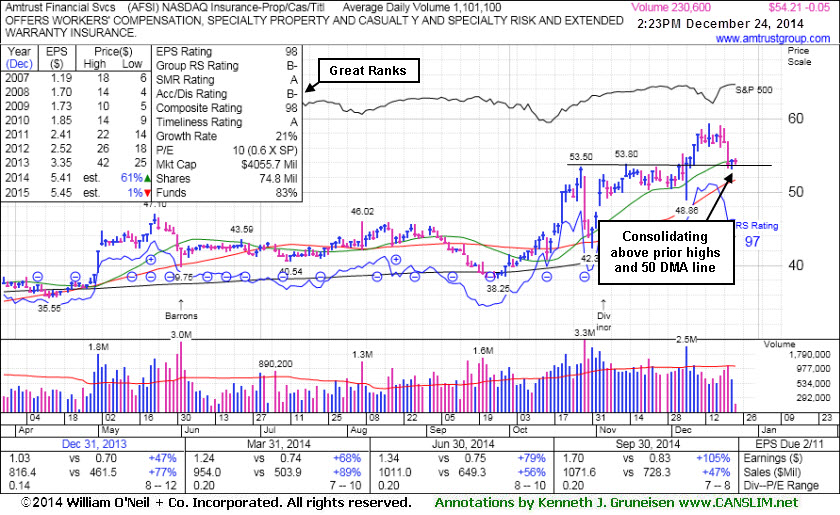
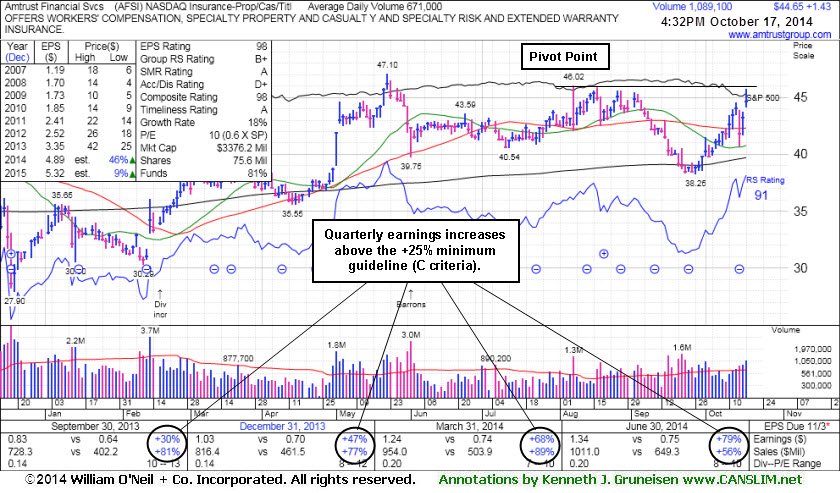
The high-ranked Insurance - Property/Casualty/Title firm was last shown in this FSU section on 12/24/14 with annotated graphs under the headline, "Extended From Sound Base Pattern Identified Earlier". AFSI was highlighted in yellow with new pivot point cited based on its 8/07/14 high in the 10/17/14 mid-day report (read here) and subsequent volume-driven gains above the pivot point triggered a technical buy signal.
The number of top-rated funds owning an interest rose from 349 in Mar '14 to 414 in Dec '14, a reassuring sign concerning the I criteria. It reported earnings +105% on +47% sales revenues for the quarter ended Sep '14 quarter versus the year ago period, its 9th consecutive comparison above the +25% minimum earnings guideline (C criteria). It has a great annual earnings (A criteria) history and it has earned an impressive 98 Earnings Per Share rating, well above the 80+ minimum rating for buy candidates. Its Relative Strength Rating is currently 93, above the 80+ minimum guideline for buy candidates.
Amtrust Financial Services' (AFSI -$0.05 or -0.09% to $54.21) is consolidating near prior highs in the $53 area defining initial support above its 50-day moving average (DMA) line ($51.63). The high-ranked Insurance - Property/Casualty/Title firm was last shown in this FSU section on 12/24/14 with annotated graphs under the headline, "Extended From Sound Base Pattern Identified Earlier". It faces no resistance due to overhead supply. AFSI was highlighted in yellow with new pivot point cited based on its 8/07/14 high in the 10/17/14 mid-day report (read here) and subsequent volume-driven gains above the pivot point triggered a technical buy signal.
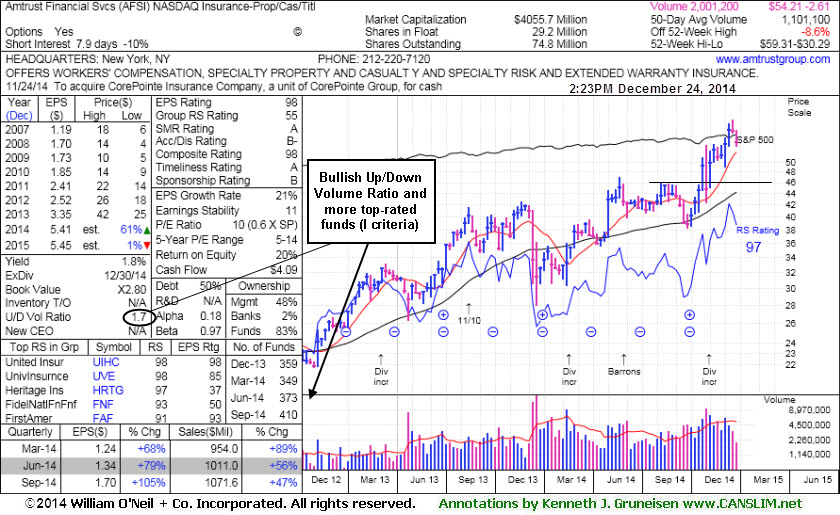
The number of top-rated funds owning an interest rose from 349 in Mar '14 to 410 in Sep '14, a reassuring sign concerning the I criteria. It reported earnings +105% on +47% sales revenues for the quarter ended Sep '14 quarter versus the year ago period, its 9th consecutive comparison above the +25% minimum earnings guideline (C criteria). It has a great annual earnings (A criteria) history and it has earned an impressive 98 Earnings Per Share rating, well above the 80+ minimum rating for buy candidates. Its Relative Strength Rating is currently 97, above the 80+ minimum guideline for buy candidates.
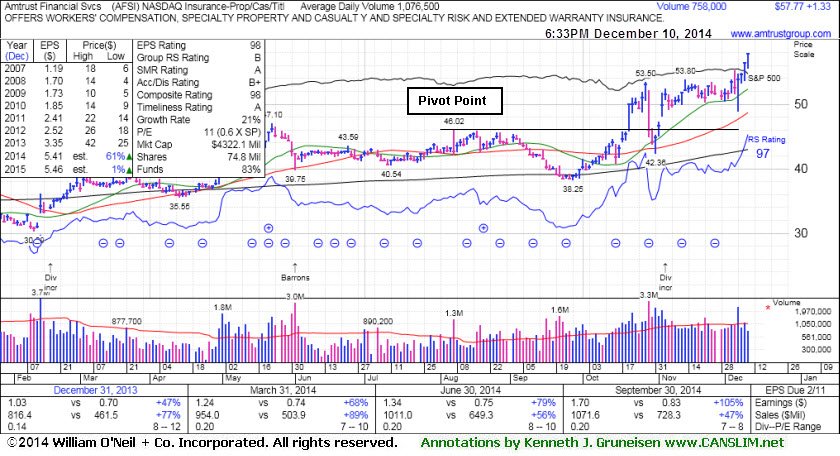
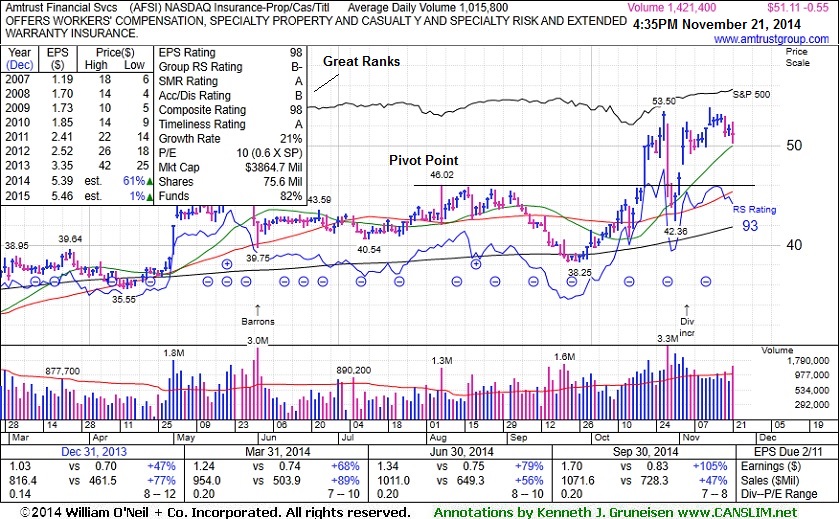
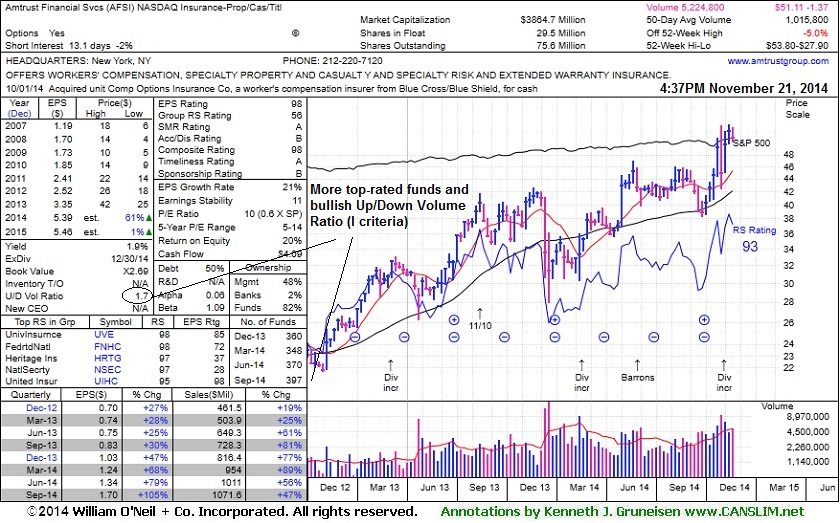
The high-ranked Insurance - Property/Casualty/Title firm was last shown in this FSU section on 11/21/14 with annotated graphs under the headline, "No Sound Base Formed, Yet Little Resistance Remains". It found prompt support at its 50-day moving average (DMA) line when abruptly retreating after an analyst downgraded the stock in late-October. AFSI was highlighted in yellow with new pivot point cited based on its 8/07/14 high in the 10/17/14 mid-day report (read here) and subsequent volume-driven gains above the pivot point triggered a technical buy signal.
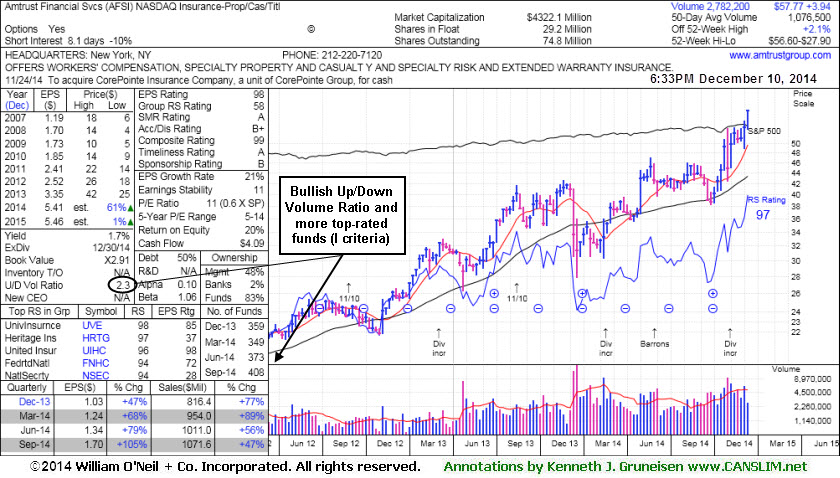
The number of top-rated funds owning an interest rose from 349 in Mar '14 to 408 in Sep '14, a reassuring sign concerning the I criteria. It reported earnings +105% on +47% sales revenues for the quarter ended Sep '14 quarter versus the year ago period, its 9th consecutive comparison above the +25% minimum earnings guideline (C criteria). It has a great annual earnings (A criteria) history and it has earned an impressive 98 Earnings Per Share rating, well above the 80+ minimum rating for buy candidates. Its Relative Strength Rating is currently 97, above the 80+ minimum guideline for buy candidates.
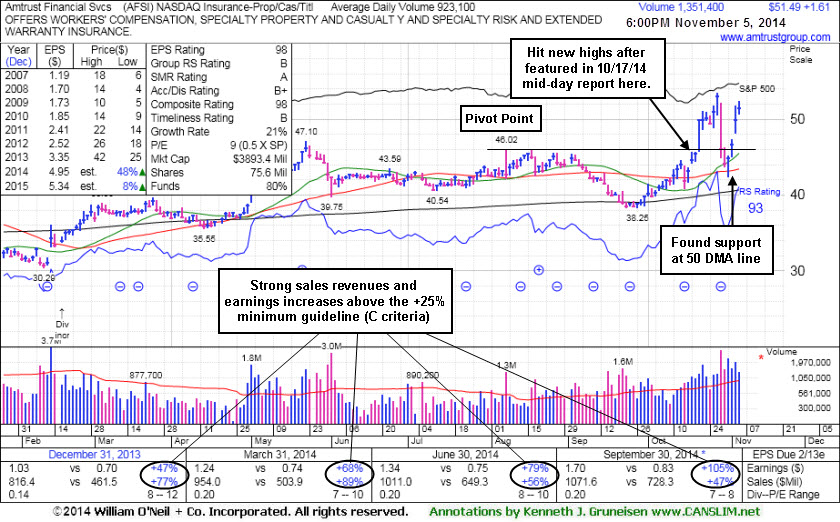
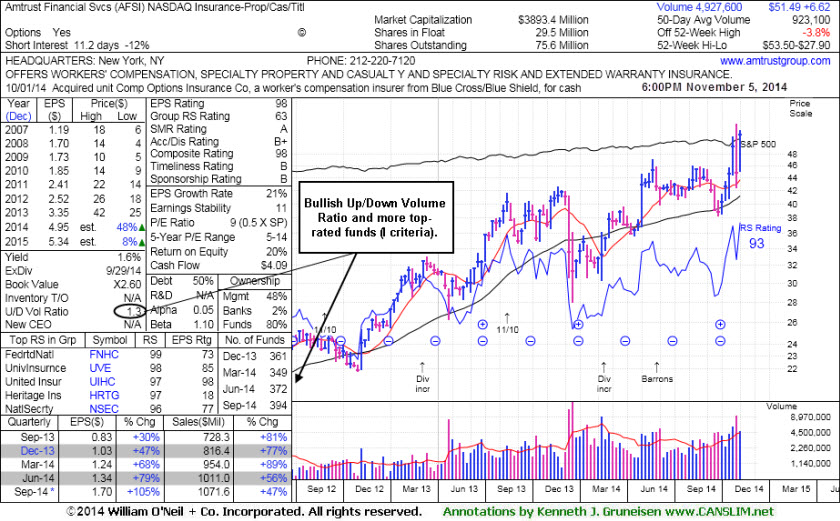
The high-ranked Insurance - Property/Casualty/Title firm was last shown in this FSU section on 11/05/14 with annotated graphs under the headline, "50-Day Average Acted as Support Following Analyst Downgrade". It found prompt support at its 50-day moving average (DMA) line when abruptly retreating after an analyst downgraded the stock. It was highlighted in yellow with new pivot point cited based on its 8/07/14 high in the 10/17/14 mid-day report (read here) and subsequent volume-driven gains above the pivot point triggered a technical buy signal.
The number of top-rated funds owning an interest rose from 349 in Mar '14 to 397 in Sep '14, a reassuring sign concerning the I criteria. It reported earnings +105% on +47% sales revenues for the quarter ended Sep '14 quarter versus the year ago period, its 9th consecutive comparison above the +25% minimum earnings guideline (C criteria). It has a great annual earnings (A criteria) history and it has earned an impressive 98 Earnings Per Share rating, well above the 80+ minimum rating for buy candidates. Its Relative Strength Rating is currently 93, above the 80+ minimum guideline for buy candidates.
It was highlighted in yellow with new pivot point cited based on its 8/07/14 high in the 10/17/14 mid-day report (read here) and. This FSU section on 10/17/14 included detailed analysis and annotated graphs under the headline, "Perched Near High After Rebounding From 200-Day Average". Subsequent volume-driven gains above the pivot point triggered a technical buy signal. It found support at its 200-day moving average (DMA) line then rebounded since dropped from the Featured Stocks list on 9/15/14.
The number of top-rated funds owning an interest rose from 349 in Mar '14 to 394 in Sep '14, a reassuring sign concerning the I criteria. The high-ranked Insurance - Property/Casualty/Title firm reported earnings +105% on +47% sales revenues for the quarter ended Sep '14 quarter versus the year ago period, its 9th consecutive comparison above the +25% minimum earnings guideline (C criteria). It has a great annual earnings (A criteria) history and it has earned an impressive 98 Earnings Per Share rating, well above the 80+ minimum rating for buy candidates. Its Relative Strength Rating is currently 93, above the 80+ minimum guideline for buy candidates.
Amtrust Financial Services' (AFSI -$0.48 or -1.10% to $43.13) fundamentals remain strong (C and A criteria) and it gapped up today challenging its 52-week high and previously stubborn resistance in the $46-47 area. It was highlighted in yellow with new pivot point cited based on its 8/07/14 high in the earlier mid-day report (read here). Subsequent volume-driven gains above the pivot point may trigger a technical buy signal. Disciplined investors will note that a follow-through day from at least one of the major averages is also needed to confirm a new market rally (M criteria) before any new buying efforts may be considered under the fact-based investment system.
AFSI was last shown in this FSU section on 9/08/14 with detailed analysis and annotated graphs under the headline, "Distributional Action; Sub Par Relative Strength Remains Concern". It found support at its 200-day moving average (DMA) line then rebounded since dropped from the Featured Stocks list on 9/15/14. Its Relative Strength Rating is currently 91, back above the 80+ minimum guideline for buy candidates. It faces very little resistance due to overhead supply up through the $47 level.
The number of top-rated funds owning an interest rose from 349 in Mar '14 to 382 in Sep '14, a reassuring sign concerning the I criteria. The high-ranked Insurance - Property/Casualty/Title firm reported earnings +79% on +56% sales revenues for the quarter ended Jun '14 quarter versus the year ago period, its 8th consecutive comparison above the +25% minimum earnings guideline (C criteria). It has a great annual earnings (A criteria) history and it has earned an impressive 98 Earnings Per Share rating, well above the 80+ minimum rating for buy candidates.
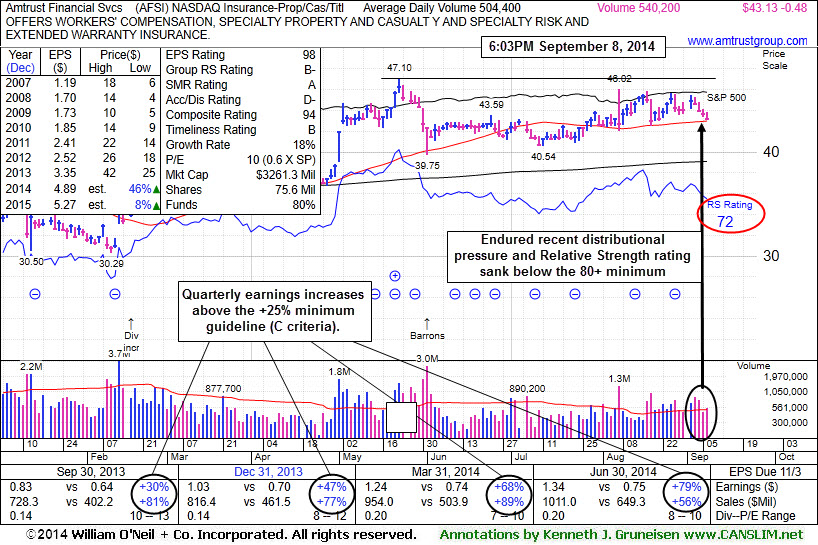
Amtrust Financial Svcs (AFSI -$0.48 or -1.10% to $43.13) recently traded above average volume without making price progress, a sign of distributional pressure. It is consolidating above support at its 50-day moving average (DMA) line, -8.4% off its 52-week high. Its Relative Strength Rating is currently 72 (see red circle), below the 80+ minimum guideline for buy candidates. It faces some resistance due to overhead supply up through the $47 level.
AFSI was last shown in this FSU section on 8/18/14 with detailed analysis and annotated graphs under the headline, "Relative Strength Rating Slumped While Building Longer Base", as it reversed into the red for a small loss on above average volume, a sign of distributional pressure near its prior highs.
The number of top-rated funds owning an interest rose from 363 on Dec '14 to 375 in Jun '14, a somewhat reassuring sign concerning the I criteria. The high-ranked Insurance - Property/Casualty/Title firm reported earnings +79% on +56% sales revenues for the quarter ended Jun '14 quarter versus the year ago period, its 8th consecutive comparison above the +25% minimum earnings guideline (C criteria). It has a great annual earnings (A criteria) history and it has earned an impressive 98 Earnings Per Share rating, well above the 80+ minimum rating for buy candidates.
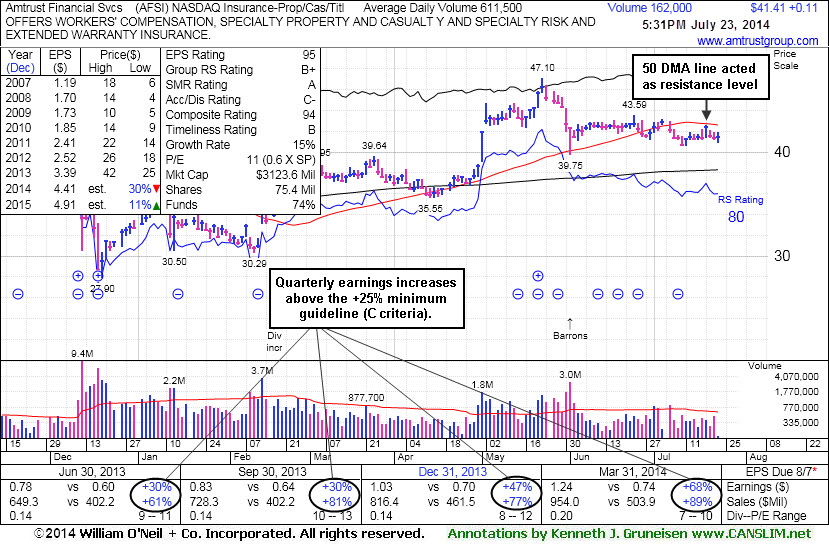
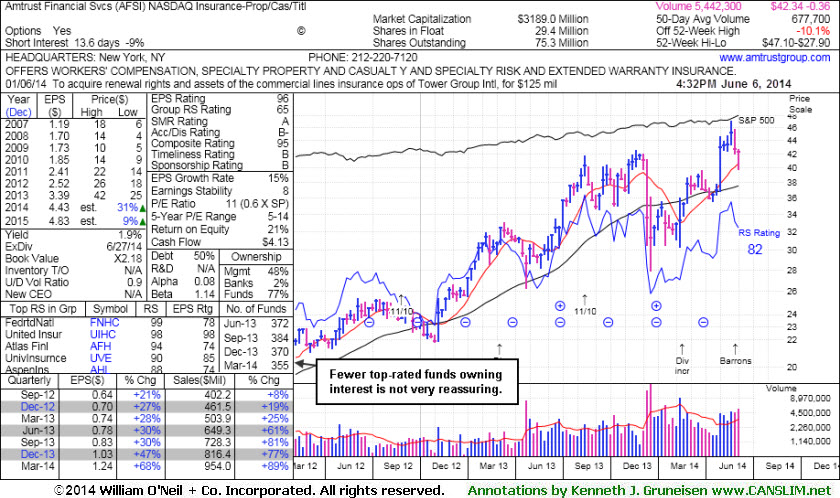
Amtrust Financial Svcs (AFSI +$0.11 or +0.27% to $41.41) reversed into the red for a small loss on above average volume, a sign of distributional pressure near its prior highs. Its Relative Strength rating has slumped to 78, below the 80+ minimum guideline for buy candidates. It has been consolidating above its 50-day moving average (DMA) line, yet it is still facing some resistance due to overhead supply up through the $47 level. AFSI was last shown in this FSU section on 7/23/14 with detailed analysis and annotated graphs under the headline, "50-Day Moving Average Line Acted as Recent Resistance".
The number of top-rated funds owning an interest rose from 363 on Dec '14 to 376 in Jun '14, a somewhat reassuring sign concerning the I criteria. The high-ranked Insurance - Property/Casualty/Title firm reported earnings +79% on +56% sales revenues for the quarter ended Jun '14 quarter versus the year ago period, its 8th consecutive comparison above the +25% minimum earnings guideline (C criteria). It has a great annual earnings (A criteria) history and it has earned an impressive 98 Earnings Per Share rating, well above the 80+ minimum rating for buy candidates.

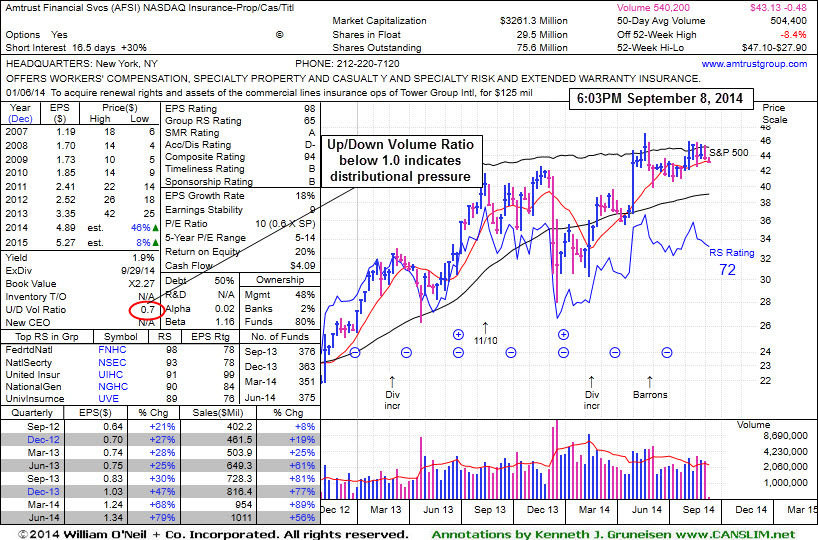
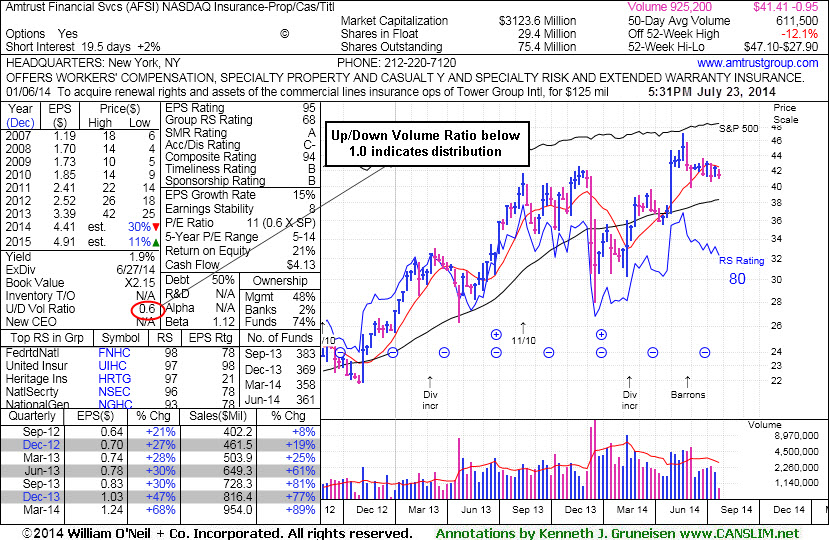
Amtrust Financial Svcs (AFSI +$0.11 or +0.27% to $41.41) is still sputtering below its 50-day moving average (DMA) line which recently acted as a resistance level. Its Relative Strength rating is right at the 80+ minimum guideline for buy candidates. Its current Up/Down Volume Ratio of 0.6 is an unbiased indication that its shares have been under distributional pressure over the past 50 days. Among concerns, we previously noted that the number of top-rated funds owning an interest has been reported lower. For now it faces resistance due to overhead supply up through the $47 level which may hinder its ability to rally. A convincing rebound above its 50 DMA line is needed for its outlook to improve.
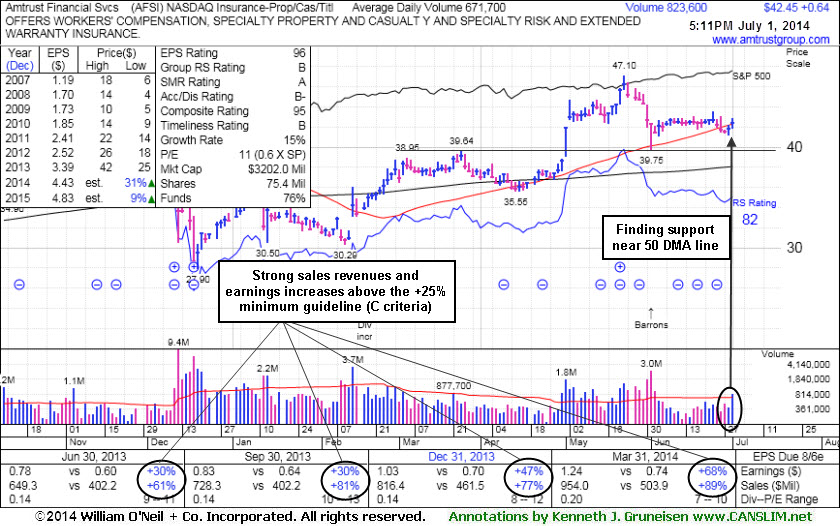
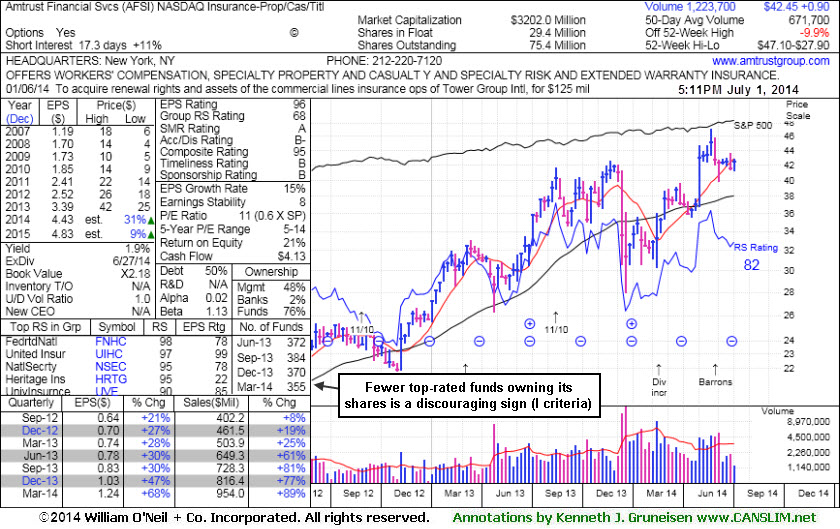
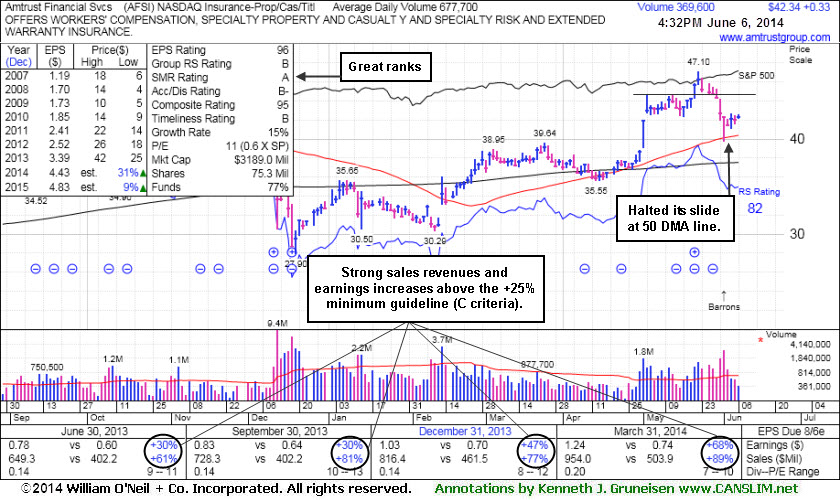
The high-ranked Insurance - Property/Casualty/Title firm stalled and encountered distributional pressure soon after rising from an advanced "3-weeks tight" base. It was highlighted in yellow in the 5/21/14 mid-day report (read here) and the pivot point cited was based on its 5/13/14 high plus 10 cents. AFSI was last shown in this FSU section on 7/01/14 with detailed analysis and annotated graphs under the headline, "Found Support Near 50-Day Average and Relative Strength Slightly Improved", when a prompt rebound above the 50-day moving average (DMA) line helped its outlook improve. Disciplined investors always limit losses by selling any stock that falls more than -7% from their purchase price.
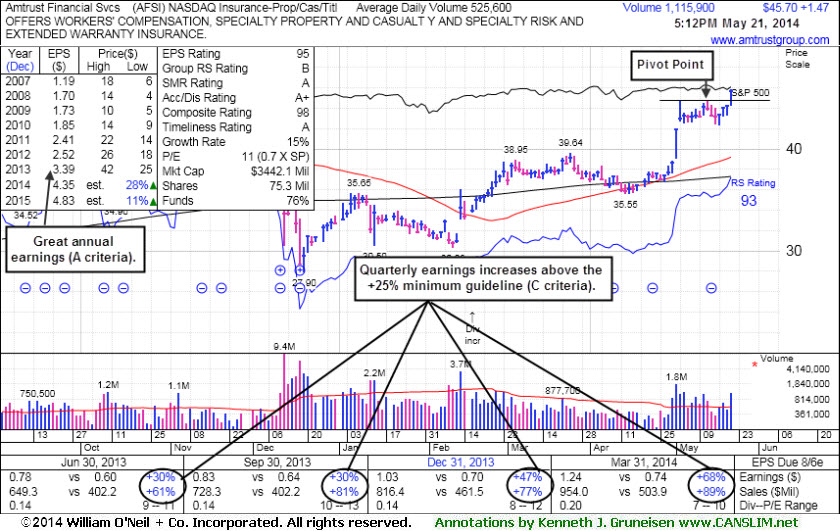
It reported earnings +68% on +89% sales revenues for the quarter ended Mar '14 quarter versus the year ago period, its 7th consecutive comparison above the +25% minimum earnings guideline (C criteria). It has a great annual earnings (A criteria) history and it has earned an impressive 95 Earnings Per Share rating, well above the 80+ minimum rating for buy candidates.
Amtrust Financial Svcs (AFSI +$0.64 or +1.53% to $42.45) managed a prompt rebound above the 50-day moving average (DMA) line helping its outlook improve. Its Relative Strength rating has also rebounded to 82, above the 80+ minimum guideline for buy candidates. It was last shown in this FSU section on 6/06/14 with annotated graphs under the headline, "Halted Slide at 50-Day Moving Average After Distributional Pressure", following damaging losses on higher volume. Disciplined investors always limit losses by selling any stock that falls more than -7% from their purchase price.
The high-ranked Insurance - Property/Casualty/Title firm stalled and encountered distributional pressure soon after rising from an advanced "3-weeks tight" base. It was highlighted in yellow in the 5/21/14 mid-day report (read here) and the pivot point cited was based on its 5/13/14 high plus 10 cents.
The major averages (M criteria) have produced confirming gains coupled with an expansion in leadership (stocks hitting new 52-week highs), a welcome reassurance that the market has established a meaningful rally. It reported earnings +68% on +89% sales revenues for the quarter ended Mar '14 quarter versus the year ago period, its 7th consecutive comparison above the +25% minimum earnings guideline (C criteria). It has a great annual earnings (A criteria) history and it has earned an impressive 96 Earnings Per Share rating, well above the 80+ minimum rating for buy candidates.
Among concerns, we previously noted that the number of top-rated funds owning an interest has been reported lower. Now its current Up/Down Volume Ratio of 1.0 is a neutral indication that its shares have been under neither accumulation or distributional pressure over the past 50 days.
The major averages (M criteria) have produced confirming gains coupled with an expansion in leadership (stocks hitting new 52-week highs), a welcome reassurance that the market has established a meaningful rally. It reported earnings +68% on +89% sales revenues for the quarter ended Mar '14 quarter versus the year ago period, its 7th consecutive comparison above the +25% minimum earnings guideline (C criteria). It has a great annual earnings (A criteria) history and it has earned an impressive 96 Earnings Per Share rating, well above the 80+ minimum rating for buy candidates. Among concerns, we previously noted that the number of top-rated funds owning an interest has been reported lower. Now its current Up/Down Volume Ratio of 0.9 is an unbiased indication that its shares have been under slight distributional pressure over the past 50 days.
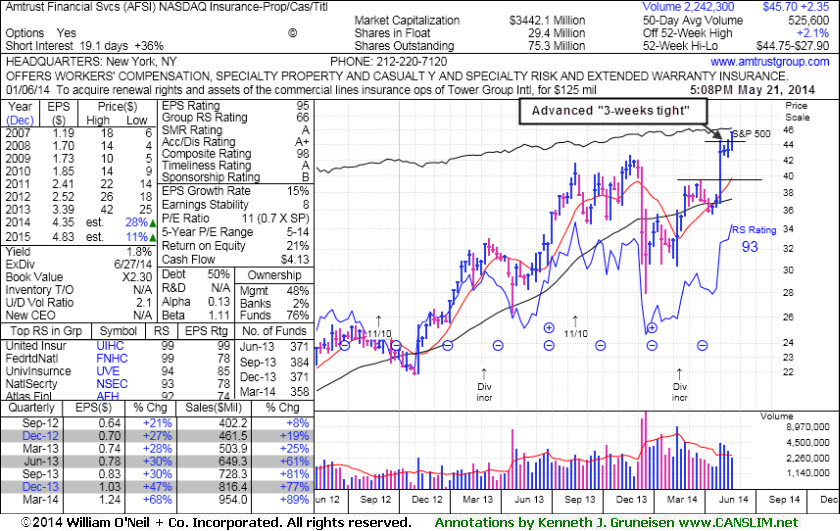
Amtrust Financial Svcs (AFSI +$1.47 or +3.32% to $45.70) hit a new 52-week high and finished strong with +112% above average volume behind today's solid gain while rising from an advanced "3-weeks tight" base. The high-ranked Insurance - Property/Casualty/Title firm was highlighted in yellow in the earlier mid-day report (read here). It held its ground stubbornly while consolidating following a technical breakout on 5/01/14 from a 5-week flat base. The new pivot point cited was based on its 5/13/14 high plus 10 cents. Prior mid-day reports noted - "Reported earnings +68% on +89% sales revenues for the quarter ended Mar '14 quarter versus the year ago period, its 7th consecutive comparison above the +25% minimum earnings guideline (C criteria). Patient investors may watch for a secondary buy point or new base to develop and be noted in the weeks ahead."
Keep in mind 3 out of 4 stocks move in the direction of the major averages (M criteria). Confirming gains from the broader market averages coupled with an expansion in leadership (stocks hitting new 52-week highs) would be a welcome reassurance that the market has established a meaningful rally. It has a great annual earnings (A criteria) history and it has earned an impressive 95 Earnings Per Share rating, well above the 80+ minimum rating for buy candidates.. One concern is that the number of top-rated funds owning an interest was recently reported lower, however, its current Up/Down Volume Ratio of 2.1 is an unbiased indication that its shares have been under accumulation over the past 50 days.