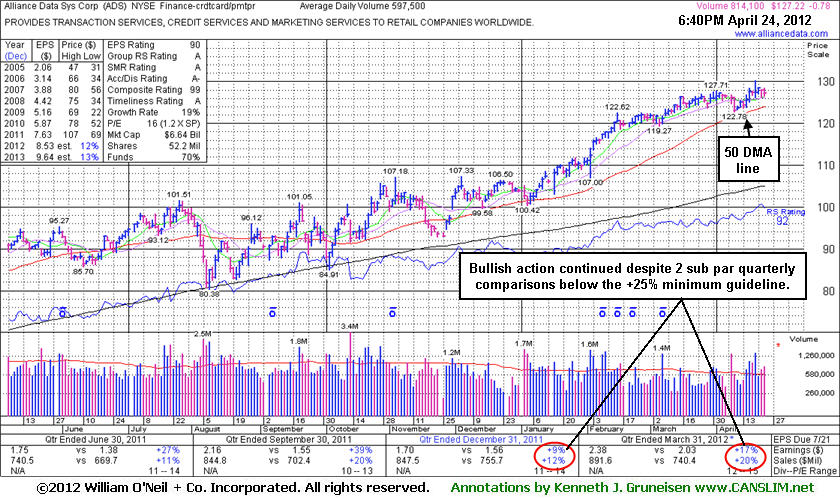
Alliance Data Systems Corporation (ADS -$0.78 or -0.61% to $127.22) is consolidating near its all-time high today. No resistance remains due to overhead supply, and bullish action has continued despite sub par earnings increases in the 2 latest quarterly comparisons versus the year ago periods. It reported earnings +17% on +20% sales revenues for the quarter ended March 31, 2012 versus the year-ago period. Fundamental concerns were raised earlier by earnings reported +9%, well below the +25% minimum guideline, for the latest quarter ended December 31, 2011 versus the year-ago period. It has continued to hold its ground stubbornly and made additional progress since its last appearance in this FSU section with an annotated graph was on 2/29/12 under the headline, "Technically Strong Despite Fresh Concerns Over Fundamentals", while quietly hovering near its all-time high. ADS has maintained a good annual earnings (A criteria) history, even through challenging economic times in recent years which created flaws in the A criteria for many growth stocks. Recent results below the +25% minimum earnings guideline for buy candidates raised concerns. Prior quarterly comparisons (Mar, Jun, and Sep '11) showed earnings per share increases greater than the +25% minimum guideline (C criteria).
Leadership from other companies in the Finance - Credit Card/Payment Processing group (L criteria) has been a favorable characteristic. Ownership by top-rated funds also rose from 616 in Dec '10 to 835 in Dec '11, a reassuring sign concerning the I criteria. Its current Up/Down Volume Ratio of 1.8 also offers an unbiased indication that its shares have been under institutional accumulation over the past 50 days.
Its 50-day moving average (DMA) line defines the nearest support level to watch on pullbacks, while any violation may trigger a technical sell signal.
Lackluster price/volume action coupled with a fresh quarterly earnings report that missed the +25% guideline led to another Featured Stock recently being noted as it was dropped from the Featured Stocks list. As previously noted - "In the Certification they teach investors that stocks should be bought based on a combination of both fundamental and technical criteria, and stocks should always be sold based on technical action. In this case, anyone who owns it might be watching out now for weak action leading to technical sell signals if they meanwhile decide to hold on to see if it first may go on to produce more climactic gains. A disciplined investor would likely look for a fresh candidate without a flaw in its latest earnings report, and one that is near a sound base pattern rather than extended."
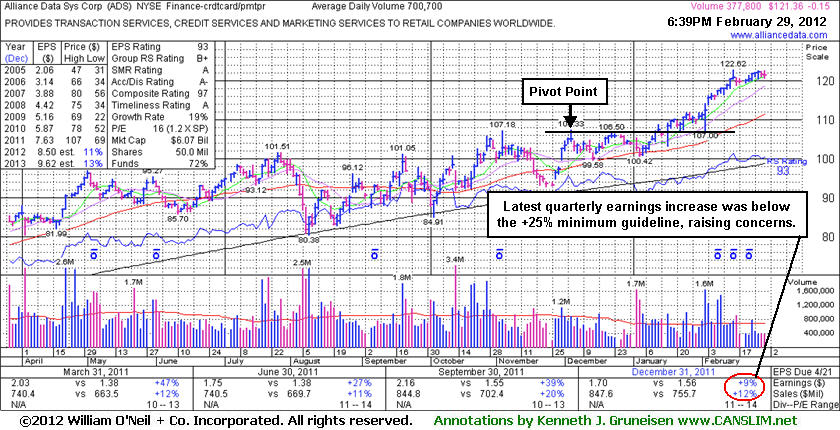
Alliance Data Systems Corporation (ADS -$0.15 or -0.12% to $121.36) is quietly hovering near its all-time high. Its 50-day moving average (DMA) line defines the nearest support level to watch on pullbacks while it is now extended from its latest base. Its last appearance in this FSU section with an annotated graph was on 1/17/12 under the headline, "New Pivot Point Cited for Resilient Leader", as it hit a new all-time high and rallied for gain backed by +40% above average volume, near the bare minimum volume required to trigger a proper technical buy signal. Confirming gains backed by heavy volume showed up in the weeks that followed, providing reassuring signs of serious institutional buying demand that could lead to a more meaningful advance.
ADS has maintained a good annual earnings (A criteria) history, even through challenging economic times in recent years which created flaws in the A criteria for many growth stocks. However, its latest quarter ended December 31, 2011 showed earnings +9% on +12% sales revenues, below the +25% earnings guideline for buy candidates, raising concerns (see red circle). The prior 3 quarterly comparisons (Mar, Jun, and Sep '11) showed earnings per share increases greater than the +25% minimum guideline (C criteria). Current leadership from other companies in the Finance - Credit Card/Payment Processing group (L criteria) is a favorable characteristic. Ownership by top-rated funds also rose from 616 in Dec '10 to 818 in Dec '11, a reassuring sign concerning the I criteria.
In the Certification they teach investors that stocks should be bought based on a combination of both fundamental and technical criteria, and stocks should always be sold based on technical action. In this case, anyone who owns it might be watching out now for weak action leading to technical sell signals if they meanwhile decide to hold on to see if it first may go on to produce more climactic gains. A disciplined investor would likely look for a fresh candidate without a flaw in its latest earnings report, and one that is near a sound base patter rather than extended.
Lackluster price/volume action coupled with a fresh quarterly earnings report that missed the +25% guideline led to another Featured Stock recently being noted as it was dropped from the Featured Stocks list. See the "Ken's Mail Bag" section lower in this evening's report for more details...
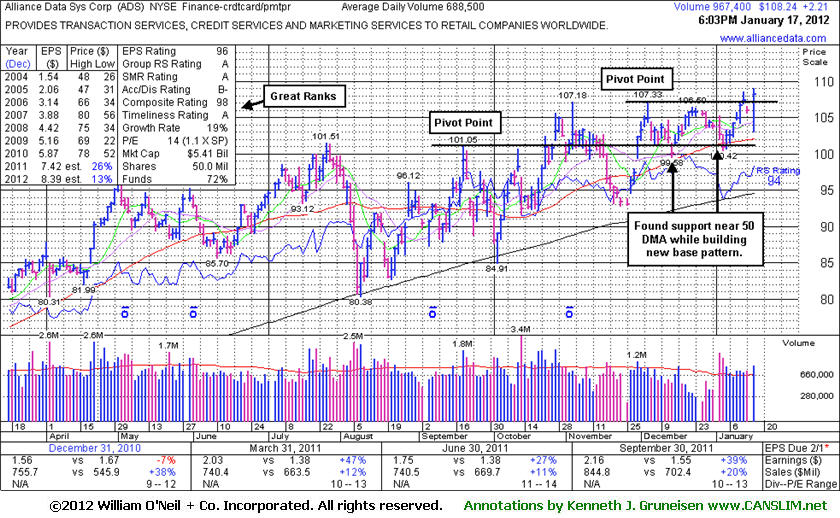
Alliance Data Systems Corporation (ADS +$2.21 or +2.08% to $108.24) hit a new all-time high today and rallied above the previously cited "max buy" level with a gain backed by +40% above average volume, near the bare minimum volume required to trigger a proper technical buy signal. Confirming gains backed by heavy volume would be a reassuring sign of serious institutional buying demand that could lead to a more meaningful advance. Its color code remains yellow and a new pivot point was cited based on its 12/05/11 high plus 10 cents after building an orderly new flat base. Its 50-day moving average (DMA) line and the 1/04/12 session low ($100.42) define near-term support where violations would raise greater concerns and trigger technical sell signals.
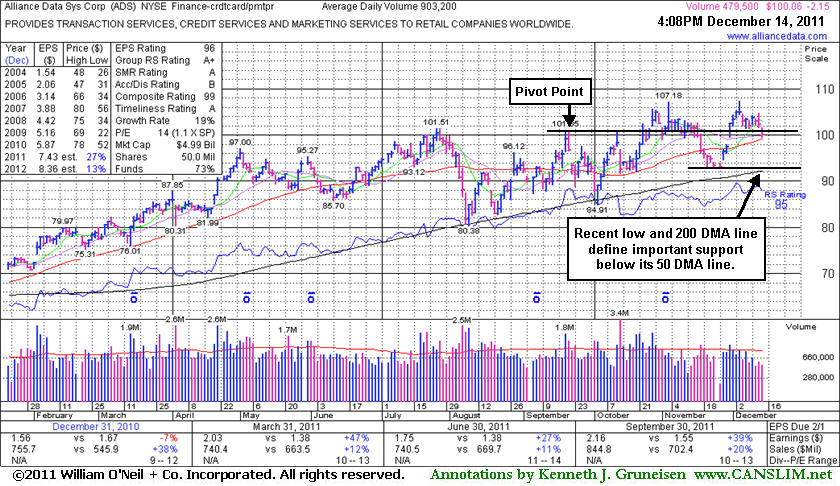
Its last appearance in this FSU section with an annotated graph was on 12/14/11 under the headline, "Recent Low and 200 DMA Line Define Support Below Short-Term Average." It found prompt support near its 50 DMA line even while enduring recent distributional pressure. After ADS was featured in yellow in the 10/21/11 mid-day report it initially powered to new high territory with volume-driven gains, but it stalled and then undercut its 50 DMA line after making limited progress. As always, protect your capital buy selling if any stock falls 7-8% your purchase price. If strength returns a stock can always be bought back, while holding losses beyond the guidelines leaves investors open to potentially greater financial damage from which it can be difficult to recover.
ADS has maintained a good annual earnings (A criteria) history, even through challenging economic times in recent years which created flaws in the A criteria for many growth stocks. Its past 3 quarterly comparisons (Mar, Jun, and Sep '11) showed earnings per share increases greater than the +25% minimum guideline (C criteria). Current leadership from other companies in the Finance - Credit Card/Payment Processing group (L criteria) is a favorable characteristic. Ownership by top-rated funds also rose from 616 in Dec '10 to 764 in Dec '11, a reassuring sign concerning the I criteria.
A much earlier appearance in this FSU section with an annotated graph was way back on 1/23/07 with an annotated graph under the headline, "High Ranked Leader Perched Near Highs". It has maintained a good annual earnings (A criteria) history, even through challenging economic times in recent years which created flaws in the A criteria for many growth stocks. Its past 3 quarterly comparisons (Mar, Jun, and Sep '11) showed earnings per share increases greater than the +25% minimum guideline (C criteria). Current leadership from other companies in the Finance - Credit Card/Payment Processing group (L criteria) is a favorable characteristic. Ownership by top-rated funds also rose from 616 in Dec '10 to 762 in Sep '11, a reassuring sign concerning the I criteria.
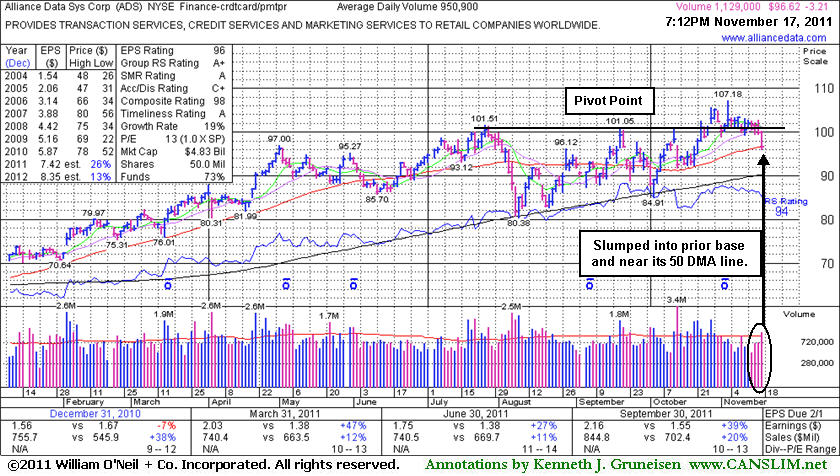
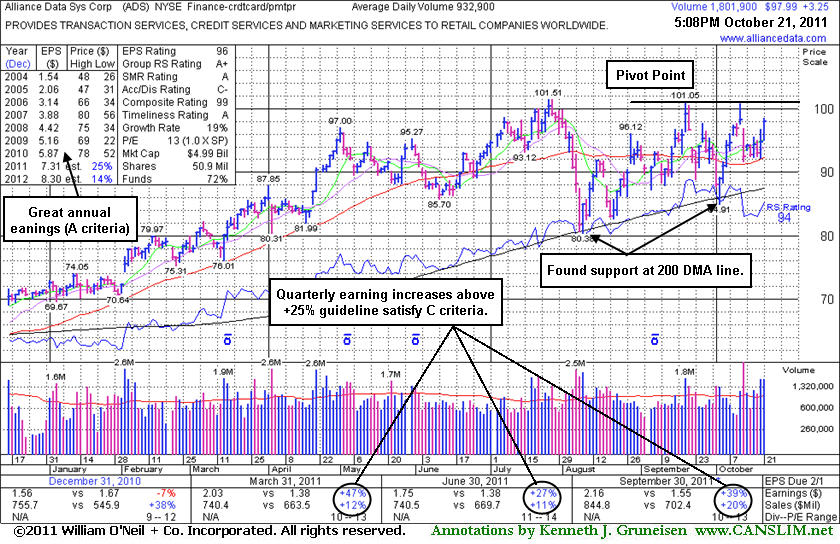
ADS was featured in yellow with a pivot point based on its 9/20/11 high plus 10 cents in the 10/21/11 mid-day report. It was on the rise, rallying within close range of its all-time high, and finished near the session high with a second consecutive volume-driven gain. It found support at its 200-day moving average (DMA) line again during the latest consolidation. Subsequent volume-driven gains above its pivot point may trigger a technical buy signal. As always, protect your capital buy selling if any stock falls 7-8% your purchase price.
Its last appearance in this FSU section with an annotated graph was way back on 1/23/07 with an annotated graph under the headline, "High Ranked Leader Perched Near Highs". It has maintained a good annual earnings (A criteria) history, even through challenging economic times in recent years which created flaws in the A criteria for many growth stocks. Its past 3 quarterly comparisons (Mar, Jun, and Sep '11) showed earnings per share increases greater than the +25% minimum guideline (C criteria). Current leadership from other companies in the Finance - Credit Card/Payment Processing group (L criteria) is a favorable characteristic. Ownership by top-rated funds also rose from 618 in Dec '10 to 755 in Sep '11, a reassuring sign concerning the I criteria.
Often, when a leading stock is setting up to breakout of a solid base it is highlighted in CANSLIM.net's Mid-Day Breakouts Report. The most relevant factors are noted in the report which allows prudent CANSLIM oriented investors to place the issue in their watch list. After doing any necessary backup research, the investor is prepared to act if and when the stock triggers a technical buy signal (breaks above its pivot point on more than +50% average turnover). In the event the stock fails to trigger a technical buy signal and its price declines then it will simply be removed from the watch list.
Alliance Data Systems Corporation (ADS +$3.25 or +3.43% to $97.99) was featured in yellow with a pivot point based on its 9/20/11 high plus 10 cents in the mid-day report earlier today. It was on the rise, rallying within close range of its all-time high, and finished near the session high with a second consecutive volume-driven gain. It found support at its 200-day moving average (DMA) line again during the latest consolidation. Subsequent volume-driven gains above its pivot point may trigger a technical buy signal. As always, protect your capital buy selling if any stock falls 7-8% your purchase price.
Its last appearance in this FSU section with an annotated graph was way back on 1/23/07 with an annotated graph under the headline, "High Ranked Leader Perched Near Highs". It has maintained a good annual earnings (A criteria) history, even through challenging economic times in recent years which created flaws in the A criteria for many growth stocks. Its past 3 quarterly comparisons (Mar, Jun, and Sep '11) showed earnings per share increases greater than the +25% minimum guideline (C criteria). Current leadership from other companies in the Finance - Credit Card/Payment Processing group (L criteria) is a favorable characteristic. Ownership by top-rated funds also rose from 731 in Mar '11 to 807 in Sep '11, a reassuring sign concerning the I criteria.
Often, when a leading stock is setting up to breakout of a solid base it is highlighted in CANSLIM.net's Mid-Day Breakouts Report. The most relevant factors are noted in the report which allows prudent CANSLIM oriented investors to place the issue in their watch list. After doing any necessary backup research, the investor is prepared to act if and when the stock triggers a technical buy signal (breaks above its pivot point on more than +50% average turnover). In the event the stock fails to trigger a technical buy signal and its price declines then it will simply be removed from the watch list.
Alliance Data Systems Corporation (ADS +$1.27 or +1.89% to $65.91) closed just shy of its recent chart highs after finding support near its 50-day moving average (DMA) line and also near a well-defined upward trendline (shown below). ADS appeared in the October 19, 2006 CANSLIM.net Mid Day Breakouts Report (read here) as it was triggering an initial buy signal and trading at $59.07. Recently it appeared in the December 22, 2006 CANSLIM.net After Market Update (read here) highlighting further action. The stock sports a healthy Earnings Per Share rating (EPS) of 98 and a Relative Strength (RS) rating of 95. While it briefly dipped below its 50 DMA line recently, it found support, and the stock has now traced out a large flat base on top of a prior base pattern. Therefore, if it manages to breakout to a new 52-week high with gains on the necessary volume, a new technical buy signal will be triggered. As always, always protect your capital buy selling if any stock falls 7-8% your purchase price.
C A N S L I M | StockTalk | News | Chart | ![]() DGO | SEC | Zacks Reports
DGO | SEC | Zacks Reports

View all notes | Alert me of new notes | CANSLIM.net Company Profile
A very important technical tool that savvy investors have learned to incorporate in their technical analysis is the 50-day moving average (DMA) line. The 50 DMA line plays a pivotal role relative to a stock's price. If the price of a stock is above its 50 DMA then odds are that its 50 DMA will act as formidable support. Conversely, if the price is below its 50 DMA then the moving average acts as resistance. Healthy stocks sometimes trade under their 50 DMA lines briefly, but usually a strong candidate will promptly bounce and repair a 50 DMA violation. When a stock has violated its 50 DMA line and then lingers beneath it, the stock's outlook gets worse and worse as it spends a greater period of time trading under that important short-term average line. Once the 50 DMA line starts sloping downward it should also be acknowledged that the stock has been struggling for a while, and it might be time to reduce exposure and look for places to put that money to work in stronger buy candidates.

View all notes | Alert me of new notes | CANSLIM.net Company Profile
Group action plays a very important role, and experienced investors learn that they can increase their odds of picking a great winner by always focusing their buying efforts in the market's leading groups. The "L" criteria in CAN SLIM(TM) tells us to choose leading companies in leading industry groups, thus it is suggested that investors choose from the top quartile of the 197 Industry Groups (listed in the paper most days on page B4). A classic example of the success enjoyed by many CANSLIM.net readers usually starts when an investor reads a CANSLIM.net report and buys a featured stock before it has risen above the pivot point by greater than 5%. After a stock breaks out above its pivot point, there is only a +5% window that investors have to purchase the stock under the proper guidelines. Once a stock rises above the "maximum buy price" the risk of a shake out balloons, meaning that even a normal retracement in the stock might force you to employ the 7-8% loss cutting rule. Much can be told by the stock's daily action in the weeks and months that follow a breakout. Typically, a light volume and orderly pullback suggests that the bulls remain in control. However, high volume pullbacks that violate support paint a totally different picture.
Alliance Data (ADS +$0.89 or +1.45% to $60.47) closed higher on above average volume as it tried to repair Monday's negative reversal. This stock made its first appearance on Tuesday, June 8, 2004 in the CANSLIM.net Mid Day Breakouts Report (read here) at $39.60. After making its debut in the CANSLIM.net Mid-Day Breakouts report this stock spent the next few weeks advancing. ADS quickly handed over its gains and turned lower triggering a technical sell signal when it fell 7-8% below its pivot point. This stock spent the next several months and the majority of 2005 building a new base. Then, in April 2006, this issue gapped higher. Aftre peaking at $61.40 on July 3rd it has spent the past few months consolidating its recent move.
Recently, ADS was featured in the Thursday, October 19, 2006, edition of the CANSLIM.net Mid Day Report (read here) with a pivot point of $59.03 and the following note, "Gap open gains today on well above average volume currently triggering a technical buy signal and trading at session highs. High ranks with RS line confirming." Last Friday it opened weaker, but it shrugged off earlier weakness and closed with modest gains for the session. However, on Monday, the bears showed up and got the upper hand as ADS negatively reversed after hitting a new high of $62.39. Typically, negative reversals are a sign that a stock is encountering resistance due to heavy selling pressure as it tries to rally into new high ground. However, today's action was healthy, and until this stock triggers a technical sell signal by falling back into the prior base, or falling under its pivot point by 7%, it still may deserve the benefit of the doubt. As always, it is important to adhere to the 7-8% sell rule to preserve capital.
C A N S L I M | StockTalk | News | Chart | SEC | Zacks Reports

View all notes | Alert me of new notes | CANSLIM.net Company Profile
Regular readers of this section in the CANSLIM.net After Market Report are well versed on the importance of upward trendlines. It is also important to note how stocks behave after an upward trendline is violated. By definition, an upward trendline develops when a stock has steadily appreciated for an extended period of time. During that period, the stock vacillates between the lower and upper boundary of the trendline. However, once the bears show up and the lower boundry of the trendline is violated, then odds start favoring the possibility of further downside testing.
Alliance Data Corp. (ADS -$4.03 or -7.39% to $50.50) got smacked on more than 5 times normal volume today after reporting revenues on Wednesday evening that missed the Street estimates, even while the company's earnings were higher than expected and it raised future guidance. This stock was recently featured in the July 2006 issue of CANSLIM.net News (read here) as it was then one of the market's most compelling high-ranked breakouts. But on July 13th this breakout failed badly as it plunged on heavy volume and fell back below support at prior chart highs near $55, sliced through an important upward trendline (see the annotated DailyGraph(R) below), and also violated and closed below its 50 day moving average (DMA) line. That evening's CANSLIM.net After Market Update included the following note on ADS - "Gapped down slightly at today's open and traded down considerably on well above average volume. It had initially improved from early lows, however very negative market conditions have pressured the stock badly. It fell into its prior base and has now also breached the additional support expected at its 50 DMA at ($54.70). As previously noted - a considerable break below technical support would be a sell signal." (read here).
This is a perfect example of how important it is to continually monitor your holdings closely and always limit losses by adhering to a strict sell discipline. Under CAN SLIM(R) guidelines, this calls for limiting losses at 7-8% maximum. Last week's ominous action (violation of support) triggered technical sell signals and set the stage for lower prices. Market conditions (the "M") have not helped investors' odds. The most recent damage will prompt ADS to be removed from the Featured Stocks list.
C A N S L I M | StockTalk | News | Chart | SEC | Zacks Reports

View all notes | Alert me of new notes | CANSLIM.net Company Profile
|
Alliance Data Systems Corp. |
| |
|
Ticker Symbol: ADS (NYSE) |
Industry Group: Financial Services Misc. |
Shares Outstanding: 81,210,000 |
|
Price: $58.82 4:02PM ET |
Day's Volume: 1,744,300 6/30/2006 4:02PM ET |
Shares in Float: 78,000,000 |
|
52 Week High: $57.86 6/30/2006 4:02PM ET |
50-Day Average Volume: 996,500 |
Up/Down Volume Ratio: 1.4 |
|
Pivot Point: $57.09 |
Pivot Point +5% = Max Buy Price: $59.94 |
Web Address: http://www.alliancedatasystems.com/ |
C A N S L I M | StockTalk | News | Chart | SEC | Zacks Reports

View all notes | Alert me of new notes | CANSLIM.net Company Profile
CANSLIM.net Profile: Alliance Data Systems Corporation and its subsidiaries provide transaction services, credit services, and marketing services in
What to Look For and What to Look Out For: Now that ADS has reached new all-time high territory on above average volume as it rose above its pivot point, odds favor further gains. Caution would be warranted if it dropped back into the prior base and negated the recent breakout. There would be even greater concerns if a violation of important chart support at its 50-day moving average (DMA) line occurred. That would technically be considered a sell signal, and then the odds for a sustained rise and meaningful gains would be greatly reduced. It is also important not to chase this stock above its $59.94 maximum buy price. Always limit losses per the 7-8% sell rule, and never hold a stock if it falls more than that much from your purchase price.
Technical Analysis: This stock blasted out of a flat 10-week base with above average volume on Thursday June 29th, 2006. During the previous 3 months there were only 3 weeks of above average volume. It is usually a positive when volume gradually dries up while a stock builds out a longer base. This is precisely what occurred while the stock was basiong above its 50 DMA line, and as a result, the stock has a solid foundation that may help pave the way for further gains. This issue has now cleared all resistance and overhead supply and seems on track for further gains.