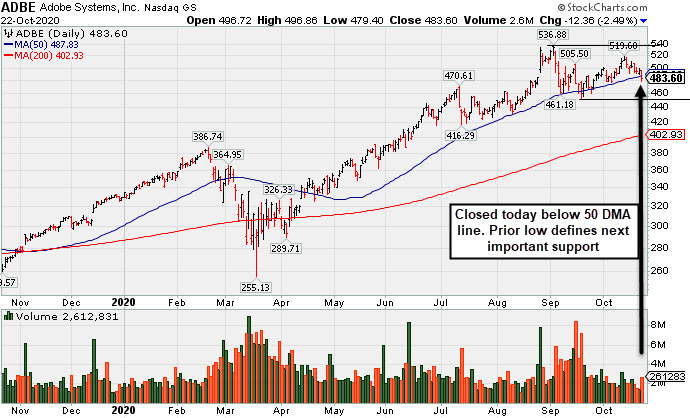
Slump Below 50-Day Moving Average Again Raises Concerns - Thursday, October 22, 2020
Showed Resilience Near 50-Day Moving Average - Thursday, October 8, 2020
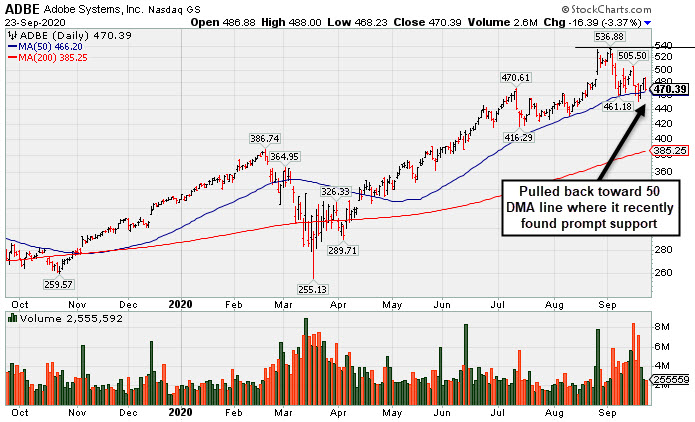
Light Volume Loss Falling Near 50-Day Moving Average Line Again - Wednesday, September 23, 2020
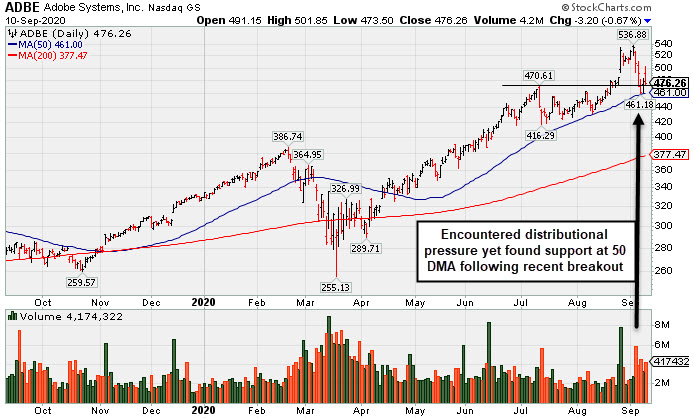
Adobe Found Support Following Recent Breakout - Thursday, September 10, 2020
Slump Below 50-Day Moving Average Again Raises Concerns - Thursday, October 22, 2020
Adobe Inc (ADBE -$12.36 or -2.49% to $483.60) slumped to close below its 50-day moving average (DMA) line ($487) with today's loss on higher (near average) volume raising some concerns and its color code was changed to green. Only a prompt rebound above the 50 DMA line would help its outlook improve. The prior low ($452 on 9/18/20) defines the next important support level to watch.
ADBE now faces some near-term resistance due to overhead supply up to the $536 level. Fundamentals remain strong. It was last shown in this FSU section on 10/08/20 with an annotated graph under the headline, "Showed Resilience Near 50-Day Moving Average" after highlighted in yellow in the 9/10/20 mid-day report (read here). It was noted that after finding support at its 10 week-moving average (WMA). A valid secondary buy point exists up to 5% above the latest high. Disciplined investors always limit losses by selling any stock that falls more than 7-8% from their purchase price.
This well-known Computer Software - Desktop firm reported Aug '20 quarterly earnings +25% on +14% sales revenues versus the year ago period, which marked its 4th consecutive quarterly earnings increase above the +25% minimum guideline (C criteria). Annual earnings history (A criteria) has been strong and steady.
It has a large supply of 479.7 million shares outstanding (S criteria) which makes it a less likely sprinter. However, the number of top-rated funds owning its shares rose from 3,285 in Sep '19 to 3,985 in Sep '20, a reassuring sign concerning the I criteria. Its current Up/Down Volume Ratio of 1.1 is an unbiased indication its shares have been under slight accumulation over the past 50 days. It has an A Timeliness Rating and a B Sponsorship rating, however, its Accumulation/Distribution rating is currently a D+.
Showed Resilience Near 50-Day Moving Average - Thursday, October 8, 2020
Adobe Inc (ADBE -$2.31 or -0.47% to $490.84) has seen its volume totals cooling while consolidating above its 50-day moving average (DMA) line ($477). More damaging losses below the 50 DMA would raise greater concerns. It faces some near-term resistance due to overhead supply up to the $536 level. Fundamentals remain strong.
ADBE was last shown in this FSU section on 9/23/20 with an annotated graph under the headline, "Light Volume Loss Falling Near 50-Day Moving Average Line Again" after highlighted in yellow in the 9/10/20 mid-day report (read here). It was noted that after finding support at its 10 week-moving average (WMA). A valid secondary buy point exists up to 5% above the latest high. Disciplined investors always limit losses by selling any stock that falls more than 7-8% from their purchase price.
This well-known Computer Software - Desktop firm reported Aug '20 quarterly earnings +25% on +14% sales revenues versus the year ago period, which marked its 4th consecutive quarterly earnings increase above the +25% minimum guideline (C criteria). Annual earnings history (A criteria) has been strong and steady.
It has a large supply of 479.7 million shares outstanding (S criteria) which makes it a less likely sprinter. However, the number of top-rated funds owning its shares rose from 3,285 in Sep '19 to 3,949 in Jun '20, a reassuring sign concerning the I criteria. Its current Up/Down Volume Ratio of 1.1 is an unbiased indication its shares have been under slight accumulation over the past 50 days. It has an A Timeliness Rating and a B Sponsorship rating, however, its Accumulation/Distribution rating is currently a D.
Light Volume Loss Falling Near 50-Day Moving Average Line Again - Wednesday, September 23, 2020
Adobe Inc (ADBE -$16.39 or -3.37% to $470.39) slumped toward its 50-day moving average (DMA) line ($466) with today's loss on below average volume. It was last shown in this FSU section on 9/10/20 with an annotated graph under the headline, "Adobe Found Support Following Recent Breakout" after highlighted in yellow in the earlier mid-day report (read here). It was noted that after finding support at its 10 week-moving average (WMA). A valid secondary buy point exists up to 5% above the latest high. Disciplined investors always limit losses by selling any stock that falls more than 7-8% from their purchase price.
This well-known Computer Software - Desktop firm reported Aug '20 quarterly earnings +25% on +14% sales revenues versus the year ago period, which marked its 4th consecutive quarterly earnings increase above the +25% minimum guideline (C criteria). Annual earnings history (A criteria) has been strong and steady.
It has a large supply of 479.7 million shares outstanding (S criteria) which makes it a less likely sprinter. However, the number of top-rated funds owning its shares rose from 3,285 in Sep '19 to 3,857 in Jun '20, a reassuring sign concerning the I criteria. Its current Up/Down Volume Ratio of 0.9 is an unbiased indication its shares have been under slight accumulation over the past 50 days. It has an A Timeliness Rating and a B Sponsorship rating, however, its Accumulation/Distribution rating is currently a D.
Adobe Found Support Following Recent Breakout - Thursday, September 10, 2020
Adobe Inc (ADBE -$3.20 or -0.67% to $476.26) reversed into the red and ended the session lower after it was highlighted in yellow in the earlier mid-day report (read here) after finding support at its 10 week-moving average (WMA). A valid secondary buy point exists up to 5% above the latest high. It pulled back from its all-time high and found support above its 50-day moving average (DMA) line ($461).
Disciplined investors always limit losses by selling any stock that falls more than 7-8% from their purchase price. Keep in mind it is due to report Aug '20 quarterly results on Tuesday, 9/15/20. Volume and volatility often increase near earnings news. This well-known Computer Software - Desktop firm reported May '20 quarterly earnings +34% on +14% sales revenues, which marked its 3rd consecutive quarterly earnings increase above the +25% minimum guideline (C criteria). Annual earnings history (A criteria) has been strong and steady.
It has a large supply of 479.7 million shares outstanding (S criteria) which makes it a less likely sprinter. However, the number of top-rated funds owning its shares rose from 3,285 in Sep '19 to 3,860 in Jun '20, a reassuring sign concerning the I criteria. Its current Up/Down Volume Ratio of 1.2 is an unbiased indication its shares have been under slight accumulation over the past 50 days. It has an A Timeliness Rating and a B Sponsorship rating, however, its Accumulation/Distribution rating is currently a D.