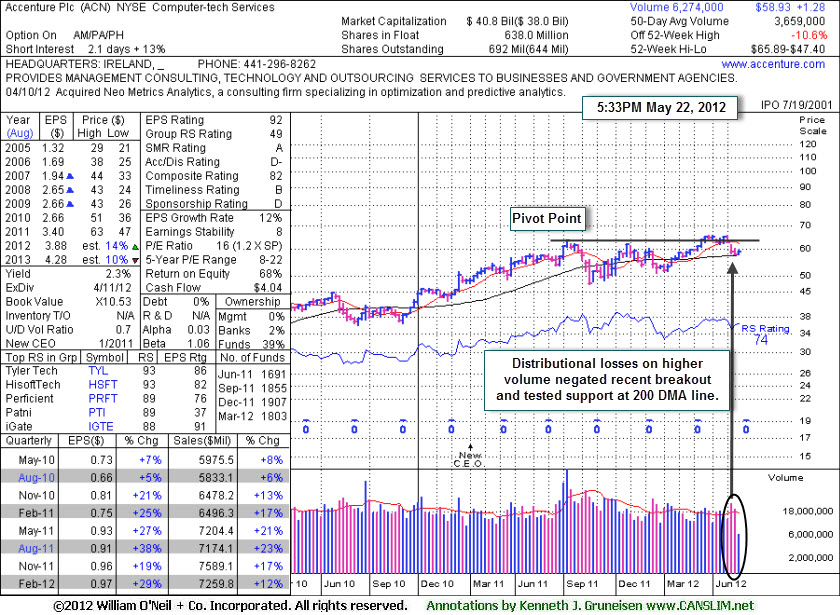
200-Day Moving Average Acting as Support After Breakout Was Negated - Tuesday, May 22, 2012
Accenture, Ltd. (ACN -$0.14 or -0.24% to $58.93) recently bounced from support at its longer-term 200-day moving average (DMA) line. It had triggered technical sell signals with its recent losses undercutting prior highs in the $62-63 area and violating its 50 DMA line. It was last shown in this FSU section with an annotated graph on 3/23/12 under the headline, "Gain for New High on +88% Above Average Volume Clears 6 Month Base", as it rallied into new all-time high territory. Technically, it was described then as - "A bit extended after breaking out from an earlier base on 3/05/12, yet its color code was changed to yellow in the mid-day report (read here) with a pivot point cited based on its 7/07/11 high plus 10 cents. Its convincing finish with volume-driven gain above the pivot point was backed by +88% above average volume on Friday clinched a new (or add-on) technical buy signal."
It reported earnings +29% on +12% sales revenues for the quarter ended February 29, 2012 versus the year ago period. In 3 of the 4 most recent quarterly comparisons it showed encouraging earnings increases above the +25% minimum guideline, however sales revenues increases have shown recent deceleration, up +23%, +17%, and +12% in the latest period. Its annual earnings (A criteria) growth history has been good. Increasing ownership by top-rated funds (I criteria) is reassuring, however it is already heavily owned by the institutional crowd. The number of top-rated funds owning its shares rose from 1,691 in Jun '11 to 1.907 in Dec '11, however that total fell to 1,803 in Mar '12, a disconcerting sign concerning the I criteria. Its Up/Down Volume Ratio of 0.7 also is an unbiased indication that it has encountered distributional pressure in the past 50 days. The Computer - Tech Services group's Group RS Rating has slumped to a mediocre 49, however there are still some strong acting leaders in the group that offer some reassurance concerning the L criteria.
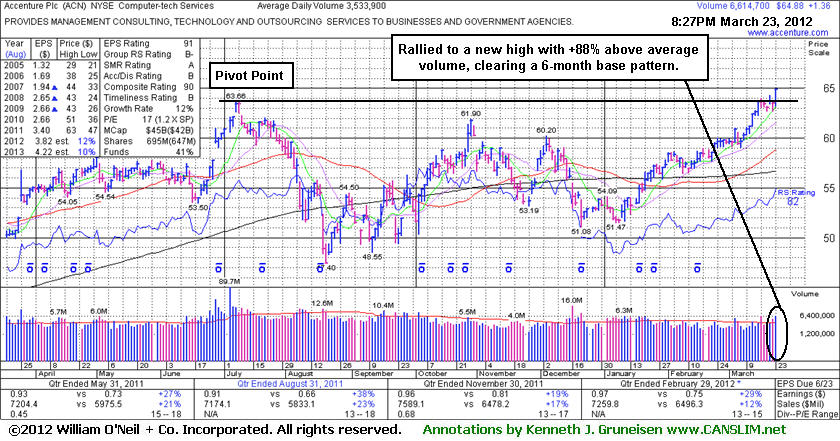
Gain for New High on +88% Above Average Volume Clears 6 Month Base - Friday, March 23, 2012
Accenture, Ltd. (ACN +$1.36 or +2.14% to $64.88) rallied into new all-time high territory this week while overcoming a bit of mild distributional pressure. Technically it is a bit extended after breaking out from an earlier base on 3/05/12, yet its color code was changed to yellow in the mid-day report (read here) with a pivot point cited based on its 7/07/11 high plus 10 cents. Its convincing finish with volume-driven gain above the pivot point was backed by +88% above average volume on Friday clinched a new (or add-on) technical buy signal.
It reported earnings +29% on +12% sales revenues for the quarter ended February 29, 2012 versus the year ago period. In 3 of the 4 most recent quarterly comparisons it showed encouraging earnings increases above the +25% minimum guideline, however sales revenues increases have shown recent deceleration, up +23%, +17%, and +12% in the latest period. Its annual earnings (A criteria) growth history has been good. Increasing ownership by top-rated funds (I criteria) is reassuring, however it is already heavily owned by the institutional crowd. The number of top-rated funds owning its shares rose from 1,569 in Mar '11 to 1.914 in Dec '11, a reassuring sign concerning the I criteria.
Computer Tech Services Firm Trading Near Pivot Point - Wednesday, July 30, 2008
|
Accenture Ltd (ACN) |
| |
|
Ticker Symbol: ACN (NYSE) |
Industry Group: Computer -Tech Services |
Shares Outstanding: 738,000,000 |
|
Price: $41.76 4:01PM ET |
Day's Volume: 5,817,900 7/31/2008 4:01PM ET |
Shares in Float: 595,200,000 |
|
52 Week High: $42.85 8/08/2007 |
50-Day Average Volume: 3,300,200 |
Up/Down Volume Ratio: 1.1 |
|
Pivot Point: $42.14 5/30/2008 plus +$0.10 |
Pivot Point +5% = Max Buy Price: $44.25 |
Web Address: http://www.accenture.com/ |
C A N S L I M | StockTalk | News | Chart | SEC | Zacks Reports

CANSLIM.net Profile: Accenture, Ltd. operates as a management consulting, technology services, and outsourcing company. Its management consulting services include customer relationship management; finance and performance management, which develops financial transaction processing, risk management, and business performance reporting solutions; human performance that works with clients on talent management, workforce, and organizational issues; strategy service line, which helps clients turn insights into results at the enterprise and business-unit level; and supply chain management. The company also provides various system integration and technology consulting services. Accenture was founded in 1995 and is based in Hamilton, Bermuda. The company has increased its earnings by +28%, +30%, +42%, and +37% in the quarterly comparisons versus the year ago periods ending Aug, Nov '07 and Feb, May '08, better than the +25% guideline (the C criteria) in each of the last four reports. The company hails from the Computer- Tech Services group which is presently ranked 24th on the 197 Industry Groups list, which easily places it inside the much coveted top quartile of industry groups needed to satisfy the "L" criteria. Return on Equity stands at a very impressive +62%, well above the +17% guideline.
What to Look For and What to Look Out For: Watch for a new proper technical buy signal to be triggered with convincing gains on high volume before initiating any new positions. You are wise to wait for that blast of buying as proof institutional demand (the I criteria) is truly present and capable of leading to a sustained advance. It important to note that this could be days or even weeks away, or it might never materialize. Meanwhile, there is no way of knowing if the stock might spend a much longer time consolidating even deeper towards its 50-day moving average (DMA) line. As long as this issue continues trading above chart support at that important short term average the action remains healthy. However, if the bears show up and send this issue below its 50 DMA line, then it would suggest that this issue may spend more time consolidating which could be an ominous sign.
Technical Analysis: This stock is currently tracing out what may be called a 9-month cup-with-handle base pattern, from which it has yet to trigger a convincing technical buy signal. It recently appeared in the July 30, 2008 CANSLIM.net Mid-Day Breakouts report (read here) as it was approaching its pivot point. ACN is technically still "basing" and should remain on an active watchlist until a new proper buy signal is triggered.