There are no featured stock write-ups on ACHC proir to 2/18/2025
 Upgrade your membership to see all of the expert analysis we have published on ACHC now!
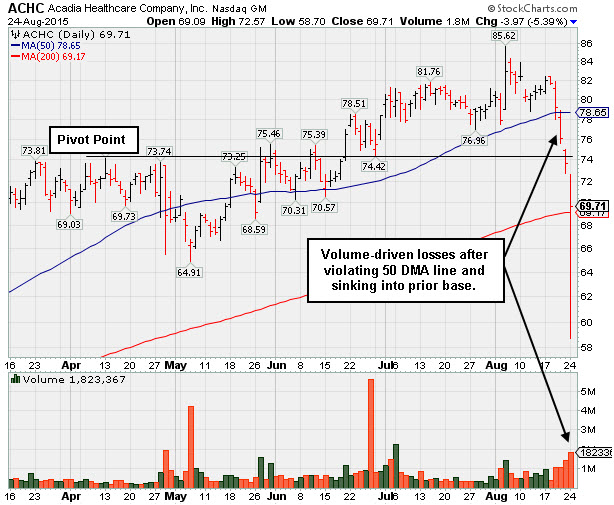
Technical Weakness Trumps Strong Fundamentals - Monday, August 24, 2015
Acadia Healthcare Inc (ACHC -$3.97 or -5.39% to $69.71) rebounded after slumping well below its 200-day moving average (DMA) line today. It found support and finished the session above that important long-term average. On the 2 prior sessions it was noted after triggering worrisome technical sell signals. Widespread market weakness (M criteria) is cause for concern and it will be dropped from the Featured Stocks list tonight. A subsequent rebound above the 50 DMA line is needed for its outlook to improve.
ACHC was last shown in this FSU section on 8/04/15 with an annotated graphs under the headline, "Pullback Followed Another Strong Quarter Reported With Acceleration". It reported earnings +78% on +112% sales revenues for the Jun '15 quarter, extending its streak of strong quarterly comparisons with accelerating sales revenues and earnings increases well above the +25% minimum guideline (C criteria). Strong fundamentals can be reassuring when broader market weakness is hurting other stocks, but solid fundamentals are never a reason to ignore treacherous technical price/volume action in any individual issue.
On 6/19/15 its strong gain was backed by +97% above average volume as it rallied above the pivot point cited and triggered a technical buy signal. It has a small supply of only 49.4 million shares (S criteria) in the public float. Leadership in the Medical / Outpatient/Home Care industry group is a reassuring sign (L criteria) as the group has earned an 95 Group Relative Strength Rating. The number of top-rated funds owning its shares rose from 364 on Jun '14 to 479 in Jun '15, a reassuring sign concerning the I criteria. It completed a new Public Offering on 5/05/15, and such offerings typically hinder a stock's progress for the short-term, however, the upshot is that the underwriters help companies attract greater interest from the institutional crowd.
It reported earnings increases of +23%, +53%, +59%, and +54% in the Jun, Sep, Dec '14 and Mar '15 quarters, respectively. Having 3 or 4 quarterly comparisons with increases above the +25% minimum guideline satisfied the C criteria. Sales revenues increases during that span were also up +20%, +59%, +55%, and +82%, showing encouraging acceleration. Since tallying a loss in FY '11 its annual earnings (A criteria) have been strong.
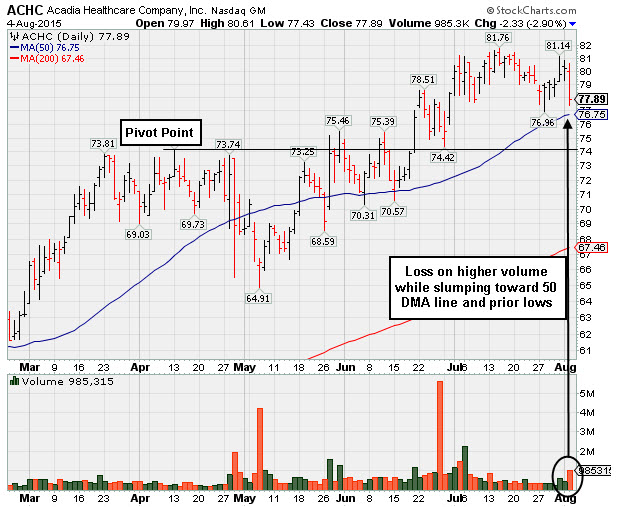
Pullback Followed Another Strong Quarter Reported With Acceleration - Tuesday, August 4, 2015
Acadia Healthcare Inc (ACHC -$2.33 or -2.90% to $77.89) reported earnings +78% on +112% sales revenues for the Jun '15 quarter, extending its streak of strong quarterly comparisons with accelerating sales revenues and earnings increases well above the +25% minimum guideline (C criteria). It fell today with +33% above average volume behind the loss while slumping toward its 50-day moving average (DMA) line and prior lows defining near-term support to watch in the $76 area.
ACHC was last shown in this FSU section on 7/15/15 with an annotated graphs under the headline, "Extended From Prior Base and Perched at High ", trading above its "max buy" level and hitting a new all-time high. On 6/19/15 its strong gain was backed by +97% above average volume as it rallied above the pivot point cited and triggered a technical buy signal. It has a small supply of only 49.4 million shares (S criteria) in the public float. Leadership in the Medical / Outpatient/Home Care industry group is a reassuring sign (L criteria) as the group has earned an 95 Group Relative Strength Rating. The number of top-rated funds owning its shares rose from 364 on Jun '14 to 479 in Jun '15, a reassuring sign concerning the I criteria. It completed a new Public Offering on 5/05/15, and such offerings typically hinder a stock's progress for the short-term, however, the upshot is that the underwriters help companies attract greater interest from the institutional crowd.
It reported earnings increases of +23%, +53%, +59%, and +54% in the Jun, Sep, Dec '14 and Mar '15 quarters, respectively. Having 3 or 4 quarterly comparisons with increases above the +25% minimum guideline satisfied the C criteria. Sales revenues increases during that span were also up +20%, +59%, +55%, and +82%, showing encouraging acceleration. Since tallying a loss in FY '11 its annual earnings (A criteria) have been strong.
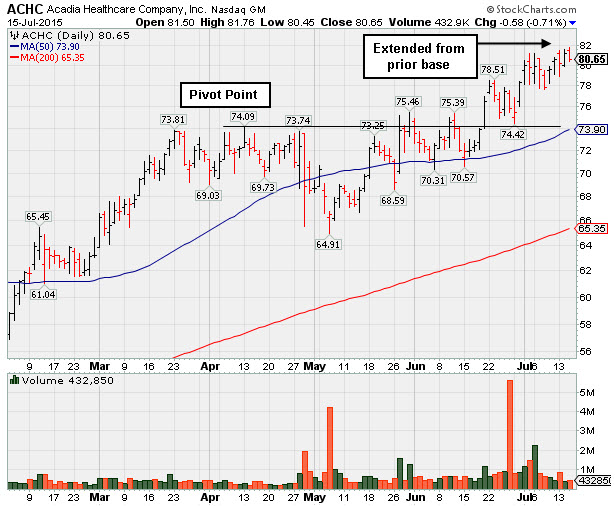
Extended From Prior Base and Perched at High - Wednesday, July 15, 2015
Acadia Healthcare Inc (ACHC -$0.58 or -0.71% to $80.65) is holding its ground above its "max buy" level and it touched a new all-time high today. Prior highs in the $74-75 area define near-term support to watch above its 50-day moving average (DMA) line ($73.90). It was last shown in this FSU section on 6/19/15 with an annotated graphs under the headline, "Signs of Demand With Volume-Driven Gain for New Highs". Its strong gain was backed by +97% above average volume as it rallied above the pivot point cited and triggered a technical buy signal.
ACHC has a small supply of only 50.8 million shares (S criteria) in the public float. Leadership in the Medical / Outpatient/Home Care industry group is a reassuring sign (L criteria) as the group has earned an 90 Group Relative Strength Rating. The number of top-rated funds owning its shares rose from 364 on Jun '14 to 475 in Jun '15, a reassuring sign concerning the I criteria. It completed a new Public Offering on 5/05/15, and such offerings typically hinder a stock's progress for the short-term, however, the upshot is that the underwriters help companies attract greater interest from the institutional crowd.
It reported earnings increases of +23%, +53%, +59%, and +54% in the Jun, Sep, Dec '14 and Mar '15 quarters, respectively. Having 3 or 4 quarterly comparisons with increases above the +25% minimum guideline satisfied the C criteria. Sales revenues increases during that span were also up +20%, +59%, +55%, and +82%, showing encouraging acceleration. Keep in mind that it is due to report earnings on 7/27/15, and volume and volatility often increase near earnings news. Since tallying a loss in FY '11 its annual earnings (A criteria) have been strong.
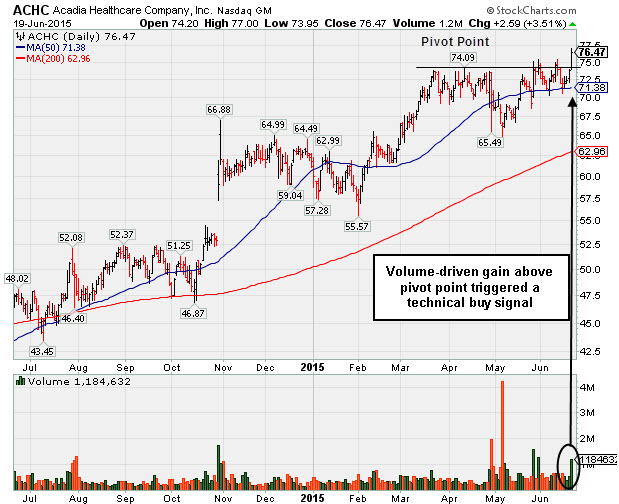
Signs of Demand With Volume-Driven Gain for New Highs - Friday, June 19, 2015
Acadia Healthcare Inc (ACHC +$2.52 or +3.51% to $76.47) posted a 4th consecutive gain today and hit a new 52-week high. Its strong gain was backed by +97% above average volume as it rallied above the pivot point cited and triggered a technical buy signal. The pivot point cited was based on its 4/13/15 high plus 10 cents when it was highlighted in the 5/27/15 mid-day report (read here). It found support above its 50-day moving average (DMA) line since last shown in this FSU section that evening with annotated graphs under the headline, "Finished Below Pivot Point Despite Big Volume-Driven Gain and New 52-Week High".
ACHC has a small supply of only 50.8 million shares (S criteria) in the public float. Leadership in the Medical / Outpatient/Home Care industry group is a reassuring sign (L criteria) as the group has earned an 91 Group Relative Strength Rating. The number of top-rated funds owning its shares rose from 364 on Jun '14 to 461 in Mar '15, a reassuring sign concerning the I criteria. It completed a new Public Offering on 5/05/15, and such offerings typically hinder a stock's progress for the short-term, however, the upshot is that the underwriters help companies attract greater interest from the institutional crowd.
It reported earnings increases of +23%, +53%, +59%, and +54% in the Jun, Sep, Dec '14 and Mar '15 quarters, respectively. Having 3 or 4 quarterly comparisons with increases above the +25% minimum guideline satisfied the C criteria. Sales revenues increases during that span were also up +20%, +59%, +55%, and +82%, showing encouraging acceleration. Since tallying a loss in FY '11 its annual earnings (A criteria) have been strong.
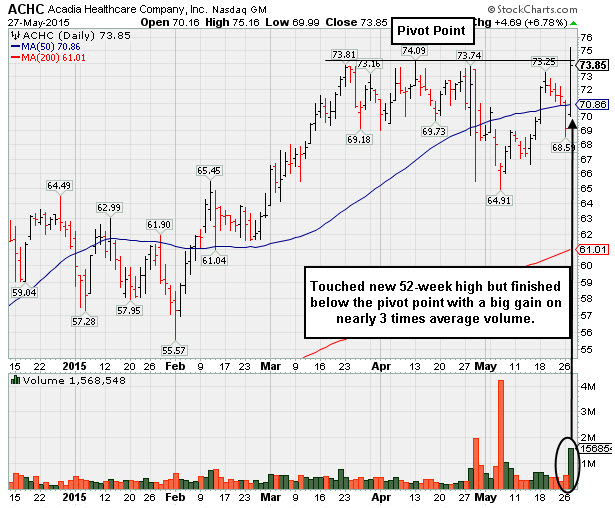
Finished Below Pivot Point Despite Big Volume-Driven Gain and New 52-Week High - Wednesday, May 27, 2015
Acadia Healthcare Inc (ACHC +$4.69 or +6.78% to $73.85) was highlighted in yellow with new pivot point cited based on its 4/13/15 high plus 10 cents in the earlier mid-day report (read here). It rallied from below its 50-day moving average (DMA) line to hit a new 52-week high, however, it failed to close the session above the pivot point. Confirming gains are still needed. Members were reminded - "A strong gain for a new high (N criteria) above the pivot point with at least +40% above average volume is needed to trigger a proper technical buy signal."
It has a small supply of only 50.8 million shares (S criteria) in the public float. Leadership in the Medical / Outpatient/Home Care industry group is a reassuring sign (L criteria) as the group has earned an 89 Group Relative Strength Rating. The number of top-rated funds owning its shares rose from 364 on Jun '14 to 458 in Mar '15, a reassuring sign concerning the I criteria. It completed a new Public Offering on 5/05/15, and such offerings typically hinder a stock's progress for the short-term, however, the upshot is that the underwriters help companies attract greater interest from the institutional crowd.
It reported earnings increases of +23%, +53%, +59%, and +54% in the Jun, Sep, Dec '14 and Mar '15 quarters, respectively. Having 3 or 4 quarterly comparisons with increases above the +25% minimum guideline satisfied the C criteria. Sales revenues increases during that span were also up +20%, +59%, +55%, and +82%, showing encouraging acceleration. Since tallying a loss in FY '11 its annual earnings (A criteria) have been strong.
