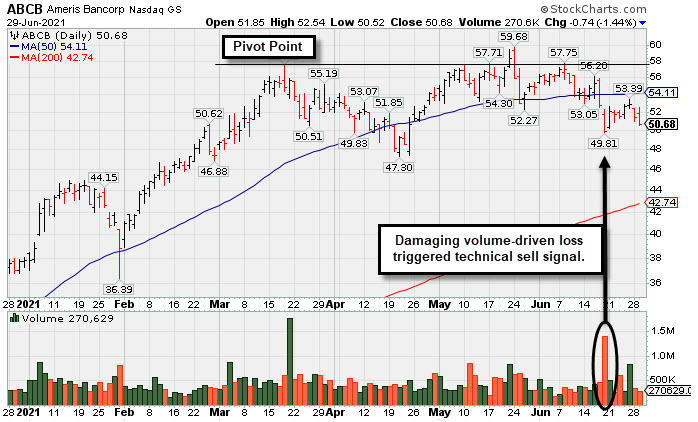
Still Sputtering After Damaging Losses Triggered Sell Signal - Tuesday, June 29, 2021
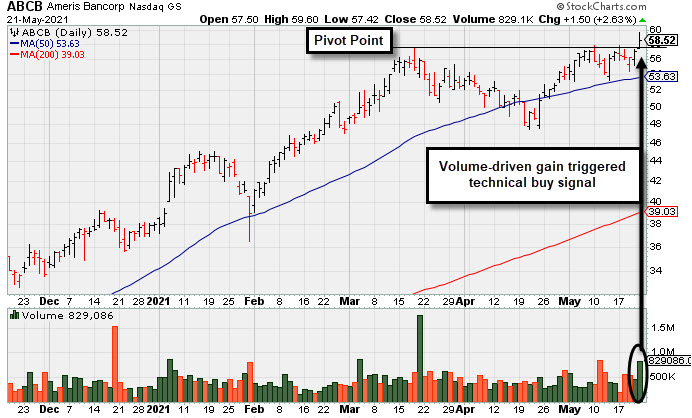
Breakout to New All-Time High for Another Regional Bank - Friday, May 21, 2021
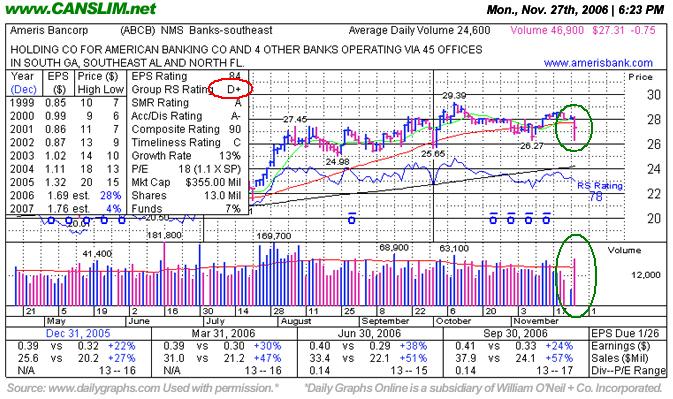
Concerns Rise After Violation of 50 DMA - Monday, November 27, 2006
A very important technical tool that savvy investors have learned to incorporate in their technical analysis is the 50-day moving average (DMA) line. The 50 DMA line plays a pivotal role relative to a stock's price. If the price of a stock is above its 50 DMA then odds are that its 50 DMA will act as formidable support. Conversely, if the price is below its 50 DMA then the moving average acts as resistance. Healthy stocks sometimes trade under their 50 DMA lines briefly, but usually a strong candidate will promptly bounce and repair a 50 DMA violation. When a stock has violated its 50 DMA line and then lingers beneath it, the stock's outlook gets worse and worse as it spends a greater period of time trading under that important short-term average line. Once the 50 DMA line starts sloping downward it should also be acknowledged that the stock has been struggling for a while, and it might be time to reduce exposure and look for places to put that money to work in stronger buy candidates.
Ameris Bancorp (ABCB -$0.75 or -2.67% to $27.31) sliced through its 50 DMA line today with a loss on above average volume. It was first featured on Thursday, September 21, 2006 in the CANSLIM.net Mid Day Breakouts Report (read here) with a $27.55 pivot point. Later that day, ABCB was featured in the CANSLIM.net After Market Report (read here) with the following comments, "It was on pace to possibly trade sufficient volume in the early going, however, today's volume total ultimately failed to meet the necessary +50% above average guideline which would trigger a valid technical buy signal." Since then it tested its 50 DMA line and promptly found support on October 3rd, subsequently rallying and rising above its pivot point with sufficient volume to trigger a technical buy signal on October 10th. However, ABCB failed make significant headway and it has traded on either side of its 50 DMA line in recent weeks. Disciplined investors who may have purchased shares of ABCB within the proper guidelines would likely have been prompted to sell when the price fell more than 7-8% from their purchase price. However, the stock is showing some resilience near its 50 DMA line and it ended near the middle of its intra-day trading range. In the days and weeks ahead it may repair the latest 50 DMA violation and eventually shape up as a stronger looking buy candidate again. Meanwhile, adhering to a strict sell discipline is critical to maximizing your results using the CAN SLIM(R) investment system. Investors must be prepared to sell each issue, on a case-by-case basis, as sell signals start showing up when market conditions turn negative.
C A N S L I M | StockTalk | News | Chart | ![]() DGO | SEC | Zacks Reports
DGO | SEC | Zacks Reports
View all notes | Alert me of new notes | CANSLIM.net Company Profile
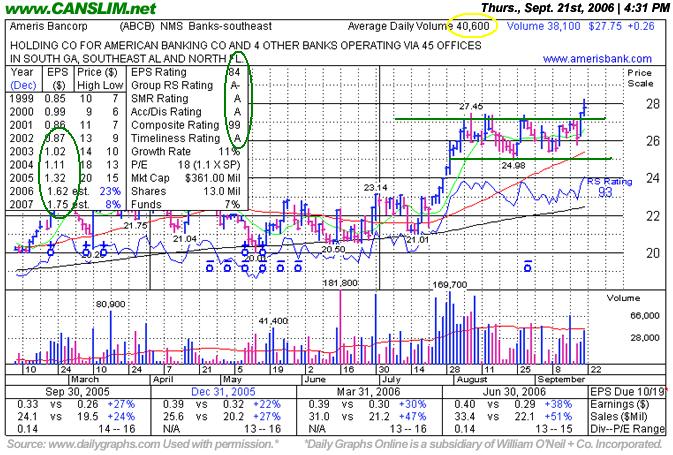
Volume Failed to Trigger A Proper Technical Buy Signal - Thursday, September 21, 2006
Group action plays a very important role, and experienced investors learn that they can increase their odds of picking a great winner by always focusing their buying efforts in the market's leading groups. The "L" criteria in CAN SLIM(TM) tells us to choose leading companies in leading industry groups, thus it is suggested that investors choose from the top quartile of the 197 Industry Groups (listed in the paper most days on page B4). A classic example of the success enjoyed by many CANSLIM.net readers usually starts when an investor reads a CANSLIM.net report and buys a featured stock before it has risen above the pivot point by greater than 5%. However, without the volume guideline also being met, disciplined investors would not buy a stock. Price alone does not make a breakout buyable within the CAN SLIM(R) strategy guidelines, as trading volume must also show a meaningful rise to a level at least +50% above average. That increase in volume helps a stock satisfy the "I" criteria.
Ameris Bancorp (ABCB +$0.25 or +0.89% to $27.74) rose to a new high today but what was worse than the fact it ended off its intra-day high was the fact that it failed to meet the volume guidelines to constitute a proper technical breakout that is buyable. This stock was first featured in today's CANSLIM.net Mid Day Breakouts Report (read here) with the following note, "Y - Was building a new base now is breaking out above the pivot point ($27.55 - old high on 8/8 plus 0.10 cents). Greater volume would trigger a more solid technical buy signal. Group rank is improving over the past 6 months. The "L" criteria can generally be met by choosing leading stocks from a group in the top quartile (25%) of the industry group ranks. Only trades 40,000 shares a day on average." It was on pace to possibly trade sufficient volume in the early going, however, today's volume total ultimately failed to meet the necessary +50% above average guideline which would trigger a valid technical buy signal. Adhering to the necessary guidelines can be critical to maximizing your results using the CAN SLIM(R) investment system.
C A N S L I M | StockTalk | News | Chart | SEC | Zacks Reports
View all notes | Alert me of new notes | CANSLIM.net Company Profile