You are not logged in.
This means you
CAN ONLY VIEW reports that were published prior to Friday, February 23, 2024.
You
MUST UPGRADE YOUR MEMBERSHIP if you want to see any current reports.
AFTER MARKET UPDATE - TUESDAY, DECEMBER 31ST, 2019
Previous After Market Report Next After Market Report >>>
|
|
|
|
DOW |
+76.30 |
28,538.44 |
+0.27% |
|
Volume |
815,459,390 |
+18% |
|
Volume |
2,172,898,950 |
+6% |
|
NASDAQ |
+26.61 |
8,972.60 |
+0.30% |
|
Advancers |
1,851 |
65% |
|
Advancers |
1,976 |
62% |
|
S&P 500 |
+9.49 |
3,230.78 |
+0.29% |
|
Decliners |
998 |
35% |
|
Decliners |
1,221 |
38% |
|
Russell 2000 |
+4.32 |
1,668.47 |
+0.26% |
|
52 Wk Highs |
103 |
|
|
52 Wk Highs |
109 |
|
|
S&P 600 |
+3.16 |
1,021.18 |
+0.31% |
|
52 Wk Lows |
9 |
|
|
52 Wk Lows |
29 |
|
|
Happy New Year from FACTBASEDINVESTING.com. We wish you many great successes in 2020!
Thank you to our valued members! We appreciate your interest and your ongoing support of this service. Feel free to send your questions, suggestions, and comments to us any time via the inquiry form.
|
 |
S&P 500 Index Tallied its Best Year Since 2013
Kenneth J. Gruneisen - Passed the CAN SLIM® Master's Exam
For December, the Dow added 1.7%, the S&P 500 climbed 2.9%, and the Nasdaq rallied 3.5%. For the quarter, the Dow, S&P 500, and Nasdaq advanced 6%, 8.5%, and 12.2%, respectively. Stocks finished higher on Tuesday, closing out a record year on Wall Street. The S&P 500 and Nasdaq Composite each rose 0.3%. Both benchmark indexes capped their strongest annual performance since 2013, climbing 28.9% and 35.2%, respectively. The Dow gained 76 points, notching its best year since 2017, up 22.3%. Advancers led decliners by a 9-5 margin on the NYSE and 3-2 on the Nasdaq exchange. The volume totals were higher than the prior session's totals on the NYSE and on the Nasdaq exchange. There were 37 high-ranked companies from the Leaders List that hit a new 52-week high and were listed on the BreakOuts Page, versus the total of 42 on the prior session. New 52-week highs totals again easily outnumbered new 52-week lows totals on the NYSE and on the Nasdaq exchange. The major indices (M criteria) are in a "confirmed uptrend" after enduring distributional pressure in recent weeks. The Featured Stocks Page provides the most timely analysis on high-ranked leaders. Charts used courtesy of www.stockcharts.com
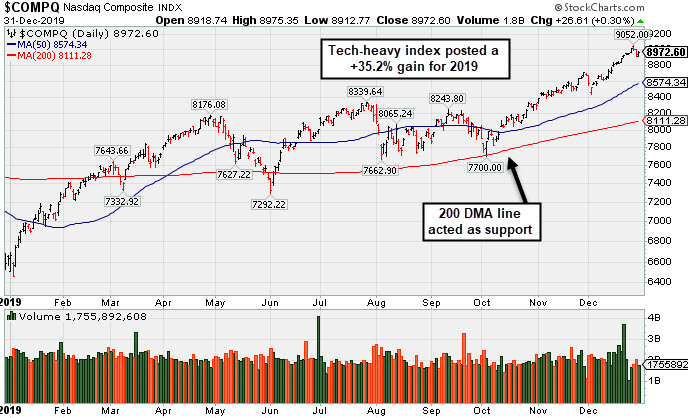
PICTURED: The tech-heavy Nasdaq Composite Index tallied a +35.2% gain for the year and is perched near its record high.
In trade news, President Trump announced plans to sign the “phase one” accord with China on January 15th, stating that “phase two” negotiations would follow in Beijing.
Treasuries weakened with the yield on the 10-year note up four basis point to 1.92%, though down from 2018’s closing level of 2.68%. In commodities, WTI crude slipped nearly 1% to $61.15/barrel, still realizing its best annual gain since 2016. COMEX gold notched its strongest year since 2010, while the U.S. Dollar Index experienced its smallest-ever annual move, rising just 0.2%.
All 11 S&P 500 sectors ended 2019 in positive territory. Technology stocks soared 48%, the group’s best performance in a decade. Energy shares lagged on a relative basis, rising a modest 7.6%.
On the data front, the Conference Board’s gauge of consumer confidence declined to 126.5 in December from an upwardly revised 126.8 reading in November. Separately, a release from S&P CoreLogic Case Shiller revealed that home prices in 20 U.S. cities rose the most in five months in October.
|
 Kenneth J. Gruneisen started out as a licensed stockbroker in August 1987, a couple of months prior to the historic stock market crash that took the Dow Jones Industrial Average down -22.6% in a single day. He has published daily fact-based fundamental and technical analysis on high-ranked stocks online for two decades. Through FACTBASEDINVESTING.COM, Kenneth provides educational articles, news, market commentary, and other information regarding proven investment systems that work in good times and bad.
Comments contained in the body of this report are technical opinions only and are not necessarily those of Gruneisen Growth Corp. The material herein has been obtained from sources believed to be reliable and accurate, however, its accuracy and completeness cannot be guaranteed. Our firm, employees, and customers may effect transactions, including transactions contrary to any recommendation herein, or have positions in the securities mentioned herein or options with respect thereto. Any recommendation contained in this report may not be suitable for all investors and it is not to be deemed an offer or solicitation on our part with respect to the purchase or sale of any securities. |
|
 |
Tech Strength Underpinned Market Gains
Kenneth J. Gruneisen - Passed the CAN SLIM® Master's Exam
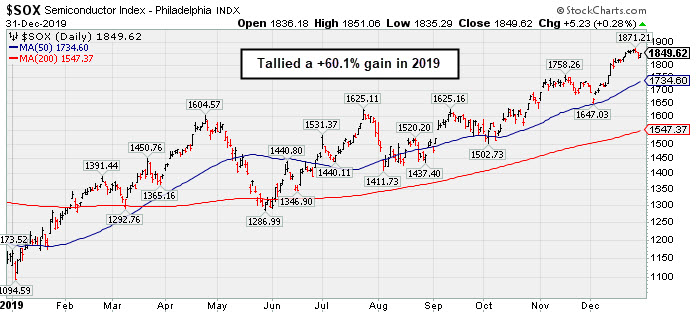
The Retail Index ($RLX +0.10%), Bank Index ($BKX +0.24%) posted small gains and the Broker/Dealer Index ($XBD +0.06%) finished flat. The tech sector had a positive bias as the Biotech Index ($BTK +0.37%), Semiconductor Index ($SOX +0.28%), and the Networking Index ($NWX +0.23%) each posted a modest gain. The Gold & Silver Index ($XAU -0.23%) edged lower and the Oil Services Index ($OSX -1.46%) fell, meanwhile, the Integrated Oil Index ($XOI +0.90%) rose.
PICTURED: The Semiconductor Index ($SOX +0.28%) tallied a +60.1% gain in 2019.
| Oil Services |
$OSX |
78.29 |
-1.16 |
-1.46% |
-2.87% |
| Integrated Oil |
$XOI |
1,270.55 |
+11.29 |
+0.90% |
+9.61% |
| Semiconductor |
$SOX |
1,849.62 |
+5.23 |
+0.28% |
+60.12% |
| Networking |
$NWX |
583.41 |
+1.37 |
+0.24% |
+19.39% |
| Broker/Dealer |
$XBD |
290.38 |
+0.17 |
+0.06% |
+22.35% |
| Retail |
$RLX |
2,449.27 |
+2.44 |
+0.10% |
+25.51% |
| Gold & Silver |
$XAU |
106.92 |
-0.25 |
-0.23% |
+51.32% |
| Bank |
$BKX |
113.36 |
+0.27 |
+0.24% |
+32.14% |
| Biotech |
$BTK |
5,067.45 |
+18.54 |
+0.37% |
+20.06% |
|
|
|
 |
Featured Stocks
Kenneth J. Gruneisen - Passed the CAN SLIM® Master's Exam
See the Featured Stocks with most recent note below. Feel free to contact us if you have a need for any additional information. |
|
|
Color Codes Explained :
Y - Better candidates highlighted by our
staff of experts.
G - Previously featured
in past reports as yellow but may no longer be buyable under the
guidelines.
***Last / Change / Volume data in this table is the closing quote data***
Symbol/Exchange
Company Name
Industry Group |
PRICE |
CHANGE
(%Change) |
Day High |
Volume
(% DAV)
(% 50 day avg vol) |
52 Wk Hi
% From Hi |
Featured
Date |
Price
Featured |
Pivot Featured |
|
Max Buy |
 MLR
-
NYSE
MLR
-
NYSE
Miller Industries Inc
AUTOMOTIVE - Auto Parts
|
$37.13
|
-0.26
-0.70% |
$37.63
|
26,298
55.95% of 50 DAV
50 DAV is 47,000
|
$38.18
-2.75%
|
9/24/2019
|
$34.00
|
PP = $35.36
|
|
MB = $37.13
|
Most Recent Note - 12/27/2019 5:34:15 PM
G - Still hovering near its 52-week high and just above its "max buy" level. Prior highs in the $35 area define initial support along with its 50 DMA line ($35.74). Resilient after reporting Sep '19 earnings which were below the fundamental guidelines of the fact-based investment system. See the latest FSU analysis for more details and a new annotated graph.
>>> FEATURED STOCK ARTICLE : Towing/Recovery Equipment Firm Remains Perched Near Record High - 12/27/2019 |
View all notes |
Set NEW NOTE alert |
Company Profile |
SEC
News |
Chart |
Request a new note
C
A
S
I |
CCBG
-
NASDAQ
Capital City Bk Gp
BANKING - Regional - Mid-Atlantic Banks
|
$30.50
|
-0.07
-0.23% |
$30.64
|
105,627
240.06% of 50 DAV
50 DAV is 44,000
|
$30.95
-1.45%
|
12/16/2019
|
$30.07
|
PP = $30.95
|
|
MB = $32.50
|
Most Recent Note - 12/26/2019 11:53:30 AM
Y - Perched within close striking distance of its 52-week high, recently meeting resistance. Subsequent gains and a strong close above the new pivot point cited based on its 11/06/19 high plus 10 cents may trigger a new (or add-on) technical buy signal. Found support at its 50 DMA line ($29.20) during its orderly consolidation.
>>> FEATURED STOCK ARTICLE : Found Support at 50-Day Moving Average - 12/10/2019 |
View all notes |
Set NEW NOTE alert |
Company Profile |
SEC
News |
Chart |
Request a new note
C
A
S
I |
FTNT
-
NASDAQ
Fortinet Inc
Computer Sftwr-Security
|
$106.76
|
-0.19
-0.18% |
$107.65
|
726,595
53.07% of 50 DAV
50 DAV is 1,369,000
|
$110.28
-3.19%
|
12/9/2019
|
$103.85
|
PP = $106.10
|
|
MB = $111.41
|
Most Recent Note - 12/30/2019 6:27:03 PM
Y - Volume totals have been cooling while stubbornly holding its ground near its 52-week high. Confirming gains above the pivot point backed by at least +40% above average volume are needed to trigger a convincing technical buy signal. Its 50 DMA line ($98.09) and prior high in the $97 area define important near-term support to watch.
>>> FEATURED STOCK ARTICLE : Endured Distributional Pressure While Perched at High - 12/23/2019 |
View all notes |
Set NEW NOTE alert |
Company Profile |
SEC
News |
Chart |
Request a new note
C
A
S
I |
SPSC
-
NASDAQ
S P S Commerce Inc
COMPUTER SOFTWARE and SERVICES - Application Software
|
$55.42
|
+0.08
0.14% |
$55.83
|
139,322
68.87% of 50 DAV
50 DAV is 202,300
|
$59.14
-6.29%
|
11/29/2019
|
$56.59
|
PP = $59.24
|
|
MB = $62.20
|
Most Recent Note - 12/26/2019 5:25:46 PM
Y - Still perched -4.5% off its all-time high. Subsequent gains above its pivot point backed by at least +40% above average volume are needed to trigger a new technical buy signal. Fundamentals remain strong.
>>> FEATURED STOCK ARTICLE : Perched Within Close Striking Distance of 52-Week High - 12/20/2019 |
View all notes |
Set NEW NOTE alert |
Company Profile |
SEC
News |
Chart |
Request a new note
C
A
S
I |
AUDC
-
NASDAQ
Audiocodes Ltd
ELECTRONICS - Scientific and Technical Instrum
|
$25.69
|
+0.61
2.43% |
$25.95
|
238,335
88.93% of 50 DAV
50 DAV is 268,000
|
$26.00
-1.19%
|
9/13/2019
|
$19.68
|
PP = $19.84
|
|
MB = $20.83
|
Most Recent Note - 12/30/2019 6:21:42 PM
G - Perched at its all-time high, stubbornly holding its ground very extended from the previously noted base. Prior highs in the $22 area define support along with its 50 DMA line ($22.78). Fundamentals remain strong.
>>> FEATURED STOCK ARTICLE : Reversed Into Red After Hitting Yet Another New High - 12/13/2019 |
View all notes |
Set NEW NOTE alert |
Company Profile |
SEC
News |
Chart |
Request a new note
C
A
S
I |
Symbol/Exchange
Company Name
Industry Group |
PRICE |
CHANGE
(%Change) |
Day High |
Volume
(% DAV)
(% 50 day avg vol) |
52 Wk Hi
% From Hi |
Featured
Date |
Price
Featured |
Pivot Featured |
|
Max Buy |
CHDN
-
NASDAQ
Churchill Downs Inc
LEISURE - Gaming Activities
|
$137.20
|
-0.06
-0.04% |
$138.17
|
317,013
115.70% of 50 DAV
50 DAV is 274,000
|
$137.47
-0.20%
|
10/8/2019
|
$129.77
|
PP = $132.83
|
|
MB = $139.47
|
Most Recent Note - 12/30/2019 6:23:21 PM
G - Posted a 3rd consecutive gain today with light volume while hitting a new 52-week high. Its 50 DMA line ($130.63) defines near-term support above the prior low ($121.81 on 11/07/19) The Jun and Sep '19 quarterly earnings versus the year ago periods were both below the +25% minimum guideline (C criteria) and raised fundamental concerns. See the latest FSU analysis for more details and a new annotated graph.
>>> FEATURED STOCK ARTICLE : Touched a New HIgh With Gains Backed by Light Volume - 12/30/2019 |
View all notes |
Set NEW NOTE alert |
Company Profile |
SEC
News |
Chart |
Request a new note
C
A
S
I |
LULU
-
NASDAQ
Lululemon Athletica
MANUFACTURING - Textile Manufacturing
|
$231.67
|
+0.84
0.36% |
$232.00
|
936,609
45.87% of 50 DAV
50 DAV is 2,042,000
|
$235.50
-1.63%
|
9/6/2019
|
$201.25
|
PP = $194.35
|
|
MB = $204.07
|
Most Recent Note - 12/30/2019 6:28:24 PM
G - Extended from any sound base, and its 50 DMA line ($217) defines near-term support above the prior high ($209). Recently reported earnings +28% on +23% sales revenues for the Oct '19 quarter.
>>> FEATURED STOCK ARTICLE : Retreated From High After Another Strong Earnings Report - 12/17/2019 |
View all notes |
Set NEW NOTE alert |
Company Profile |
SEC
News |
Chart |
Request a new note
C
A
S
I |
CPRT
-
NASDAQ
Copart Inc
SPECIALTY RETAIL - Auto Dealerships
|
$90.94
|
+0.08
0.09% |
$91.34
|
1,119,528
59.96% of 50 DAV
50 DAV is 1,867,000
|
$92.41
-1.59%
|
9/5/2019
|
$79.13
|
PP = $79.84
|
|
MB = $83.83
|
Most Recent Note - 12/26/2019 11:43:54 AM
G - Consolidating in a tight range well above its 50 DMA line ($86.17) which defines near-term support. Fundamentals remain strong.
>>> FEATURED STOCK ARTICLE : Extended From Prior Base and Hovering Near Record High - 12/12/2019 |
View all notes |
Set NEW NOTE alert |
Company Profile |
SEC
News |
Chart |
Request a new note
C
A
S
I |
NMIH
-
NASDAQ
N M I Holdings Inc Cl A
Finance-MrtgandRel Svc
|
$33.18
|
+0.19
0.58% |
$33.40
|
423,148
83.46% of 50 DAV
50 DAV is 507,000
|
$35.79
-7.29%
|
11/8/2019
|
$32.89
|
PP = $31.44
|
|
MB = $33.01
|
Most Recent Note - 12/26/2019 11:42:29 AM
G - Consolidating above its "max buy" level. Its 50 DMA line ($32.09) and prior highs in the $30-31 area define important near-term support. Fundamentals remain strong.
>>> FEATURED STOCK ARTICLE : Hit New High But Encountered Distributional Pressure - 12/19/2019 |
View all notes |
Set NEW NOTE alert |
Company Profile |
SEC
News |
Chart |
Request a new note
C
A
S
I |
SPLK
-
NASDAQ
Splunk Inc
Computer Sftwr-Database
|
$149.77
|
+0.82
0.55% |
$150.03
|
846,238
41.50% of 50 DAV
50 DAV is 2,039,000
|
$153.66
-2.53%
|
11/25/2019
|
$147.79
|
PP = $142.16
|
|
MB = $149.27
|
Most Recent Note - 12/30/2019 6:30:50 PM
Y - Color code is changed to yellow while consolidating just below its "max buy" level with losses on light volume. Prior highs in the $142-143 area define initial support to watch on pullbacks.
>>> FEATURED STOCK ARTICLE : Consolidating Above Prior Highs Following Impressive Rally - 12/16/2019 |
View all notes |
Set NEW NOTE alert |
Company Profile |
SEC
News |
Chart |
Request a new note
C
A
S
I |
Symbol/Exchange
Company Name
Industry Group |
PRICE |
CHANGE
(%Change) |
Day High |
Volume
(% DAV)
(% 50 day avg vol) |
52 Wk Hi
% From Hi |
Featured
Date |
Price
Featured |
Pivot Featured |
|
Max Buy |
PAYC
-
NYSE
Paycom Software Inc
COMPUTER SOFTWARE and SERVICES - Application Software
|
$264.76
|
+2.34
0.89% |
$265.44
|
663,366
118.88% of 50 DAV
50 DAV is 558,000
|
$279.95
-5.43%
|
11/20/2019
|
$252.97
|
PP = $259.81
|
|
MB = $272.80
|
Most Recent Note - 12/30/2019 6:29:35 PM
Y - Still consolidating above its pivot point and below its "max buy" level. Fundamentals remain strong.
>>> FEATURED STOCK ARTICLE : Consolidating Near Prior Highs Which Define Initial Support - 12/11/2019 |
View all notes |
Set NEW NOTE alert |
Company Profile |
SEC
News |
Chart |
Request a new note
C
A
S
I |
BLD
-
NYSE
Topbuild Corp
Bldg-Constr Prds/Misc
|
$103.08
|
+0.33
0.32% |
$103.55
|
207,237
70.25% of 50 DAV
50 DAV is 295,000
|
$113.74
-9.37%
|
12/9/2019
|
$109.71
|
PP = $113.84
|
|
MB = $119.53
|
Most Recent Note - 12/30/2019 6:32:22 PM
G - A rebound above its 50 DMA line ($105.87) still is needed for its outlook to improve.
>>> FEATURED STOCK ARTICLE : Recent Slump Below 50-Day Moving Average Did Technical Damage - 12/24/2019 |
View all notes |
Set NEW NOTE alert |
Company Profile |
SEC
News |
Chart |
Request a new note
C
A
S
I |
GLOB
-
NYSE
Globant SA
Computer-Tech Services
|
$106.05
|
-0.05
-0.05% |
$106.40
|
109,950
39.69% of 50 DAV
50 DAV is 277,000
|
$112.33
-5.59%
|
11/14/2019
|
$106.87
|
PP = $112.43
|
|
MB = $118.05
|
Most Recent Note - 12/27/2019 5:39:03 PM
G - Perched only -3.9% off its 52-week high. Subsequent gains above the pivot point backed by at least +40% above average volume are needed to trigger a technical buy signal. Its 50 DMA line ($100) defines important near-term support to watch on pullbacks. Fundamentals remain strong. See the latest FSU analysis for more details and an annotated graph.
>>> FEATURED STOCK ARTICLE : Rebound Has Globant Perched Within Striking Distance of High - 12/26/2019 |
View all notes |
Set NEW NOTE alert |
Company Profile |
SEC
News |
Chart |
Request a new note
C
A
S
I |
|
|
|
THESE ARE NOT BUY RECOMMENDATIONS!
Comments contained in the body of this report are technical
opinions only. The material herein has been obtained
from sources believed to be reliable and accurate, however,
its accuracy and completeness cannot be guaranteed.
This site is not an investment advisor, hence it does
not endorse or recommend any securities or other investments.
Any recommendation contained in this report may not
be suitable for all investors and it is not to be deemed
an offer or solicitation on our part with respect to
the purchase or sale of any securities. All trademarks,
service marks and trade names appearing in this report
are the property of their respective owners, and are
likewise used for identification purposes only.
This report is a service available
only to active Paid Premium Members.
You may opt-out of receiving report notifications
at any time. Questions or comments may be submitted
by writing to Premium Membership Services 665 S.E. 10 Street, Suite 201 Deerfield Beach, FL 33441-5634 or by calling 1-800-965-8307
or 954-785-1121.
|
|
|