You are not logged in.
This means you
CAN ONLY VIEW reports that were published prior to Saturday, February 17, 2024.
You
MUST UPGRADE YOUR MEMBERSHIP if you want to see any current reports.
AFTER MARKET UPDATE - MONDAY, DECEMBER 27TH, 2021
Previous After Market Report Next After Market Report >>>
|
|
|
|
DOW |
+351.82 |
36,302.38 |
+0.98% |
|
Volume |
615,600,677 |
-14% |
|
Volume |
3,700,210,900 |
-8% |
|
NASDAQ |
+217.89 |
15,871.26 |
+1.39% |
|
Advancers |
2,204 |
67% |
|
Advancers |
2,374 |
51% |
|
S&P 500 |
+65.40 |
4,791.19 |
+1.38% |
|
Decliners |
1,068 |
33% |
|
Decliners |
2,278 |
49% |
|
Russell 2000 |
+19.88 |
2,261.46 |
+0.89% |
|
52 Wk Highs |
134 |
|
|
52 Wk Highs |
130 |
|
|
S&P 600 |
+19.92 |
1,407.29 |
+1.44% |
|
52 Wk Lows |
43 |
|
|
52 Wk Lows |
198 |
|
|
 |
Major Average Rose With Light Volume Behind Recent Gains
Kenneth J. Gruneisen - Passed the CAN SLIM® Master's Exam
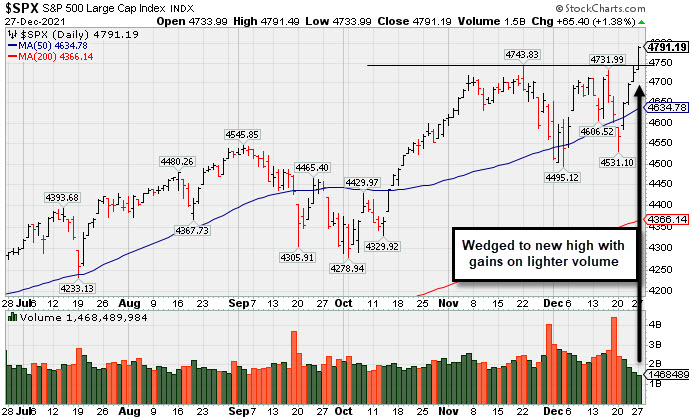
The S&P 500 climbed 1.4% to its 69th record closing high of 2021. The Dow jumped 351 points, while the Nasdaq Composite rallied 1.4%. The volume totals reported were lighter than the prior session on the NYSE and on the Nasdaq exchange. Breadth was positive as advancers led decliners by a 2-1 margin on the NYSE but the mix was nearly even on the Nasdaq exchange. Leadership improved as there were 77 high-ranked companies from the Leaders List that hit new 52-week highs and were listed on the BreakOuts Page, versus the total of 40 on the prior session. New 52-week highs solidly outnumbered new 52-week lows on the NYSE, but new lows still outnumbered new highs on the Nasdaq exchange. The market averages (M criteria) are in a confirmed uptrend. New buying efforts are to be carefully made under the fact-based investment system's strict criteria.
 PICTURED: The S&P 500 Index posted a 4th consecutive gain with lighter volume as it rose into new all-time high territory, continuing to extended the prior uptrend.
U.S. stocks closed firmly higher on Monday, extending gains into a fourth consecutive session. Trading volume was roughly 35% below the trailing 30-day average. Seasonality trends should aid risk assets this week, with Wall Street hoping for a Santa Claus rally. Historically, during the final five trading days in a year, the S&P 500 has been positive nearly 80% of the time since 1928, according to the Stock Trader’s Almanac.
All 11 S&P 500 sectors finished in positive territory, with Energy and Technology stocks pacing the gains. Mega-cap stocks also outperformed, with Apple (AAPL + 2.30%) rising to end within striking distance of a $3 trillion market capitalization valuation. Tesla (TSLA +2.52%) rose, notching its best four-day stretch since March. Meanwhile, travel-related shares declined as flight cancellations over the holiday weekend due to the Omicron COVID-19 variant weighed on the industry. Elsewhere, GoDaddy Inc. (GDDY +8.36%) rose after activist investor Starboard Value reportedly acquired a $800 million stake in the company.
Treasuries fluctuated, with the yield on the 10-year note down one basis point (0.01%) to 1.48%. The two-year note rate added one basis point to 0.70% following soft demand for a $56 billion auction of the maturity. On the data front, today’s lone update showed a gauge of manufacturing activity in the Dallas region unexpectedly fell to a three-month low in December. In commodities, WTI crude jumped 2.8% to $75.83/barrel. |
 Kenneth J. Gruneisen started out as a licensed stockbroker in August 1987, a couple of months prior to the historic stock market crash that took the Dow Jones Industrial Average down -22.6% in a single day. He has published daily fact-based fundamental and technical analysis on high-ranked stocks online for two decades. Through FACTBASEDINVESTING.COM, Kenneth provides educational articles, news, market commentary, and other information regarding proven investment systems that work in good times and bad.
Comments contained in the body of this report are technical opinions only and are not necessarily those of Gruneisen Growth Corp. The material herein has been obtained from sources believed to be reliable and accurate, however, its accuracy and completeness cannot be guaranteed. Our firm, employees, and customers may effect transactions, including transactions contrary to any recommendation herein, or have positions in the securities mentioned herein or options with respect thereto. Any recommendation contained in this report may not be suitable for all investors and it is not to be deemed an offer or solicitation on our part with respect to the purchase or sale of any securities. |
|
 |
Financial, Energy, Semi, and Networking Indexes Led Group Gainers
Kenneth J. Gruneisen - Passed the CAN SLIM® Master's Exam
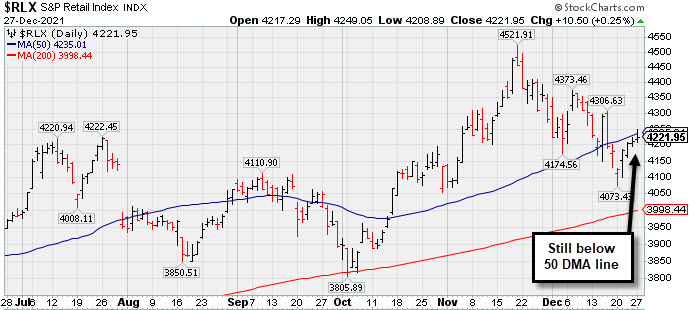
Financials had a positive influence on the major averages as the Broker/Dealer Index ($XBD +1.31%) and Bank Index ($BKX +1.15%) both posted solid gains. The Retail Index ($RLX +0.25%) inched higher. The Semiconductor Index ($SOX +2.72%) and Networking Index ($NWX +2.35%) both posted solid gains, meanwhile the Biotech Index ($BTK -1.06%) ended lower. The Oil Services Index ($OSX +1.43%) and Integrated Oil Index ($XOI +2.36%) both posted solid gains. The Gold & Silver Index ($XAU +0.12%) was little changed.PICTURED: The Retail Index ($RLX +0.25%) posted a 4th consecutive gain but remains below its 50-day moving average (DMA) line.
| Oil Services |
$OSX |
53.94 |
+0.76 |
+1.43% |
+21.67% |
| Integrated Oil |
$XOI |
1,194.38 |
+27.49 |
+2.36% |
+50.71% |
| Semiconductor |
$SOX |
4,039.51 |
+107.12 |
+2.72% |
+44.50% |
| Networking |
$NWX |
978.46 |
+22.48 |
+2.35% |
+36.44% |
| Broker/Dealer |
$XBD |
495.32 |
+6.39 |
+1.31% |
+31.18% |
| Retail |
$RLX |
4,221.95 |
+10.50 |
+0.25% |
+18.49% |
| Gold & Silver |
$XAU |
130.77 |
+0.16 |
+0.12% |
-9.31% |
| Bank |
$BKX |
132.83 |
+1.51 |
+1.15% |
+35.66% |
| Biotech |
$BTK |
5,589.88 |
-59.65 |
-1.06% |
-2.60% |
|
|
|
 |
Forming New Base After Finding Prompt Support at 50 DMA
Kenneth J. Gruneisen - Passed the CAN SLIM® Master's Exam
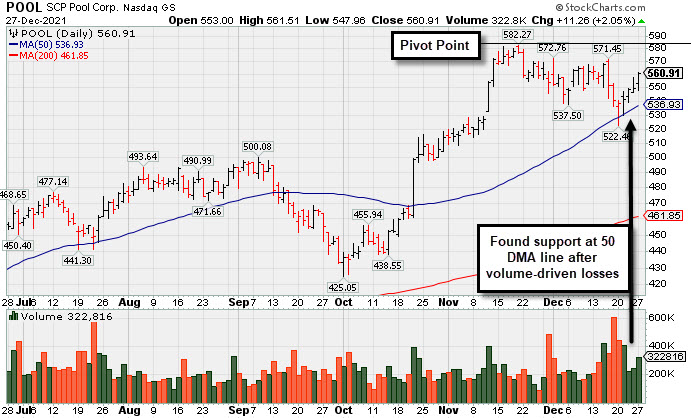
Pool Corp (POOL +$11.26 or +2.05% to $560.91) was highlighted in yellow with new pivot point cited based on its 11/19/21 high plus 10 cents in the earlier mid-day report (read here). Subsequent gains above the pivot point backed by at least +40% above average volume may trigger a new technical buy signal.
POOL found support at its 50-day moving average (DMA) line ($537) during the recent consolidation. It showed resilience since dropped from the Featured Stocks list on 10/04/21. POOL was last shown in in this FSU section on 9/08/21 with an annotated graph under the headline "Touched New High With a Gain on Light Volume". Fundamentals remain strong, as the past 5 quarterly comparisons through Sep '21 were well above the +25% minimum earnings guideline (C criteria), helping it match the fact-based investment system's fundamental guidelines. It has an Earnings Per Share Rating of 97.
The high-ranked Retail - Leisure Products firm has seen the number of top-rated funds owning its shares rise from 813 in Jun '20 to 1,560 in Sep '21, a reassuring sign concerning the I criteria. Its current Up/Down Volume Ratio of 1.4 is an unbiased indication its shares have been under accumulation over the past 50 days. It has a Timeliness rating of A and Sponsorship Rating of B. Its small supply of only 40.1 million shares outstanding (S criteria) can contribute to greater price volatility in the event of institutional buying or selling.
|
|
|
Color Codes Explained :
Y - Better candidates highlighted by our
staff of experts.
G - Previously featured
in past reports as yellow but may no longer be buyable under the
guidelines.
***Last / Change / Volume data in this table is the closing quote data***
Symbol/Exchange
Company Name
Industry Group |
PRICE |
CHANGE
(%Change) |
Day High |
Volume
(% DAV)
(% 50 day avg vol) |
52 Wk Hi
% From Hi |
Featured
Date |
Price
Featured |
Pivot Featured |
|
Max Buy |
 BLDR
-
NYSE
BLDR
-
NYSE
Builders Firstsource Inc
Bldg-Constr Prds/Misc
|
$84.31
|
+2.16
2.63% |
$84.43
|
2,360,437
92.39% of 50 DAV
50 DAV is 2,555,000
|
$82.90
1.70%
|
8/12/2021
|
$52.38
|
PP = $54.09
|
|
MB = $56.79
|
 Most Recent Note - 12/27/2021 5:27:27 PM
G - Posted a 4th consecutive gain today with near average volume and hit another new all-time high. Very extended from any sound base. Reported Sep '21 quarterly earnings +308% on +140% sales revenues versus the year ago period. It is well above its 50 DMA line ($69) defines near-term support to watch.
>>> FEATURED STOCK ARTICLE : Perched at Record High After +52% Rally in 4 Months - 12/10/2021 |
View all notes |
Set NEW NOTE alert |
Company Profile |
SEC
News |
Chart |
Request a new note
C
A
S
I |
KFRC
-
NASDAQ
Kforce Inc
Comml Svcs-Staffing
|
$76.99
|
+1.41
1.87% |
$76.99
|
59,891
53.47% of 50 DAV
50 DAV is 112,000
|
$81.47
-5.50%
|
9/10/2021
|
$59.53
|
PP = $64.48
|
|
MB = $67.70
|
Most Recent Note - 12/21/2021 6:06:19 PM
G - Prior low ($71.05 on 12/14/21) defines important near-term support after finding prompt support at its 50 DMA line ($72.25). Recently reported Sep '21 quarterly earnings +8% on +10% sales revenues versus the year ago period, below the +25% minimum earnings guideline (C criteria), raising fundamental concerns.
>>> FEATURED STOCK ARTICLE : Extended From Base and Latest Quarter Earnings Growth Sub Par - 11/19/2021 |
View all notes |
Set NEW NOTE alert |
Company Profile |
SEC
News |
Chart |
Request a new note
C
A
S
I |
REGN
-
NASDAQ
Regeneron Pharmaceutical
DRUGS - Biotechnology
|
$634.77
|
+9.39
1.50% |
$636.36
|
443,330
54.73% of 50 DAV
50 DAV is 810,100
|
$686.62
-7.55%
|
12/13/2021
|
$647.95
|
PP = $686.72
|
|
MB = $721.06
|
Most Recent Note - 12/22/2021 5:20:53 PM
Y - Posted a gain today with below average volume, it halted its slide after recent volume-driven losses undercut its 50 DMA line ($622) raising concerns. Color code was recently changed to yellow with new pivot point cited based on its 9/01/21 high plus 10 cents. Subsequent gains above the pivot point backed by at least +40% above average volume may trigger a technical buy signal. Its Relative Strength rating has slumped to 80, right at the 80+ minimum guideline for buy candidates.
>>> FEATURED STOCK ARTICLE : Consolidating Near All-Time High With Little Resistance Remaining - 12/13/2021 |
View all notes |
Set NEW NOTE alert |
Company Profile |
SEC
News |
Chart |
Request a new note
C
A
S
I |
LLY
-
NYSE
Eli Lilly & Co
Medical-Diversified
|
$278.41
|
+5.31
1.94% |
$280.30
|
1,673,680
52.22% of 50 DAV
50 DAV is 3,205,000
|
$283.91
-1.94%
|
12/16/2021
|
$279.28
|
PP = $275.97
|
|
MB = $289.77
|
Most Recent Note - 12/23/2021 5:35:38 PM
Y - Posted a quiet 3rd consecutive gain today, closing the week perched near its all-time high. Finished strong after highlighted in yellow in the 12/16/21 mid-day report with pivot point cited based on its 8/17/21 high plus 10 cents. This giant Medical - Diversified firm triggered a technical buy signal as it powered to new all-time highs with +78% above average volume behind its 5th consecutive gain after a choppy 17-week consolidation. Reported Sep '21 quarterly earnings +38% on +18% sales revenues versus the year ago period, and 3 of the past 4 quarterly comparisons were above the +25% minimum earnings guideline (C criteria). Annual earnings (A criteria) improved steadily since a downturn in FY '14.
>>> FEATURED STOCK ARTICLE : Eli Lilly & Co Powered to New Highs With Volume - 12/16/2021 |
View all notes |
Set NEW NOTE alert |
Company Profile |
SEC
News |
Chart |
Request a new note
C
A
S
I |
CAMT
-
NASDAQ
Camtek Ltd
ELECTRONICS - Scientific and Technical Instrum
|
$45.41
|
+1.61
3.68% |
$45.92
|
214,767
82.60% of 50 DAV
50 DAV is 260,000
|
$49.60
-8.45%
|
11/9/2021
|
$45.43
|
PP = $46.11
|
|
MB = $48.42
|
Most Recent Note - 12/27/2021 5:16:01 PM
G - Posted a 4th consecutive quiet gain today, consolidating above its 50 DMA line ($43). Faces some resistance due to overhead supply up to the $49 level. Fundamentals remain strong.
>>> FEATURED STOCK ARTICLE : Closed Above 50-Day Average After Big Gain With Light Volume - 12/15/2021 |
View all notes |
Set NEW NOTE alert |
Company Profile |
SEC
News |
Chart |
Request a new note
C
A
S
I |
Symbol/Exchange
Company Name
Industry Group |
PRICE |
CHANGE
(%Change) |
Day High |
Volume
(% DAV)
(% 50 day avg vol) |
52 Wk Hi
% From Hi |
Featured
Date |
Price
Featured |
Pivot Featured |
|
Max Buy |
AMD
-
NASDAQ
Advanced Micro Devices
ELECTRONICS - Semiconductor - Broad Line
|
$154.36
|
+8.22
5.62% |
$154.89
|
53,094,847
92.33% of 50 DAV
50 DAV is 57,505,000
|
$164.46
-6.14%
|
10/27/2021
|
$124.91
|
PP = $122.59
|
|
MB = $128.72
|
Most Recent Note - 12/27/2021 5:14:47 PM
G - Posted another big gain today with below average volume. It has not formed a sound base of sufficient length but rallied after its 50 DMA line ($139) recently acted as support. Any violation may trigger a technical sell signal. Fundamentals remain strong after it reported Sep '21 quarterly earnings +78% on +54% sales revenues versus the year ago period.
>>> FEATURED STOCK ARTICLE : AMD Pulling Back After Considerable Rally - 12/1/2021 |
View all notes |
Set NEW NOTE alert |
Company Profile |
SEC
News |
Chart |
Request a new note
C
A
S
I |
UMC
-
NYSE
United Microelectrnc Adr
ELECTRONICS - Semiconductor - Integrated Cir
|
$11.81
|
+0.23
1.99% |
$11.84
|
4,549,489
57.26% of 50 DAV
50 DAV is 7,946,000
|
$12.68
-6.86%
|
12/1/2021
|
$12.60
|
PP = $12.72
|
|
MB = $13.36
|
Most Recent Note - 12/21/2021 6:02:20 PM
Y - Posted a gain today with lighter volume. Recently retesting support near its 50 DMA line ($11.09). More damaging losses would raise concerns. A gain and solid close above the pivot point may help clinch a proper new (or add-on) technical buy signal. Reported Sep '21 quarterly earnings +100% on +30% sales revenues versus the year ago period.
>>> FEATURED STOCK ARTICLE : Rebound Above 50-Day Moving Average Showed Resilience - 11/30/2021 |
View all notes |
Set NEW NOTE alert |
Company Profile |
SEC
News |
Chart |
Request a new note
C
A
S
I |
ENTG
-
NASDAQ
Entegris Inc
ELECTRONICS - Semiconductor Equipment and Mate
|
$140.94
|
+4.16
3.04% |
$141.09
|
884,020
74.23% of 50 DAV
50 DAV is 1,191,000
|
$158.00
-10.80%
|
8/4/2021
|
$125.33
|
PP = $126.51
|
|
MB = $132.84
|
Most Recent Note - 12/27/2021 5:20:01 PM
G - Posted a 4th consecutive gain today with below average volume after damaging volume-driven losses. A rebound above the 50 DMA line ($143.45) is needed for its outlook to improve. Fundamentals remain strong after it recently reported Sep '21 quarterly earnings +37% on +20% sales revenues versus the year ago period.
>>> FEATURED STOCK ARTICLE : Best Ever Close After Volume-Driven Gain - 11/29/2021 |
View all notes |
Set NEW NOTE alert |
Company Profile |
SEC
News |
Chart |
Request a new note
C
A
S
I |
DHR
-
NYSE
Danaher Corp
Medical-Diversified
|
$327.41
|
+6.62
2.06% |
$327.89
|
1,028,453
38.59% of 50 DAV
50 DAV is 2,665,000
|
$333.96
-1.96%
|
12/16/2021
|
$321.36
|
PP = $334.06
|
|
MB = $350.76
|
Most Recent Note - 12/22/2021 5:24:03 PM
Y - Posted a gain today with below average volume, consolidating above its 50 DMA line and still perched within striking distance of its 52-week high. Highlighted in yellow with pivot point cited base on its 9/10/21 high plus 10 cents in the 12/16/21 mid-day report. Subsequent gains above the pivot point with at least +40% above average volume may trigger a technical buy signal. Fundamentals remain strong.
>>> FEATURED STOCK ARTICLE : Consolidating Near Prior Highs Above 50-Day Moving Average - 12/17/2021 |
View all notes |
Set NEW NOTE alert |
Company Profile |
SEC
News |
Chart |
Request a new note
C
A
S
I |
SKY
-
NYSE
Skyline Champion Corp
Bldg-Mobile/Mfg andamp; RV
|
$79.60
|
+3.39
4.45% |
$79.66
|
423,758
87.01% of 50 DAV
50 DAV is 487,000
|
$85.92
-7.36%
|
11/3/2021
|
$72.19
|
PP = $66.92
|
|
MB = $70.27
|
Most Recent Note - 12/27/2021 5:18:57 PM
G - It has not formed a sound new base after a streak of damaging losses. Below average volume was behind today's 4th consecutive gain as it rebounded further above the 50 DMA line ($74). Fundamentals remain strong.
>>> FEATURED STOCK ARTICLE : Pulling Back From All-Time High After Recent Rally - 12/14/2021 |
View all notes |
Set NEW NOTE alert |
Company Profile |
SEC
News |
Chart |
Request a new note
C
A
S
I |
Symbol/Exchange
Company Name
Industry Group |
PRICE |
CHANGE
(%Change) |
Day High |
Volume
(% DAV)
(% 50 day avg vol) |
52 Wk Hi
% From Hi |
Featured
Date |
Price
Featured |
Pivot Featured |
|
Max Buy |
DHI
-
NYSE
D R Horton Inc
MATERIALS and CONSTRUCTION - Residential Construction
|
$106.21
|
+1.29
1.23% |
$106.25
|
3,950,743
140.90% of 50 DAV
50 DAV is 2,804,000
|
$110.45
-3.84%
|
12/6/2021
|
$104.40
|
PP = $106.99
|
|
MB = $112.34
|
Most Recent Note - 12/27/2021 12:21:38 PM
Y - Volume totals have been cooling while hovering near its all-time high. Showed stalling action since highlighted in yellow with pivot point cited based on its 5/10/21 high plus 10 cents in the 12/06/21 mid-day report. Reported Sep '21 earnings +68% on +27% sales revenues versus the year-ago period, its 8th strong quarterly comparison above the +25% minimum guideline (C criteria). Annual earnings growth (A criteria) has been strong.
>>> FEATURED STOCK ARTICLE : Builder Built a Solid Base And Challenged Prior High - 12/6/2021 |
View all notes |
Set NEW NOTE alert |
Company Profile |
SEC
News |
Chart |
Request a new note
C
A
S
I |
TITN
-
NASDAQ
Titan Machinery Inc
SPECIALTY RETAIL
|
$33.28
|
+1.10
3.42% |
$33.34
|
194,568
112.47% of 50 DAV
50 DAV is 173,000
|
$38.58
-13.74%
|
11/23/2021
|
$36.22
|
PP = $35.34
|
|
MB = $37.11
|
Most Recent Note - 12/27/2021 5:22:39 PM
G - Posted a 4th consecutive gain today with higher volume. Found prompt support near its 50 DMA line ($31.69) but it has not formed a sound base and faces resistance due to overhead supply up to the $38 level. Reported Oct '21 quarterly earnings +81% on +26% sales revenues over the year ago period, its 4th strong quarterly comparison.
>>> FEATURED STOCK ARTICLE : Strong Close With Gain Backed by +467% Above Average Volume - 11/23/2021 |
View all notes |
Set NEW NOTE alert |
Company Profile |
SEC
News |
Chart |
Request a new note
C
A
S
I |
CLFD
-
NASDAQ
Clearfield Inc
TELECOMMUNICATIONS - Cables / Satalite Equipment
|
$84.11
|
+5.57
7.09% |
$84.43
|
373,942
274.96% of 50 DAV
50 DAV is 136,000
|
$79.25
6.13%
|
12/16/2021
|
$72.76
|
PP = $72.10
|
|
MB = $75.71
|
Most Recent Note - 12/27/2021 12:16:13 PM
G - Hitting yet another new all-time high with today's gain, and its color code is changed to green after getting extended beyond its "max buy" level. Prior high ($72) defines initial support to watch on pullbacks. Reported Sep '21 quarterly earnings +141% on +66% sales revenues above the year ago period.
>>> FEATURED STOCK ARTICLE : Perched Near High Extended From Any Sound Base - 11/22/2021 |
View all notes |
Set NEW NOTE alert |
Company Profile |
SEC
News |
Chart |
Request a new note
C
A
S
I |
ODFL
-
NASDAQ
Old Dominion Fght Line
TRANSPORTATION - Trucking
|
$355.60
|
+7.29
2.09% |
$355.87
|
269,428
43.32% of 50 DAV
50 DAV is 622,000
|
$373.58
-4.81%
|
12/7/2021
|
$365.61
|
PP = $364.17
|
|
MB = $382.38
|
Most Recent Note - 12/23/2021 5:37:35 PM
Y - Its color code is changed to yellow after a prompt rebound above the 50 DMA line ($344) this week helped its outlook improve. Still faces near term resistance up to the $373 level after several weeks of trading at higher levels.
>>> FEATURED STOCK ARTICLE : Perched at All Time High After Tight Consolidation Several Weeks - 12/7/2021 |
View all notes |
Set NEW NOTE alert |
Company Profile |
SEC
News |
Chart |
Request a new note
C
A
S
I |
POOL
-
NASDAQ
Pool Corp
WHOLESALE - Basic Materials Wholesale
|
$560.91
|
+11.26
2.05% |
$561.51
|
322,816
132.85% of 50 DAV
50 DAV is 243,000
|
$582.27
-3.67%
|
12/27/2021
|
$555.44
|
PP = $582.37
|
|
MB = $611.49
|
Most Recent Note - 12/27/2021 12:41:51 PM
Y - Color code is changed to yellow with new pivot point cited based on its 11/19/21 high plus 10 cents. Subsequent gains above the pivot point backed by at least +40% above average volume may trigger a new technical buy signal. Reported strong Sep '21 quarterly results and found support at its 50 DMA line ($537) during the recent consolidation. Showed resilience since dropped from the Featured Stocks list on 10/04/21.
>>> FEATURED STOCK ARTICLE : Forming New Base After Finding Prompt Support at 50 DMA - 12/27/2021 |
View all notes |
Set NEW NOTE alert |
Company Profile |
SEC
News |
Chart |
Request a new note
C
A
S
I |
Symbol/Exchange
Company Name
Industry Group |
PRICE |
CHANGE
(%Change) |
Day High |
Volume
(% DAV)
(% 50 day avg vol) |
52 Wk Hi
% From Hi |
Featured
Date |
Price
Featured |
Pivot Featured |
|
Max Buy |
SMPL
-
NASDAQ
Simply Good Foods Co
Food-Confectionery
|
$41.22
|
+0.45
1.10% |
$41.24
|
342,066
78.28% of 50 DAV
50 DAV is 437,000
|
$41.35
-0.31%
|
12/22/2021
|
$40.04
|
PP = $41.45
|
|
MB = $43.52
|
Most Recent Note - 12/22/2021 4:58:47 PM
Y - Color code is changed to yellow with new pivot point cited based on its 11/08/21 high plus 10 cents. Consolidating above its 50 DMA line ($38.22). The prior low and 200 DMA line ($35.62) define the next important support. See he latest FSU analysis for more details and a new annotated graph.
>>> FEATURED STOCK ARTICLE : Formed New 5-Week Base and Perched Near Pivot Point - 12/22/2021 |
View all notes |
Set NEW NOTE alert |
Company Profile |
SEC
News |
Chart |
Request a new note
C
A
S
I |
WDAY
-
NYSE
Workday Inc Cl A
Computer Sftwr-Enterprse
|
$279.35
|
+1.30
0.47% |
$280.91
|
1,040,748
64.76% of 50 DAV
50 DAV is 1,607,100
|
$307.81
-9.25%
|
9/7/2021
|
$275.69
|
PP = $282.87
|
|
MB = $297.01
|
Most Recent Note - 12/23/2021 5:30:18 PM
G - Its Relative Strength Rating has fallen to 73, below the 80+ minimum guideline for buy candidates while recently sputtering just below its 50 DMA line ($281.70). A rebound above the 50 DMA line is needed for its outlook to improve. Prior low ($258.22 on 12/06/21) and 200 DMA line ($254.52) define the next important support to watch. Reported Oct '21 quarterly earnings +28% on +20% sales revenues versus the year ago period. Fundamentals remain strong. See the latest FSU analysis for more details and a new annotated graph.
>>> FEATURED STOCK ARTICLE : Relative Strength Rating Fell While Sputtering Below 50 DMA Line - 12/23/2021 |
View all notes |
Set NEW NOTE alert |
Company Profile |
SEC
News |
Chart |
Request a new note
C
A
S
I |
TTD
-
NASDAQ
The Trade Desk Inc Cl A
Comml Svcs-Advertising
|
$97.68
|
+1.63
1.70% |
$98.60
|
2,100,048
38.88% of 50 DAV
50 DAV is 5,402,000
|
$114.09
-14.38%
|
11/9/2021
|
$95.16
|
PP = $90.00
|
|
MB = $94.50
|
Most Recent Note - 12/23/2021 5:33:24 PM
G - Today's gain with below average volume helped it rebound further above the prior high ($90) after finding prompt support near its 50 DMA line ($90). Recent resilience has helped its outlook improve, but it faces overhead supply up to the $114 level.
>>> FEATURED STOCK ARTICLE : Quietly Slumping Into Prior Base and Below 50-Day Moving Average - 12/20/2021 |
View all notes |
Set NEW NOTE alert |
Company Profile |
SEC
News |
Chart |
Request a new note
C
A
S
I |
MEDP
-
NASDAQ
Medpace Holdings Inc
Medical-Research Eqp/Svc
|
$227.90
|
+4.53
2.03% |
$228.04
|
147,707
85.38% of 50 DAV
50 DAV is 173,000
|
$231.00
-1.34%
|
9/10/2021
|
$196.32
|
PP = $196.22
|
|
MB = $206.03
|
Most Recent Note - 12/21/2021 6:11:26 PM
G - Found support near its 50 DMA line ($210) recently, and prior highs in the $199 area also define important near-term support to watch. More damaging losses may trigger a worrisome technical sell signal. Recently noted repeatedly - "Sep '21 earnings rose +18% on +28% sales revenues versus the year ago period, below the +25% minimum earnings guideline (C criteria), raising fundamental concerns.
>>> FEATURED STOCK ARTICLE : Medpace Hovering at High With Volume Totals Cooling - 11/17/2021 |
View all notes |
Set NEW NOTE alert |
Company Profile |
SEC
News |
Chart |
Request a new note
C
A
S
I |
AVTR
-
NYSE
Avantor Inc
Medical-Research Eqp/Svc
|
$41.96
|
+0.71
1.72% |
$42.04
|
1,550,240
40.12% of 50 DAV
50 DAV is 3,864,000
|
$44.37
-5.43%
|
12/27/2021
|
$41.96
|
PP = $44.47
|
|
MB = $46.69
|
Most Recent Note - 12/27/2021 5:26:44 PM
Y - Color code is changed to yellow with new pivot point cited based on its 9/23/21 high plus 10 cents. Posted a 4th consecutive gain today with lighter volume. Consolidating above its 50 DMA line ($39.16) and it faces little overhead supply up to the $44 level. Subsequent gains above the pivot point backed by at least +40% above average volume may trigger a new technical buy signal. Prior lows in the high $36 area define important near-term support. Reported Sep '21 quarterly earnings +46% above the year ago period.
>>> FEATURED STOCK ARTICLE : Rebounding With Volume-Driven Gains - 12/21/2021 |
View all notes |
Set NEW NOTE alert |
Company Profile |
SEC
News |
Chart |
Request a new note
C
A
S
I |
Symbol/Exchange
Company Name
Industry Group |
PRICE |
CHANGE
(%Change) |
Day High |
Volume
(% DAV)
(% 50 day avg vol) |
52 Wk Hi
% From Hi |
Featured
Date |
Price
Featured |
Pivot Featured |
|
Max Buy |
|
|
|
THESE ARE NOT BUY RECOMMENDATIONS!
Comments contained in the body of this report are technical
opinions only. The material herein has been obtained
from sources believed to be reliable and accurate, however,
its accuracy and completeness cannot be guaranteed.
This site is not an investment advisor, hence it does
not endorse or recommend any securities or other investments.
Any recommendation contained in this report may not
be suitable for all investors and it is not to be deemed
an offer or solicitation on our part with respect to
the purchase or sale of any securities. All trademarks,
service marks and trade names appearing in this report
are the property of their respective owners, and are
likewise used for identification purposes only.
This report is a service available
only to active Paid Premium Members.
You may opt-out of receiving report notifications
at any time. Questions or comments may be submitted
by writing to Premium Membership Services 665 S.E. 10 Street, Suite 201 Deerfield Beach, FL 33441-5634 or by calling 1-800-965-8307
or 954-785-1121.
|
|
|