You are not logged in.
This means you
CAN ONLY VIEW reports that were published prior to Monday, February 19, 2024.
You
MUST UPGRADE YOUR MEMBERSHIP if you want to see any current reports.
AFTER MARKET UPDATE - THURSDAY, DECEMBER 26TH, 2019
Previous After Market Report Next After Market Report >>>
|
|
|
|
DOW |
+105.94 |
28,621.39 |
+0.37% |
|
Volume |
542,120,040 |
+73% |
|
Volume |
1,619,314,815 |
+61% |
|
NASDAQ |
+69.51 |
9,022.39 |
+0.78% |
|
Advancers |
1,757 |
62% |
|
Advancers |
1,702 |
55% |
|
S&P 500 |
+16.53 |
3,239.91 |
+0.51% |
|
Decliners |
1,092 |
38% |
|
Decliners |
1,396 |
45% |
|
Russell 2000 |
-0.34 |
1,677.67 |
-0.02% |
|
52 Wk Highs |
175 |
|
|
52 Wk Highs |
216 |
|
|
S&P 600 |
-0.99 |
1,023.70 |
-0.10% |
|
52 Wk Lows |
7 |
|
|
52 Wk Lows |
27 |
|
|
 |
Major Indices Extend Record Highs as Rally Continues
Kenneth J. Gruneisen - Passed the CAN SLIM® Master's Exam
The Dow climbed 105 points, while the S&P 500 added 0.5%. The Nasdaq Composite rallied another 0.8% as the tech-heavy benchmark eclipsed 9,000 for the first time and extended its recent winning streak to 11 sessions. Advancers led decliners by more than a 3-2 margin on the NYSE and 5-4 on the Nasdaq exchange. The volume totals were much higher than the shortened prior session's totals on the NYSE and on the Nasdaq exchange. There were 50 high-ranked companies from the Leaders List that hit a new 52-week high and were listed on the BreakOuts Page, versus the total of 33 on the prior session. New 52-week highs totals expanded and easily outnumbered new 52-week lows totals on the NYSE and on the Nasdaq exchange. The major indices (M criteria) are in a "confirmed uptrend" after enduring distributional pressure in recent weeks. The Featured Stocks Page provides the most timely analysis on high-ranked leaders. Charts used courtesy of www.stockcharts.com
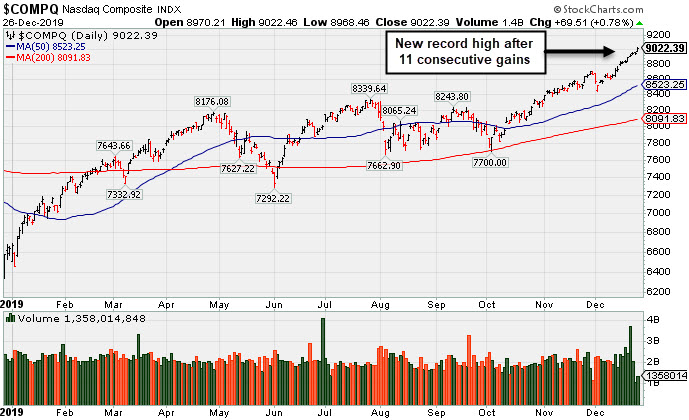
PICTURED: The Nasdaq Composite Index is perched at its record high after 11 consecutive gains.
U.S. stocks advanced on Thursday, with all three major averages finishing at fresh record highs. With just three trading days left in 2019, the S&P 500 is up 29.2% for the year, on track for its best annual return since 2013 when the index rallied 29.6%.
Ten of 11 S&P 500 sectors traded higher on the session. Consumer Discretionary stocks paced the gains, with Amazon (AMZN +4.45%) gaining after the e-commerce giant posted record sales over the holiday period.
Despite six less shopping days in the 2019 holiday season, total U.S. retail sales rose 3.4% from the same period last year, according to MasterCard's (MA +0.58%) SpendingPulse. The Communications sector also outperformed, with Facebook (FB +1.30%) and Google parent Alphabet (GOOGL +1.34%) each adding more than 1%. Health Care shares were the lone laggard, with Medtronic (MDT -1.05%) lower.
On the data front, a report showed that mortgage applications fell 5.3% in the most recent week. Another release showed that initial jobless claims fell to 222,000, below the previous week's 235,000 reading. Treasuries were mixed along the curve, with the yield on the 10-year off two basis points to 1.89%. In commodities, WTI crude rose another 0.9% to $61.68/barrel, leaving oil prices headed for their best monthly performance since January. COMEX gold ended 0.7% higher at $1,509.30/ounce.
|
 Kenneth J. Gruneisen started out as a licensed stockbroker in August 1987, a couple of months prior to the historic stock market crash that took the Dow Jones Industrial Average down -22.6% in a single day. He has published daily fact-based fundamental and technical analysis on high-ranked stocks online for two decades. Through FACTBASEDINVESTING.COM, Kenneth provides educational articles, news, market commentary, and other information regarding proven investment systems that work in good times and bad.
Comments contained in the body of this report are technical opinions only and are not necessarily those of Gruneisen Growth Corp. The material herein has been obtained from sources believed to be reliable and accurate, however, its accuracy and completeness cannot be guaranteed. Our firm, employees, and customers may effect transactions, including transactions contrary to any recommendation herein, or have positions in the securities mentioned herein or options with respect thereto. Any recommendation contained in this report may not be suitable for all investors and it is not to be deemed an offer or solicitation on our part with respect to the purchase or sale of any securities. |
|
 |
Retail Index Posted a Standout Gain
Kenneth J. Gruneisen - Passed the CAN SLIM® Master's Exam
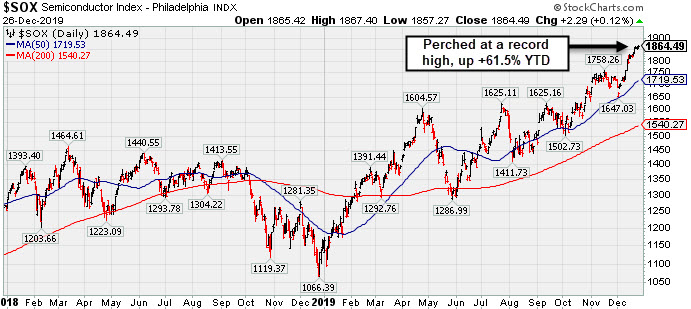
The Retail Index ($RLX +2.09%) was a standout gainer while the Bank Index ($BKX +0.60%) and the Broker/Dealer Index ($XBD +0.33%) posted smaller gains. The tech sector dragged lower by the Biotech Index ($BTK -1.58%) while the Semiconductor Index ($SOX +0.12%) and the Networking Index ($NWX +0.12%) both inched higher. The Gold & Silver Index ($XAU +1.36%) notched a solid gain, meanwhile, the Oil Services Index ($OSX -0.25%) and Integrated Oil Index ($XOI +0.18%) were mixed and little changed.
PICTURED: The 2-year graph of the Semiconductor Index ($SOX +0.12%) shows it perched at a record high, up +61.5% year-to-date.
| Oil Services |
$OSX |
79.39 |
-0.21 |
-0.26% |
-1.50% |
| Integrated Oil |
$XOI |
1,270.40 |
+2.28 |
+0.18% |
+9.60% |
| Semiconductor |
$SOX |
1,864.49 |
+2.29 |
+0.12% |
+61.40% |
| Networking |
$NWX |
585.96 |
+0.70 |
+0.12% |
+19.91% |
| Broker/Dealer |
$XBD |
292.23 |
+0.96 |
+0.33% |
+23.13% |
| Retail |
$RLX |
2,466.26 |
+50.39 |
+2.09% |
+26.38% |
| Gold & Silver |
$XAU |
106.09 |
+1.42 |
+1.36% |
+50.14% |
| Bank |
$BKX |
113.94 |
+0.69 |
+0.61% |
+32.81% |
| Biotech |
$BTK |
5,160.03 |
-82.84 |
-1.58% |
+22.25% |
|
|
|
 |
Rebound Has Globant Perched Within Striking Distance of High
Kenneth J. Gruneisen - Passed the CAN SLIM® Master's Exam
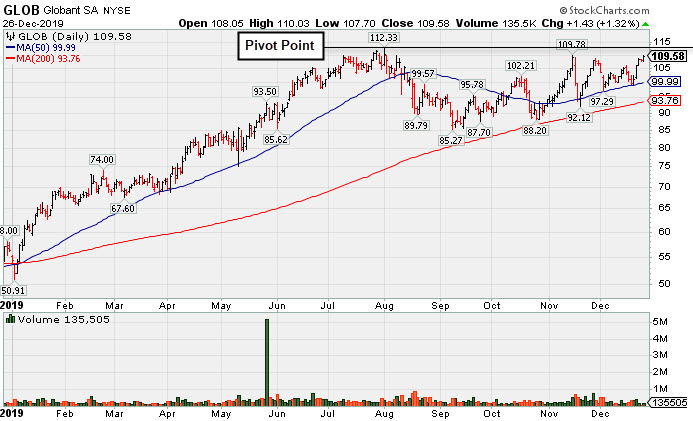
Globant SA (GLOB +$1.43 or +1.32% to $109.58) is perched within close striking distance of its prior high and only -2.4% off its 52-week high. Subsequent volume-driven gains for new highs are still needed to trigger a convincing technical buy signal. It found support above its 50-day moving average (DMA) line ($99.63) during the recent consolidation. Fundamentals remain strong.
GLOB went through a choppy consolidation after highlighted in yellow with pivot point cited based on its 8/01/19 high plus 10 cents in the 11/14/19 mid-day report (read here). It made gradual progress since last shown in this FSU section on 12/05/19 with an annotated graph under the headline, "Found Support at 50-Day Average During Choppy Consolidation".
It reported earnings +35% on +27% sales revenues for the Sep '19 quarter versus the year ago period, continuing its strong earning track record above the +25% minimum earnings guideline (C criteria). It has a strong annual earnings (A criteria) history and has a 97 Earnings Per Share Rating.
This Luxembourg-based Computer - Tech Services firm completed a Secondary Offering on 6/21/18. The number of top-rated funds owning its shares rose from 235 in Mar '18 to 523 in Sep '19, a reassuring sign concerning the I criteria. Its current Up/Down Volume Ratio of 1.4 is an unbiased indication its shares have been under accumulation over the past 50 days. It has a Timeliness rating of A and Sponsorship Rating of C. Its small supply of 36.6 million shares outstanding (S criteria) can contribute to greater volatility in the event of institutional buying or selling.
Charts courtesy of www.stockcharts.com
 |
|
|
Color Codes Explained :
Y - Better candidates highlighted by our
staff of experts.
G - Previously featured
in past reports as yellow but may no longer be buyable under the
guidelines.
***Last / Change / Volume data in this table is the closing quote data***
Symbol/Exchange
Company Name
Industry Group |
PRICE |
CHANGE
(%Change) |
Day High |
Volume
(% DAV)
(% 50 day avg vol) |
52 Wk Hi
% From Hi |
Featured
Date |
Price
Featured |
Pivot Featured |
|
Max Buy |
 MLR
-
NYSE
MLR
-
NYSE
Miller Industries Inc
AUTOMOTIVE - Auto Parts
|
$37.52
|
+0.28
0.75% |
$37.58
|
20,718
44.08% of 50 DAV
50 DAV is 47,000
|
$38.18
-1.73%
|
9/24/2019
|
$34.00
|
PP = $35.36
|
|
MB = $37.13
|
Most Recent Note - 12/23/2019 12:20:10 PM
G - Hovering near its 52-week high and just above its "max buy" level. Prior highs in the $35 area define initial support along with its 50 DMA line ($35.54). Resilient after reporting Sep '19 earnings which were below the fundamental guidelines of the fact-based investment system.
>>> FEATURED STOCK ARTICLE : Miller Still Quietly Hovering Above Prior Highs - 12/4/2019 |
View all notes |
Set NEW NOTE alert |
Company Profile |
SEC
News |
Chart |
Request a new note
C
A
S
I |
CCBG
-
NASDAQ
Capital City Bk Gp
BANKING - Regional - Mid-Atlantic Banks
|
$30.42
|
+0.10
0.33% |
$30.56
|
44,755
104.08% of 50 DAV
50 DAV is 43,000
|
$30.88
-1.49%
|
12/16/2019
|
$30.07
|
PP = $30.95
|
|
MB = $32.50
|
 Most Recent Note - 12/26/2019 11:53:30 AM
Y - Perched within close striking distance of its 52-week high, recently meeting resistance. Subsequent gains and a strong close above the new pivot point cited based on its 11/06/19 high plus 10 cents may trigger a new (or add-on) technical buy signal. Found support at its 50 DMA line ($29.20) during its orderly consolidation.
>>> FEATURED STOCK ARTICLE : Found Support at 50-Day Moving Average - 12/10/2019 |
View all notes |
Set NEW NOTE alert |
Company Profile |
SEC
News |
Chart |
Request a new note
C
A
S
I |
FTNT
-
NASDAQ
Fortinet Inc
Computer Sftwr-Security
|
$108.24
|
+0.46
0.43% |
$109.45
|
412,576
29.62% of 50 DAV
50 DAV is 1,393,000
|
$110.28
-1.85%
|
12/9/2019
|
$103.85
|
PP = $106.10
|
|
MB = $111.41
|
Most Recent Note - 12/23/2019 5:34:24 PM
Y - Posted a quiet gain today following a "negative reversal" with heavier volume on the prior session after hitting another new 52-week high. Confirming gains above the pivot point backed by at least +40% above average volume are needed to trigger a convincing technical buy signal. Prior high in the $97 area defines initial support to watch on pullbacks. See the latest FSU analysis for more details and a new annotated graph.
>>> FEATURED STOCK ARTICLE : Endured Distributional Pressure While Perched at High - 12/23/2019 |
View all notes |
Set NEW NOTE alert |
Company Profile |
SEC
News |
Chart |
Request a new note
C
A
S
I |
SPSC
-
NASDAQ
S P S Commerce Inc
COMPUTER SOFTWARE and SERVICES - Application Software
|
$56.48
|
-0.48
-0.84% |
$57.10
|
68,375
33.85% of 50 DAV
50 DAV is 202,000
|
$59.14
-4.50%
|
11/29/2019
|
$56.59
|
PP = $59.24
|
|
MB = $62.20
|
Most Recent Note - 12/26/2019 5:25:46 PM
Y - Still perched -4.5% off its all-time high. Subsequent gains above its pivot point backed by at least +40% above average volume are needed to trigger a new technical buy signal. Fundamentals remain strong.
>>> FEATURED STOCK ARTICLE : Perched Within Close Striking Distance of 52-Week High - 12/20/2019 |
View all notes |
Set NEW NOTE alert |
Company Profile |
SEC
News |
Chart |
Request a new note
C
A
S
I |
AUDC
-
NASDAQ
Audiocodes Ltd
ELECTRONICS - Scientific and Technical Instrum
|
$25.31
|
-0.17
-0.67% |
$25.59
|
145,030
54.32% of 50 DAV
50 DAV is 267,000
|
$26.00
-2.65%
|
9/13/2019
|
$19.68
|
PP = $19.84
|
|
MB = $20.83
|
Most Recent Note - 12/23/2019 12:42:48 PM
G - Perched at its all-time high, stubbornly holding its ground very extended from the previously noted base. Prior highs in the $22 area define support along with its 50 DMA line ($22.21). Fundamentals remain strong.
>>> FEATURED STOCK ARTICLE : Reversed Into Red After Hitting Yet Another New High - 12/13/2019 |
View all notes |
Set NEW NOTE alert |
Company Profile |
SEC
News |
Chart |
Request a new note
C
A
S
I |
Symbol/Exchange
Company Name
Industry Group |
PRICE |
CHANGE
(%Change) |
Day High |
Volume
(% DAV)
(% 50 day avg vol) |
52 Wk Hi
% From Hi |
Featured
Date |
Price
Featured |
Pivot Featured |
|
Max Buy |
CHDN
-
NASDAQ
Churchill Downs Inc
LEISURE - Gaming Activities
|
$135.24
|
+1.79
1.34% |
$135.54
|
177,378
62.90% of 50 DAV
50 DAV is 282,000
|
$137.42
-1.59%
|
10/8/2019
|
$129.77
|
PP = $132.83
|
|
MB = $139.47
|
Most Recent Note - 12/26/2019 5:24:50 PM
G - Posted a gain today challenging its best ever close and finished -1.6% off its 52-week high. Its 50 DMA line ($130.36) defines near-term support above the prior low ($121.81 on 11/07/19) The Jun and Sep '19 quarterly earnings versus the year ago periods were both below the +25% minimum guideline (C criteria) and raised fundamental concerns.
>>> FEATURED STOCK ARTICLE : Met Resistance After Rebounding Near Prior High - 12/9/2019 |
View all notes |
Set NEW NOTE alert |
Company Profile |
SEC
News |
Chart |
Request a new note
C
A
S
I |
LULU
-
NASDAQ
Lululemon Athletica
MANUFACTURING - Textile Manufacturing
|
$231.17
|
+2.14
0.93% |
$233.42
|
1,762,766
86.07% of 50 DAV
50 DAV is 2,048,000
|
$235.50
-1.84%
|
9/6/2019
|
$201.25
|
PP = $194.35
|
|
MB = $204.07
|
Most Recent Note - 12/23/2019 1:08:54 PM
G - Extended from any sound base, and its 50 DMA line ($215) defines near-term support above the prior high ($209). Recently reported earnings +28% on +23% sales revenues for the Oct '19 quarter.
>>> FEATURED STOCK ARTICLE : Retreated From High After Another Strong Earnings Report - 12/17/2019 |
View all notes |
Set NEW NOTE alert |
Company Profile |
SEC
News |
Chart |
Request a new note
C
A
S
I |
CPRT
-
NASDAQ
Copart Inc
SPECIALTY RETAIL - Auto Dealerships
|
$91.02
|
+0.11
0.12% |
$91.03
|
768,890
41.16% of 50 DAV
50 DAV is 1,868,000
|
$92.41
-1.50%
|
9/5/2019
|
$79.13
|
PP = $79.84
|
|
MB = $83.83
|
Most Recent Note - 12/26/2019 11:43:54 AM
G - Consolidating in a tight range well above its 50 DMA line ($86.17) which defines near-term support. Fundamentals remain strong.
>>> FEATURED STOCK ARTICLE : Extended From Prior Base and Hovering Near Record High - 12/12/2019 |
View all notes |
Set NEW NOTE alert |
Company Profile |
SEC
News |
Chart |
Request a new note
C
A
S
I |
NMIH
-
NASDAQ
N M I Holdings Inc Cl A
Finance-MrtgandRel Svc
|
$33.26
|
-0.81
-2.38% |
$34.41
|
606,739
121.11% of 50 DAV
50 DAV is 501,000
|
$35.79
-7.07%
|
11/8/2019
|
$32.89
|
PP = $31.44
|
|
MB = $33.01
|
Most Recent Note - 12/26/2019 11:42:29 AM
G - Consolidating above its "max buy" level. Its 50 DMA line ($32.09) and prior highs in the $30-31 area define important near-term support. Fundamentals remain strong.
>>> FEATURED STOCK ARTICLE : Hit New High But Encountered Distributional Pressure - 12/19/2019 |
View all notes |
Set NEW NOTE alert |
Company Profile |
SEC
News |
Chart |
Request a new note
C
A
S
I |
SPLK
-
NASDAQ
Splunk Inc
Computer Sftwr-Database
|
$151.92
|
+1.57
1.04% |
$153.66
|
845,732
40.54% of 50 DAV
50 DAV is 2,086,000
|
$152.68
-0.50%
|
11/25/2019
|
$147.79
|
PP = $142.16
|
|
MB = $149.27
|
Most Recent Note - 12/23/2019 12:46:29 PM
G - Color code is changed to green while consolidating above its "max buy" level following a volume-driven gain. Prior highs in the $142-143 area define initial support to watch on pullbacks.
>>> FEATURED STOCK ARTICLE : Consolidating Above Prior Highs Following Impressive Rally - 12/16/2019 |
View all notes |
Set NEW NOTE alert |
Company Profile |
SEC
News |
Chart |
Request a new note
C
A
S
I |
Symbol/Exchange
Company Name
Industry Group |
PRICE |
CHANGE
(%Change) |
Day High |
Volume
(% DAV)
(% 50 day avg vol) |
52 Wk Hi
% From Hi |
Featured
Date |
Price
Featured |
Pivot Featured |
|
Max Buy |
PAYC
-
NYSE
Paycom Software Inc
COMPUTER SOFTWARE and SERVICES - Application Software
|
$268.72
|
+4.08
1.54% |
$270.03
|
314,215
56.51% of 50 DAV
50 DAV is 556,000
|
$279.95
-4.01%
|
11/20/2019
|
$252.97
|
PP = $259.81
|
|
MB = $272.80
|
Most Recent Note - 12/23/2019 12:50:20 PM
Y - Volume totals have been cooling while quietly consolidating above its pivot point and below its "max buy" level. Fundamentals remain strong.
>>> FEATURED STOCK ARTICLE : Consolidating Near Prior Highs Which Define Initial Support - 12/11/2019 |
View all notes |
Set NEW NOTE alert |
Company Profile |
SEC
News |
Chart |
Request a new note
C
A
S
I |
BLD
-
NYSE
Topbuild Corp
Bldg-Constr Prds/Misc
|
$102.29
|
-1.66
-1.60% |
$103.93
|
102,801
34.27% of 50 DAV
50 DAV is 300,000
|
$113.74
-10.07%
|
12/9/2019
|
$109.71
|
PP = $113.84
|
|
MB = $119.53
|
Most Recent Note - 12/24/2019 2:36:25 PM
G - After damaging losses a rebound above its 50 DMA line ($105.74) is needed for its outlook to improve. See the latest FSU analysis for more details and a new annotated graph.
>>> FEATURED STOCK ARTICLE : Recent Slump Below 50-Day Moving Average Did Technical Damage - 12/24/2019 |
View all notes |
Set NEW NOTE alert |
Company Profile |
SEC
News |
Chart |
Request a new note
C
A
S
I |
GLOB
-
NYSE
Globant SA
Computer-Tech Services
|
$109.58
|
+1.43
1.32% |
$110.03
|
135,505
48.57% of 50 DAV
50 DAV is 279,000
|
$112.33
-2.45%
|
11/14/2019
|
$106.87
|
PP = $112.43
|
|
MB = $118.05
|
Most Recent Note - 12/26/2019 5:22:38 PM
G - Quietly edged above its November high close today and it is perched only -2.4% off its 52-week high. Subsequent gains above the pivot point backed by at least +40% above average volume are needed to trigger a technical buy signal. Its 50 DMA line ($100) defines important near-term support to watch on pullbacks. Fundamentals remain strong. See the latest FSU analysis for more details and a new annotated graph.
>>> FEATURED STOCK ARTICLE : Rebound Has Globant Perched Within Striking Distance of High - 12/26/2019 |
View all notes |
Set NEW NOTE alert |
Company Profile |
SEC
News |
Chart |
Request a new note
C
A
S
I |
|
|
|
THESE ARE NOT BUY RECOMMENDATIONS!
Comments contained in the body of this report are technical
opinions only. The material herein has been obtained
from sources believed to be reliable and accurate, however,
its accuracy and completeness cannot be guaranteed.
This site is not an investment advisor, hence it does
not endorse or recommend any securities or other investments.
Any recommendation contained in this report may not
be suitable for all investors and it is not to be deemed
an offer or solicitation on our part with respect to
the purchase or sale of any securities. All trademarks,
service marks and trade names appearing in this report
are the property of their respective owners, and are
likewise used for identification purposes only.
This report is a service available
only to active Paid Premium Members.
You may opt-out of receiving report notifications
at any time. Questions or comments may be submitted
by writing to Premium Membership Services 665 S.E. 10 Street, Suite 201 Deerfield Beach, FL 33441-5634 or by calling 1-800-965-8307
or 954-785-1121.
|
|
|